
Spring 1999
New Human Genome Web
Resource: A Nexus for Genome Data
DNA Sequences from Times Past in GenBank
Sequin 2.90 Offers Simplified Network Access
SAGEmap Offers a Versatile Interface to Gene Expression Data
Profile: PSI-BLAST's Impact is "High Profile"
BLAST Lab
Mandatory Protocol for EST Submissions to Take Effect Soon
Frequently Asked Questions
Selected Recent Publications by NCBI Staff
Masthead
Completion of the sequencing and analysis of the human genome promises to be a complex task that will involve cooperation among researchers applying diverse tools to the problem. The data generated will be reported in a variety of forms reflecting this diverse set of tools. Genetic and physical maps, markers, nucleotide polymorphisms, disease phenotypes, expression profiles, and sequence data must be integrated and made accessible for analysis. A repository of sequence data represents a natural site for construction of a nexus into which data in many forms can flow and from which these data can be accessed. NCBI’s Human Genome Resources page, designed to serve as such a nexus, is closely connected to the GenBank sequence database and also provides centralized access to a full range of human genome resources available within NCBI and elsewhere.
From the NCBI home page, the Human Genome Resources link leads to an organized set of links to human genome data in many forms. A screen clip of the upper half of the page is shown below. The first collection of links, called The Genome at a Glance, is an array of 24 chromosome ideograms serving as links to GeneMap ’98 (GeneMap ’99 coming soon). Clicking on one of these chromosomes leads to radiation hybrid (RH) mapping data as well as information on gene distributions and gene-disease associations.
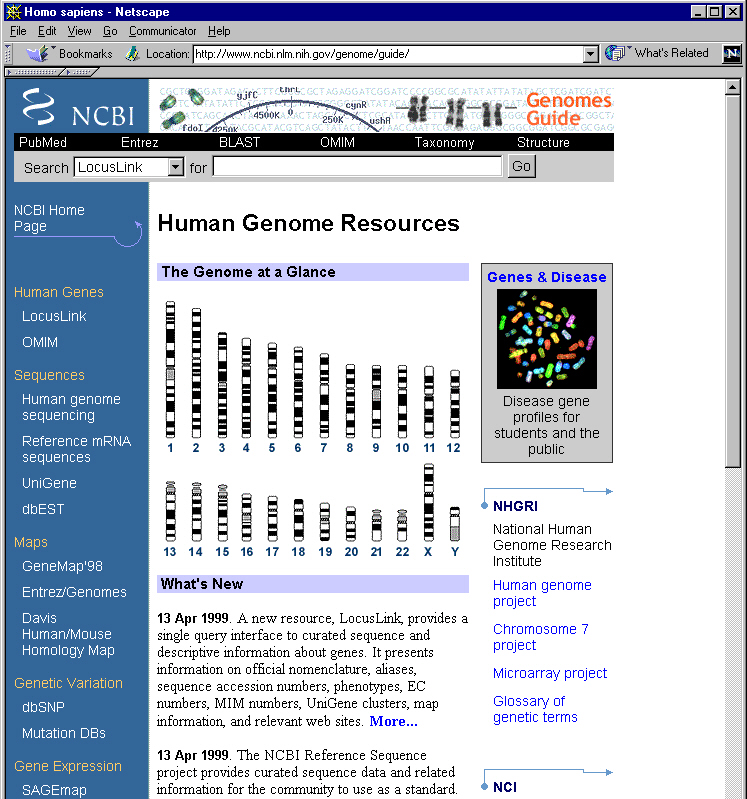
Partial display of recently introduced Human Genome
Resources page on NCBI's Web site.
A Search Box for LocusLink
A query box spanning the top of the page can be used to conduct a text search of any of six major NCBI resources. The default target is LocusLink, a new nomenclature cross-referencing tool developed by Donna Maglott. LocusLink allows searches that begin with queries as diverse as official gene names, aliases, sequence accession numbers, protein names, phenotypes, EC numbers, MIM numbers, other database identifiers, UniGene clusters, or mapping information to converge upon the same data. The target database can be changed from LocusLink to MEDLINE, OMIM, GenBank, GeneMap ’98, or UniGene.
A Column of Links to the Left
A blue column along the left of the page contains an array of links to a variety of human genome data. A link to OMIM (Online Mendelian Inheritance in Man) provides access to over 10,000 descriptions of genetic diseases and genes, stressing genotype-phenotype correlations. A pointer to GeneMap ’98 provides access to mapping data on over 35,000 human genes. Gateways to UniGene, dbEST, and the Davis Human/Mouse Homology Map follow. There are also links for dbSNP, leading to a database of single nucleotide polymorphisms, and Mutation DBs, pointing to 27 disease-specific databases.
Of particular interest are links to Human Genome Sequencing, Reference mRNA Sequences, and SAGEmap. The first two of these resources are described below. The third, SAGEmap, is a new NCBI database of quantitative gene expression and is the subject of a separate article in this issue of the NCBI News.
A Look at the Genome Sequencing Page
The Genome Sequencing site, developed by Greg Schuler, is an important new resource supporting the human sequencing effort. From the Human Genome Resources page, follow the Human Genome Sequencing link to reach a colorful graphical display of genome sequencing progress. Finished sequence is indicated by hot red and orange bands on a set of chromosome ideograms. These data are also available in numerical form. A link labeled More Statistics leads to a table giving sequencing progress by chromosome. The table is extended with more links to the individual contigs involved. A query box at the head of the page provides access to a database of contigs plus six other NCBI databases. Down the left side of the page is a column of links pointing to genome sequencing centers, a contig browser, chromosome-specific BLAST searches, and information on downloading sequences.
A Quick Look at RefSeq
RefSeq, a project developed by Kim Pruitt that provides reference sequences for chromosomes, mRNAs, and proteins, is reached via the Reference mRNA Sequences link. RefSeq standards provide a foundation for functional annotation of the genome. They provide a stable reference point for mutation analysis, studies of gene expression, and polymorphism discovery. In addition, RefSeq-to-LocusLink associations anchor UniGene clusters and support annotation of genomic contig sequence data generated by the Human Genome Project. RefSeq records are available through BLAST, Entrez, and LocusLink.
More Links to the Right
The right side of the Human Genome Resources page is also lined with many links. The first is a pointer to the NCBI Genes and Disease page, which gives synopses of over 60 diseases of genetic origin and provides links to the literature and sequence databases. Below this is a block of links to resources of the National Human Genome Research Institute (NHGRI), including its home page, the Human Genome Project page, and a glossary of genetic terms.
A National Cancer Institute (NCI) block offers gateways to cGAP, cCAP, CancerNet, and the NCI home page. The path to cGAP allows access to gene expression data for normal, precancerous, and cancerous cells derived from the 121 sequence libraries of the Cancer Genome Anatomy Project. The database currently contains expression data for over 20,000 human genes. For data on physical chromosomal defects associated with cancer, follow the cCAP link to the Cancer Chromosomal Aberration Project.
News Items
The Human Genome Resources page also features a central block of short newspaper-style announcements. Currently grouped under the headings What’s New and Human Genome Meetings, these items run the gamut from synopses of new human genome resources at NCBI to notices of symposia and workshops to recent news bulletins of relevance to the Human Genome Project.
Although GenBank lacks dinosaur DNA, fragments of genomes past can be found here. A practical limit of about 100,000 years currently applies to the age of recoverable DNA samples. Beyond this limit, hydrolysis of the phosphate backbone of the DNA and oxidative damage to the bases that make up the DNA sequence become too great to allow for efficient PCR amplification. This is why deposition of significant amounts of dinosaur sequence (age ł 65 million years) in GenBank is unlikely to occur in the near future. However, many DNA sequences arising from extinct organisms and ancient genomes are in the database today, and the number is expected to grow as technology for the extraction and amplification of aged DNA progresses. A selection of sequences from the past now available in GenBank is given below.
| AF011222:
Mitochondrial DNA from a Neanderthal specimen discovered in 1856 near Dusseldorf, Germany.
Source: Bone (3.5 g of right humerus). Age of Source: 30,000 to 100,000 years. Length: 379
bp. S69989: Mitochondrial DNA from the Late Neolithic "Iceman" found mummified in the Tyrolean Alps. Source: Soft tissue. Age of Source: 5,000 years. Length: 354 bp. X73306: Mitochondrial DNA from Egyptian mummy. Source: Tarsus bone. Age of Source: 2,000 years. Length: 122 bp. K02137: Alu-repeat family DNA sequence from Egyptian mummy. Source: Mummified soft tissue. Age of Source: 2,400 years. Length: 919 bp. X88771: Ribosomal RNA gene from an Iceman fungal clone. Source: Grass clothing of the Iceman (cloak, boots). Age of Source: 5,000 years. Length: 495 bp. Z48945: Ribosomal RNA gene from an extinct giant ground sloth. Source: Bone, teeth, and coprolites. Age of Source: 13,000 years. Length: 571 bp. L08480: Mitochondrial DNA from an extinct legume. Source: Leaf embedded in Dominican amber. Length: 348 bp. D50842: Mitochondrial DNA from an extinct woolly mammoth (the baby Magadan mammoth known as Dima). Source: 1 g of muscle. Age of Source: 40,000 years. Length: 1,137 bp. S72502: Mitochondrial DNA from the extinct Siberian woolly mammoth. Source: Humerus cortical bone. Length: 242 bp. D83049: Mitochondrial DNA from the extinct Stellar’s sea cow, a relative of the manatee. Source: Bone (2 g of bone from a scapula collected on Bering Island, Kamchatka). Length: 1,005 bp. X64307: Mitochondrial DNA from a quagga (an extinct relative of the zebra from southern Africa). Length: 117 bp. S46659: Mitochondrial ribosomal RNA from Smilodon fatalis, the saber-toothed tiger found in the Rancho La Brea Tar Pits in Los Angeles, California. Source: Bone from three specimens. Age of Source: 14,000 years. Length: 132 bp. X67636: Mitochondrial ribosomal RNA of the Moa, an extinct bird. Source: Bones and soft tissues of four species of Moa. Length: 386 bp. S78028: Mitochondrial DNA from Medieval French rabbits. Source: 1 to 4 g of bone. Age of Source: 400 to 600 years. Length: 233 bp. |
Sequin can function in either a stand-alone mode or a “network- aware” mode. The stand-alone mode provides the functions needed to prepare most sequence submissions. In its network-aware mode, however, Sequin acquires additional functionality through online access to GenBank and NCBI’s sequence analysis tools. For instance, network-aware Sequin can download sequences from GenBank in order to facilitate submitting multiple sequence alignments that include existing GenBank sequences. Network-aware Sequin can also conduct PowerBLAST searches, perform Entrez queries, and screen for the presence of contaminating vector sequences or repeat elements within a sequence submission. Setting up Sequin to communicate over the network has been simplified in version 2.90, which is now available at ftp://ncbi.nlm.nih.gov/sequin/.
Sequin’s Network Configuration option, available on the initial Welcome to Sequin page as well as in the record viewer, is located under the Misc menu. To configure Sequin to use the network, most users need only select the Normal connection and click on Accept to begin the configuration. Users who are behind a firewall may need to contact their system administrator in order to fill in the Proxy and Port fields. Users outside the United States or with an unreliable Internet connection may need to increase the “timeout” value, which is the length of time Sequin will wait for a response from the network. Sequin must be restarted in order for the network configuration changes to take effect.
Serial Analysis of Gene Expression (SAGE) refers to a technique for taking a snapshot of the messenger RNA population of a cell. The elements of the film, in this case, are oligonucleotides, each consisting of a concatenated array of short, 20- to 24-bp sequence tag pairs, or ditags. Each 10- to 12-bp tag of the ditag pair represents one parent messenger RNA. Many of these concatenated arrays are combined within a SAGE "library." The number of times a particular tag is detected in a library gives a digital measure of the abundance of its associated mRNA and, hence, provides a quantitative measure of gene expression. By using the SAGE technique, coupled with high-throughput sequencing technology, it is possible to obtain accurate expression data for thousands of genes within a cell. A major application of SAGE is in the identification of abnormal gene expression leading to, or diagnostic of, various disease states, such as cancer. NCBI’s SAGEmap site, developed by Alex Lash and introduced in March 1999, implements many functions useful in the analysis of SAGE data.
Mapping Tools
SAGEmap provides tag-to-gene as well as gene-to-tag mappings. Both mappings are updated weekly, immediately following the updating of UniGene.
The tag-to-gene function maps a SAGE tag to one or more UniGene clusters. It also produces a table listing the SAGE libraries in which the gene tag occurs, the number of occurrences per library, and the total number of tags in the library. Following a link to a SAGE library leads to more information about the library and allows one to download the SAGE tag data. The full tag-to-gene mapping data for all the SAGE libraries, or a "reliably mapped" subset of these data, may also be downloaded as a single file.
The inverse function, gene-to-tag mapping, maps a UniGene cluster ID to the SAGE tags found within the cluster. For each SAGE tag found, library information is given. A link to the UniGene cluster used as the query leads to the UniGene page for this cluster.
SAGE Data Analysis
SAGEmap can construct a user-configurable table of data comparing one group of SAGE libraries with another. Several CGAP SAGE libraries are currently available and may be included in the table. Libraries included in the table are assigned to one of two groups, A or B, between which a comparison can be made. For each group, the user specifies which tags within the designated libraries should be included in the table. A logical AND specifies that tags be included only if they are expressed in all libraries making up the group. A logical OR specifies that tags be included regardless of groupwide expression. Tags having wide intragroup variations in expression may be excluded from the comparison.
Tags may also be included in the table on the basis of intergroup expression differences. In this case, three schemes are available: OR, to include all tags; XOR, to include tags expressed in one group but not in the second group; AND, to include only tags expressed in both groups. A minimum difference threshold for use between groups may be defined. When the tabular display parameters are set, a click on the Results button displays the SAGE expression table.
For each SAGE tag, the expression table includes columns giving the associated UniGene cluster ID and the cluster description. A column summarizing the expression of each tag in groups A and B is colored red if the level is higher in group A and green if the level is higher in group B. The definition of "higher" depends on the difference threshold specified by the user.
SAGEmap may be reached from the NCBI home page, the Human Genome Resources page, or directly at http://www.ncbi.nlm.nih.gov/SAGE.
To facilitate the submission of EST sequences, which are usually submitted in large batches, GenBank has offered a streamlined EST submission procedure using a specialized data format. Beginning May 31, 1999, the use of this specialized format will become mandatory for all EST submissions. EST submissions made with either BankIt or Sequin will no longer be accepted.
Expressed Sequence Tags (ESTs) are short (300 to 500 bp) single reads from cDNA complementary to mRNA, which are usually produced in large numbers. ESTs are useful in providing a snapshot of the mRNA population characteristic of a given tissue or of a given tissue at a particular developmental stage. EST sequences now represent approximately 70% of the sequences in GenBank and constitute the most rapidly growing GenBank division.
For instructions on using GenBank’s specialized EST submission format, see http://www.ncbi.nlm.nih.gov/dbEST/how_to_submit.html.
Completed EST submissions should be mailed to batch-sub@ncbi.nlm.nih.gov. After May 31, GenBank will no longer accept EST submissions at the gb-sub@ncbi.nlm.nih.gov address.
Comparison, whether of morphological features or protein sequences, lies at the heart of biology. The introduction of BLAST in 1990 made it easier to rapidly scan huge sequence databases for overt homologies and statistically evaluate the resulting matches. With more than 8,700 citations to date, the paper describing the original algorithm1 has since become the most heavily cited of the decade.2
Not all significant homologies are overt, however. Some of the most interesting are subtle and do not rise to statistical significance during a standard BLAST search. NCBI’s Stephen Altschul has extended BLAST and its statistical methodology to address the problem of detecting weak but significant sequence similarities. With a small group of other NCBI researchers, he has developed Position-Specific Iterated BLAST (PSI-BLAST), which searches sequence databases with a profile constructed from BLAST alignments.
As Altschul notes, "PSI-BLAST is by no means the first program for searching sequence databases with protein profiles. However, it is the first program fully to automate the construction of these profiles from the output of a standard database search, and the first to apply fast heuristic search techniques to profile comparison. As such, it has for the first time rendered the powerful profile-search methodology accessible to the non-expert."
Indeed, PSI-BLAST has proven to be popular. Among scientific articles published in the past 2 years, the 1997 paper describing PSI-BLAST
3 has been the most heavily cited for the fourth 2-month interval in a row, with over 700 citations to date, according to statistics compiled by the Institute for Scientific Information. Due to this strong citation record, PSI-BLAST and its development team were featured in the April 12, 1999, issue of The Scientist.2Just as users of PSI-BLAST are a diverse group, so are its developers, with backgrounds spanning genetics, physics, and medicine.
Stephen Altschul, Ph.D., leads the PSI-BLAST development team. He received his Ph.D. in mathematics from MIT in 1987 and joined the Computational Biology Branch of NCBI in 1989, shortly after its creation. His research continues to center on measures, algorithms, and statistics for the comparison of DNA and protein sequences.
Alejandro Schäffer, Ph.D., wrote most of the PSI-BLAST source code. His current interests include development of software for genetics, including genetic linkage analysis, sequence analysis, and modeling genetic changes in tumor progression.
Tom Madden, Ph.D., is the main BLAST programmer at NCBI. He received a doctorate in physics from the University of California at Santa Cruz. After performing postdoctoral work in biophysics at Brandeis University, he joined NCBI in 1993, and has since been involved in all BLAST development.
David Lipman, M.D., has been a driving force behind improved database searches for more than a decade. In 1988, he and William Pearson authored a seminal paper describing a predecessor to the BLAST search, the well-known FASTA search.
4 Since his appointment as Director of NCBI in 1989, he has continued to take a lead role in development of BLAST and its specialized variants.A tutorial based on a recent PSI-BLAST introductory article has been prepared by Altschul.
5 It can be accessed via the BLAST Course link on the main BLAST page.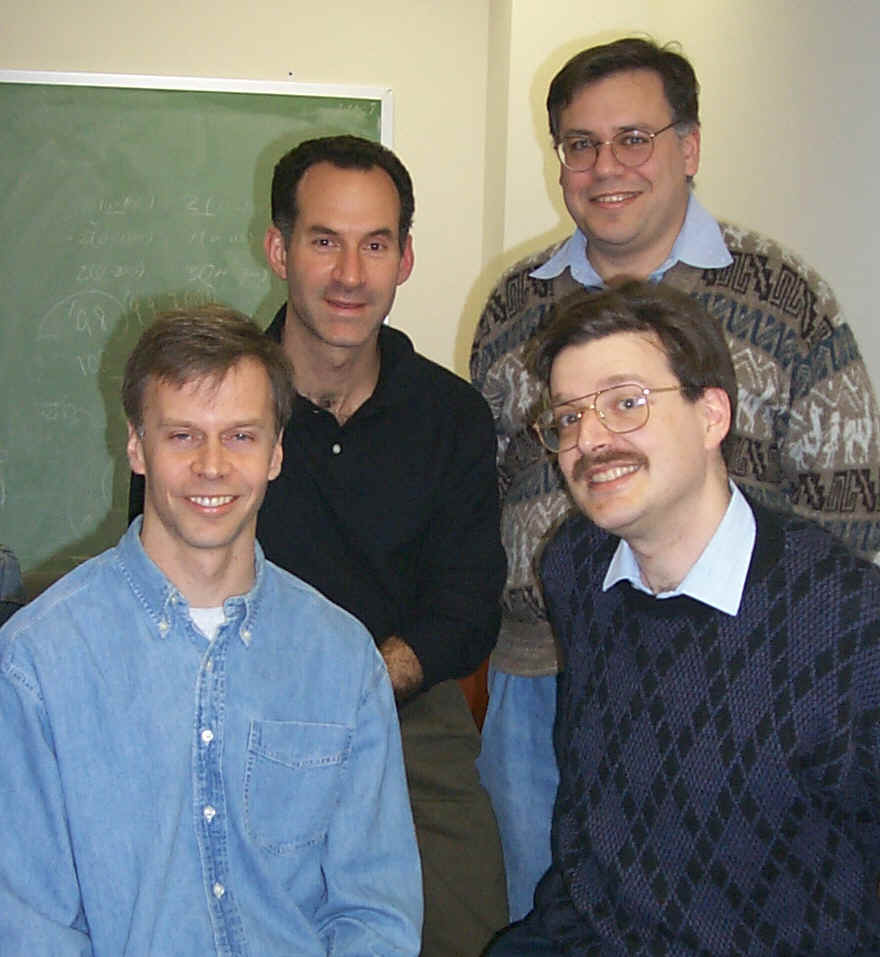
Notes
1. Altschul, SF, et al. Basic local alignment search tool. J Mol Biol 215(3):403–10, 1990.
2. Russo, E, and S Bunk, eds. Hot papers. The Scientist 13(8):15, 1999.
3. Altschul, SF, et al. Gapped BLAST and PSI-BLAST: A new generation of protein database search programs. Nucleic Acids Res 25(17):3389–402, 1997.
4. Pearson, WR, and DJ Lipman. Improved tools for biological sequence comparison. Proc Natl Acad Sci USA 85(8):2444–8, 1988.
5. Altschul, SF, and EV Koonin. Iterated profile searches with PSI-BLAST—a tool for discovery in protein databases. Trends Biochem Sci 23(11):444–7, 1998.

PSI-BLAST uses the pairwise alignments it creates between query and database sequences during a preliminary BLAST search to construct a Position-Specific Scoring Matrix, or PSSM.1 This PSSM is then used in place of the usual combination of query and scoring matrix during the first PSI-BLAST iteration. The PSSM is updated at the beginning of each subsequent PSI-BLAST iteration using the data from all significant alignments generated during the previous iteration. Stand-alone PSI-BLAST can write a "checkpoint" file at the end of a search; this file contains the information necessary to regenerate the last PSSM used. PSI-BLAST can also load a previously stored checkpoint file to conduct a search using a previously computed PSSM. Because the PSSM encapsulates information derived from PSI-BLAST alignments, the inspection of this matrix may provide insights into the sequence patterns present within the query.
This BLAST Lab describes how to write and load checkpoint files using the stand-alone version of PSI-BLAST. Instructions are also given for producing an ASCII version of the PSI-BLAST PSSM.
Installing Stand-alone PSI-BLAST
Packages for installing stand-alone PSI-BLAST on a variety of computer platforms are found at ftp://ncbi.nlm.nih.gov/blast/executables/. The PC self-extracting archive is "blastz.exe." Unix packages are those ending in ".Z".
See BLAST Lab in the Winter 1999 NCBI News for details on archive extraction.
Writing a Checkpoint File
The command line below will run PSI-BLAST using the sequence query contained in a file named "tf1.fsa".
blastpgp -i tf1.fsa -o tf1.out -d ecoli -j 2 -C tf1.chk
The output will be written to "tf1.out". The local database to be searched is named "ecoli". The switch "-j 2" instructs PSI-BLAST to run one regular BLAST round followed by one PSI-BLAST iteration. The syntax "-C tf1.chk" ("C" stands for "checkpoint") specifies that a checkpoint file called "tf1.chk" be saved after the search. This checkpoint file can be loaded later to perform a search of a different database as described below.
Loading a Checkpoint File
PSI-BLAST can use a previously stored checkpoint file to reconstruct a PSSM fabricated by PSI-BLAST during a previous search. This feature enables you to search two separate databases with the same query and PSSM. In the example above, a checkpoint file, "tft1.chk", was saved after a PSI-BLAST search of the local database "ecoli" using the query contained in "tf1.fsa". A search of a second local database, named "saureusi", can be conducted with the same query and PSSM by using the command line below.
blastpgp -i tf1.fsa -o tf1.out -d saureusi -j 2 -R tf1.chk
In this case, the checkpoint file, "tf1.chk", is read using the "-R" switch ("R" stands for "restart"). When using the "-R" switch, the query sequence must be identical to that which was used to generate the checkpoint file to be read.
Inspecting a Stored PSSM
ASCII versions of the PSI-BLAST PSSM may be written to a file using the new command
line switch "-Q" followed by the name to be given to the file. A syntax such as
blastpgp -i tf1.fsa -j 3 -Q pssm.dat
will save the PSSM used in the last PSI-BLAST iteration in an ASCII file named
"pssm.dat".
The syntax below will read a checkpoint file called
"tf1.chk", run one iteration of PSI-BLAST, and save an ASCII version of the PSSM
used in the file "pssm.dat".
blastpgp -i tf1.fsa -R tf1chk -Q pssm.dat
To use the new "-Q" switch with the blastpgp program, download the latest stand-alone BLAST distribution (version 2.0.9).
Note
1. Altschul SF, TL Madden, AA Schäffer, J Zhang, Z Zhang, W Miller, and DJ Lipman. Gapped BLAST and PSI-BLAST: A new generation of protein database search programs. Nucleic Acids Res 25(17):3389–402, 1997.
| The BLAST Lab feature is intended to provide detailed technical information on some of the more specialized uses of the BLAST family of programs. Topics are selected from the range of questions received by the BLAST Help Group. |
 |
Frequently Asked Questions |
| Is there any way to determine the total number of organisms currently represented in GenBank? | Yes, you can obtain a monthly updated count of the number of organisms represented in GenBank at http://www.ncbi.nlm.nih.gov/Taxonomy/Taxresources/taxaJan0197.html. This page presents a table giving the total GenBank species count for each year since 1995. The table also gives yearly subtotals for Viruses, Bacteria, Archaea, and Eukaryota. |
| How can I determine which portions of my nucleic acid sequence will be considered to be of low complexity during a filtered blastn search? | Blastn uses a program called DUST to filter nucleic acid sequences for low complexity. DUST is available as source code and in the form of Unix binaries at ftp://ncbi.nlm.nih.gov/pub/tatusov/dust/version1/. To see the results of filtering for a FASTA-formatted nucleic acid sequence in a file called, for example, "nuc.fsa", execute DUST as follows: dust nuc.fsa. |
| I am looking for GeneMap ’98, but I no longer see this as a link on the NCBI home page. Does NCBI have a search engine I can use to find it? | GeneMap ’98 is now accessible via a link from the new Human Genome Resources page. You can also use NCBI’s new search engine to find it by entering GeneMap into the search box and pressing the Search button. A link directly to GeneMap ’98 will appear as the first hit. The NCBI search engine is reached through a link on the NCBI home page. |
| I am interested in an old GenBank record entry that does not show a CDS feature. How can I determine where a coding region might be? | You can do this easily by pasting the sequence into NCBI’s ORF Finder or by simply specifying a GenBank accession or gi number. ORF Finder will search for Open Reading Frames over the entire sequence or over a range of nucleotides within the sequence using any of 15 genetic codes. A link to ORF Finder is found on the NCBI home page. |
| On your FTP server, I have only seen files containing the entire EST division. Can I download the three subdivisions of human, murine, and other ESTs separately? | Yes, you can download the raw sequence data in this way. The EST data sets are available separated by organism, but only in FASTA format and not as full GenBank records. These FASTA sequence files are available at ftp://ncbi.nlm.nih.gov/blast/db/. From the NCBI home page, select Anonymous FTP, then BLAST, and then the db subdirectory. You will see est_human.z, est_mouse.z, and est_others.z. |
Aravind, L, DR Walker, and EV Koonin. Conserved domains in DNA repair proteins and evolution of repair systems. Nucleic Acids Res 27(5):1223–42, 1999.
Aravind, L, VM Dixit, and EV Koonin. The domains of death: evolution of the apoptosis machinery. Trends Biochem Sci 24(2):47–53, 1999.
Desper, R, F Jiang, OP Kallioniemi, H Moch, CH Papadimitriou, and AA Schäffer. Inferring tree models for oncogenesis from comparative genome hybridization data. J Comput Biol 6(1):37–51, 1999.
Galperin, MY, and D Frishman. Toward automated prediction of protein function from microbial genomic sequences. Methods of Microbiology 28:245–63. London: Academic Press, 1999.
Kuehl, PM, JM Weisemann, JW Touchman, ED Green, and MS Boguski. An effective approach for analyzing "Prefinished" genomic sequence data. Genome Res 9(2):189–94, 1999.
Menotti-Raymond, M, VA David, LA Lyons, AA Schäffer, JF Tomlin, MK Hutton, and SJ O’Brien. A genetic linkage map of microsatellites in the domestic cat. Genomics 57(1):9–23, 1999.
Pesole, G, S Liuni, G Grillo, M Ippedico, A Larizza, W Makalowski, and C Saccone. UTRdb: a specialized database of 5˘ and 3˘ untranslated regions of eukaryotic mRNAs. Nucleic Acids Res 27(1):188–91, 1999.
Schäffer, AA. Computing probabilities of homozygosity by descent. Genet Epidemiol 16(2):135–49, 1999.
Wolf, YI, SE Brenner, PA Bash, and EV Koonin. Distribution of protein folds in the three superkingdoms of life. Genome Res 9(1):17–26, 1999.
NCBI News is distributed four times a year. Beginning in 1999, issues are dated Winter, Spring, Summer, and Fall. We welcome communication from users of NCBI databases and software and invite suggestions for articles in future issues. Send correspondence to NCBI News at the address below.
NCBI News
National Library of Medicine
Bldg. 38A, Room 8N-803
8600 Rockville Pike
Bethesda, MD 20894
Phone: (301) 496-2475
Fax: (301) 480-9241>
E-mail: info@ncbi.nlm.nih.gov
Editors
Dennis Benson
Barbara Rapp
Contributors
Stephen Altschul Donna Maglott
Jonathan Kans Kim Pruitt
Alex Lash
Greg
Schuler
Writer
David Wheeler
Editing, Graphics, and Production
Marla Fogelman
Veronica Johnson
Jennifer Vyskocil
Photography
Fran Beckwith
Design Consultant
Troy M. Hill
In 1988, Congress established the National Center for Biotechnology Information as part of the National Library of Medicine; its charge is to create information systems for molecular biology and genetics data and perform research in computational molecular biology.
The contents of this newsletter may be reprinted without permission. The mention of trade names, commercial products, or organizations does not imply endorsement by NCBI, NIH, or the U.S. Government.
NIH Publication No. 99-3272
ISSN 1060-8788
ISSN 1098-8408 (Online Version)