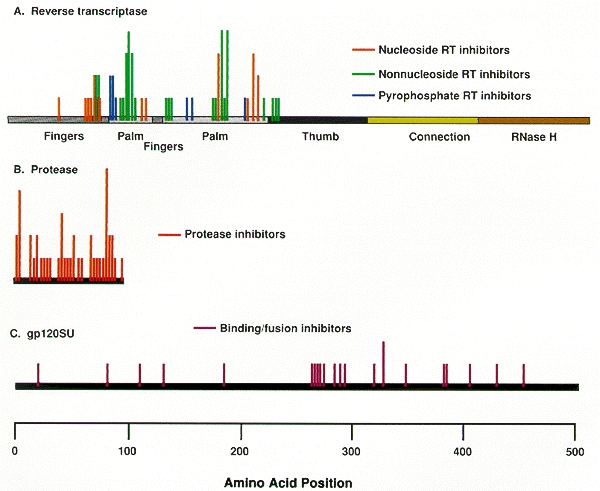
Figure 11. Distribution of mutations associated with drug-resistant HIV-1.

Figure 11

Distribution of mutations associated with drug-resistant HIV-1. The vertical bars indicate the location of mutations associated with resistance to inhibitors of the indicated class, with the height of each bar representing the number of different mutations observed at each amino acid position, not the frequency of isolation. Structural features of the three target proteins are also indicated. Shown here are 124 different mutations at 90 sites (from Table 5).

From: Pharmacologic Approaches
Cover of Retroviruses
Retroviruses.
Coffin JM, Hughes SH, Varmus HE, editors.
Cold Spring Harbor (NY): Cold Spring Harbor Laboratory Press; 1997.
Copyright © 1997, Cold Spring Harbor Laboratory Press.

NCBI Bookshelf. A service of the National Library of Medicine, National Institutes of Health.