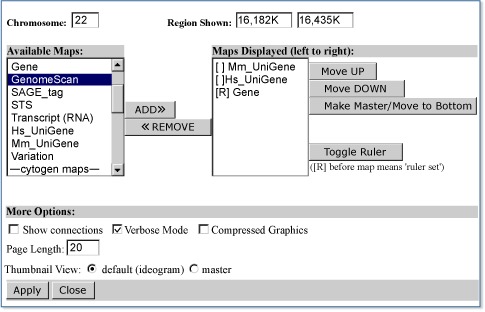
The menus and boxes in this window allow definition of the range of the chromosome to display (Region Shown:), selection of the new map(s) to add to the display (Available Maps:), establishment of the order and ruler options [Maps Displayed (left to right):], control of the display of lines connected to related objects on different maps (Show connections box), control of the length of the label on the rightmost (Master) map (Verbose Mode box), compression of the graphic (Compressed Graphics box), control of the number of labels on the Master map (Page Length: box), and control of the diagram in the Thumbnail View:. To add map(s) to the display, select the map name(s) and then click on ADD>>. To remove map(s) from the display, select the map name(s) in the Maps Displayed box and then click on <<REMOVE. Please note that this is an example of a configuration that might be useful in displaying gene-related information, i.e., maps of UniGene, Gene, and GenomeScan.