NCBI Bookshelf. A service of the National Library of Medicine, National Institutes of Health.
Lawrence V, Jacobs B, Dennehy C, et al. Milk Thistle: Effects on Liver Disease and Cirrhosis and Clinical Adverse Effects. Rockville (MD): Agency for Healthcare Research and Quality (US); 2000 Oct. (Evidence Reports/Technology Assessments, No. 21.)
This publication is provided for historical reference only and the information may be out of date.
Milk Thistle: Effects on Liver Disease and Cirrhosis and Clinical Adverse Effects.
Show detailsFigure 1-1 . Aspartate aminotransferase, less drug study, <45 days
Figure 1-2 . Aspartate aminotransferase, less drug study, <45 days
Figure 1-3 . Aspartate aminotransferase, less drug study, <45 days
Figure 1-4 . Aspartate aminotransferase, less drug study, 90 days
Figure 1-5 . Aspartate aminotransferase, less drug study, 90 days
Figure 1-6a . Aspartate aminotransferase, less drug study, 90 days
Figure 1-6b . Aspartate aminotransferase, less drug study, less outlier, 90 days
Figure 1-7 . Aspartate aminotransferase, <45 days
Figure 1-8 . Aspartate aminotransferase, <45 days
Figure 1-9 . Aspartate aminotransferase, <45 days
Figure 1-10 . Aspartate aminotransferase, 90 days
Figure 1-11 . Aspartate aminotransferase, 90 days
Figure 1-12a . Aspartate aminotransferase, 90 days
Figure 1-12b . Aspartate aminotransferase, less outlier, 90 days
Figure 1-13 . Alanine aminotransferase, less drug study, <45 days
Figure 1-14 . Alanine aminotransferase, less drug study, <45 days
Figure 1-15a . Alanine aminotransferase, less drug study, <45 days
Figure 1-15b . Alanine aminotransferase, less drug study, less outlier, <45 days
Figure 1-16 . Alanine aminotransferase, less drug study, 90 days
Figure 1-17 . Alanine aminotransferase, less drug study, 90 days
Figure 1-18 . Alanine aminotransferase, less drug study, 90 days
Figure 1-19 . Alanine aminotransferase, <45 days
Figure 1-20 . Alanine aminotransferase, <45 days
Figure 1-21a . Alanine aminotransferase, <45 days
Figure 1-21b . Alanine aminotransferase, less outlier, <45 days
Figure 1-22 . Alanine aminotransferase, 90 days
Figure 1-23 . Alanine aminotransferase, 90 days
Figure 1-24 . Alanine aminotransferase, 90 days
Figure 1-25 . Gammaglutamyl transpeptidase, <45 days
Figure 1-26 . Gammaglutamyl transpeptidase, <45 days
Figure 1-27 . Gammaglutamyl transpeptidase, <45 days
Figure 1-28 . Gammaglutamyl transpeptidase, 90 days
Figure 1-29 . Gammaglutamyl transpeptidase, 90 days
Figure 1-30 . Gammaglutamyl transpeptidase, 90 days
Figure 1-31 . Alkaline phosphatase, <45 days
Figure 1-32 . Alkaline phosphatase, <45 days
Figure 1-33 . Alkaline phosphatase, <45 days
Figure 1-34 . Bilirubin, <45 days
Figure 1-35 . Bilirubin, <45 days
Figure 1-36 . Bilirubin, <45 days
Figure 1-37 . Bilirubin, 90 days
Figure 1-38 . Bilirubin, 90 days
Figure 1-39 . Bilirubin, 90 days
Figure 1-40 . Albumin, 90 days
Figure 1-41 . Albumin, 90 days
Figure 1-42 . Albumin, 90 days
Figure 1-43 . Prothrombin time, 90 days
Figure 1-44 . Prothrombin time, 90 days
Figure 1-45 . Prothrombin time, 90 days
Figure 1-1. Aspartate aminotransferase, less drug study, <45 days Begg's funnel plot with pseudo 95% confidence limits

Figure 1-2. Aspartate aminotransferase, less drug study, <45 days
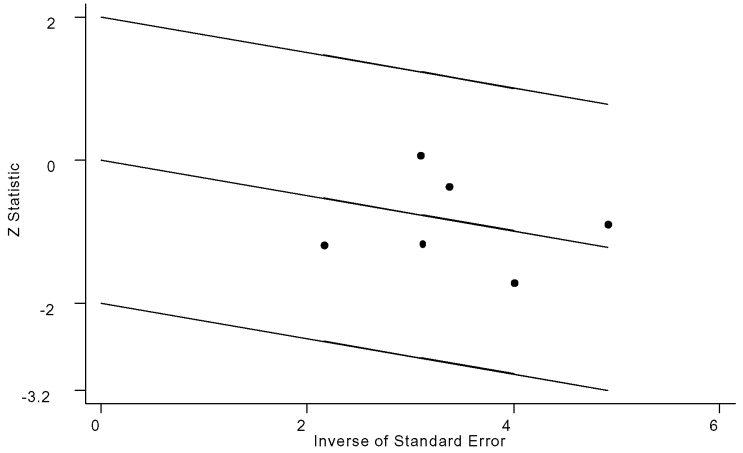
Figure 1-3. Aspartate aminotransferase, less drug study, <45 days
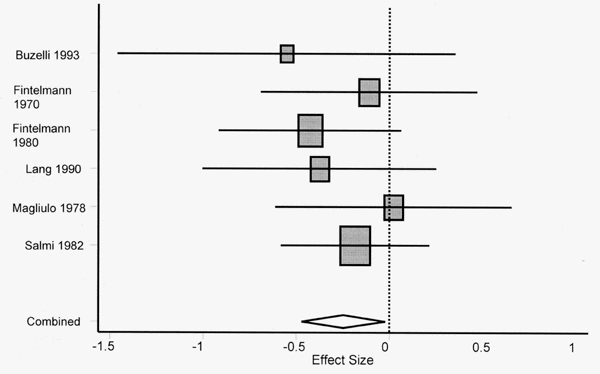
Figure 1-4. Aspartate aminotransferase, less drug study, 90 days Begg's funnel plot with pseudo 95% confidence limits
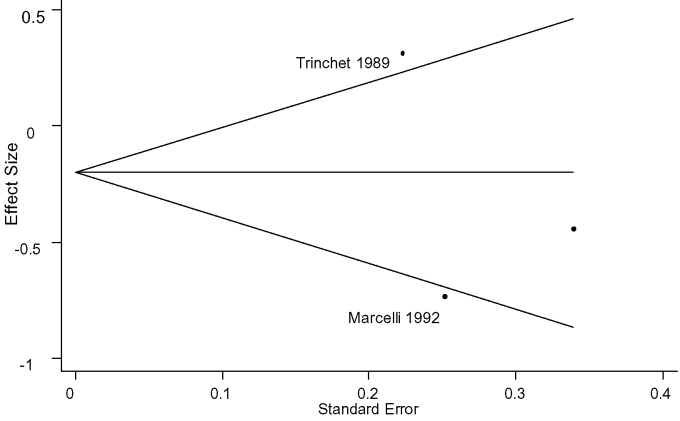
Figure 1-5. Aspartate aminotransferase, less drug study, 90 days
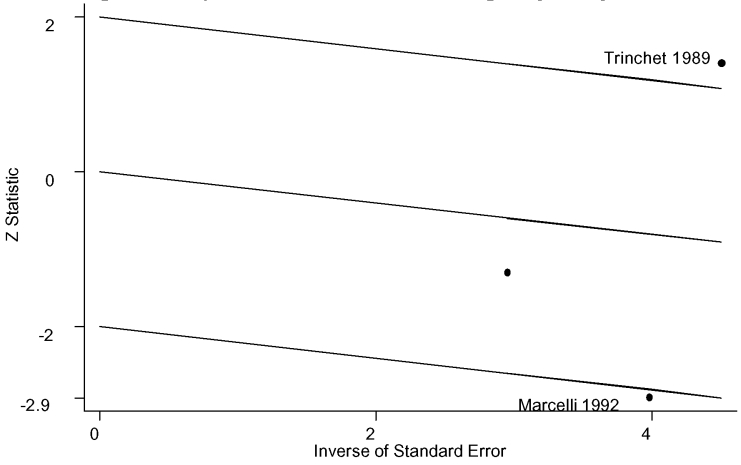
Figure 1-6a. Aspartate aminotransferase, less drug study, 90 days
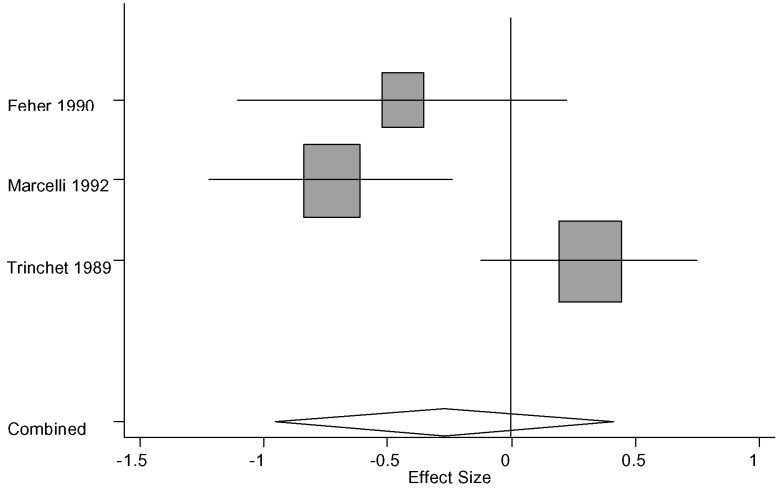
Figure 1-6b. Aspartate aminotransferase, less drug study, less outlier, 90 days
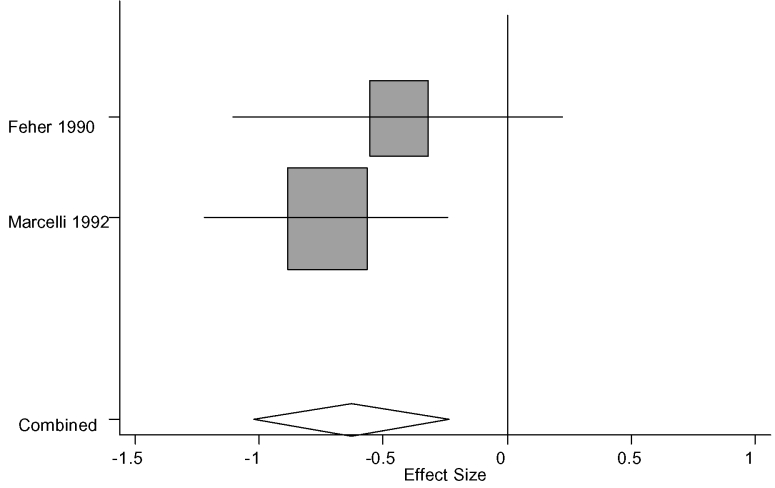
Figure 1-7. Aspartate aminotransferase, <45 days Begg's funnel plot with pseudo 95% confidence limits
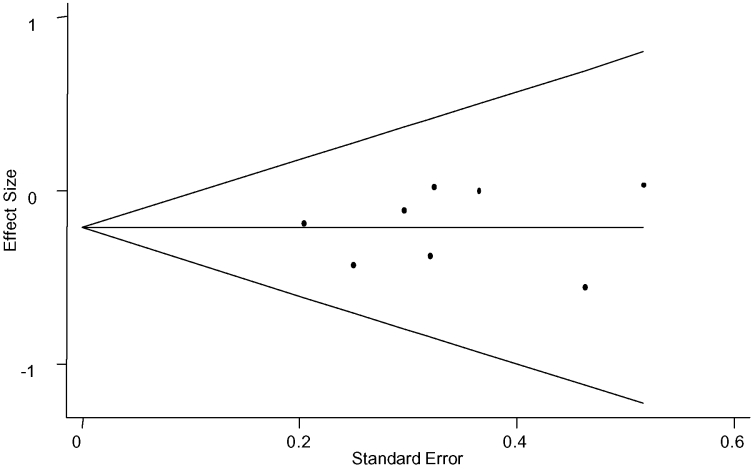
Figure 1-8. Aspartate aminotransferase, <45 days
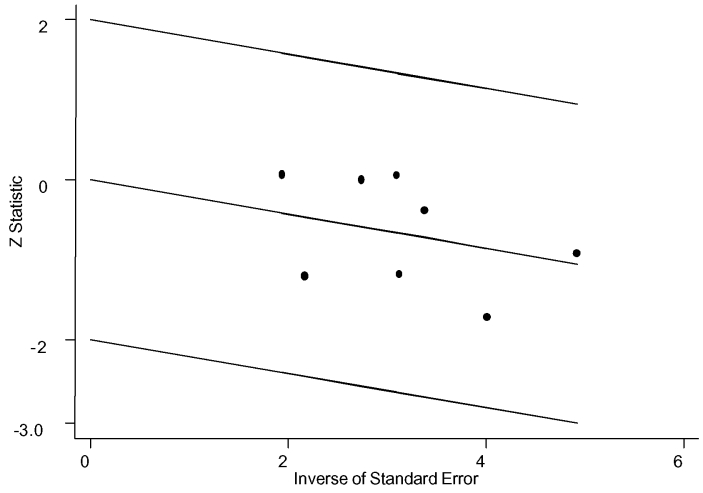
Figure 1-9. Aspartate aminotransferase, <45 days
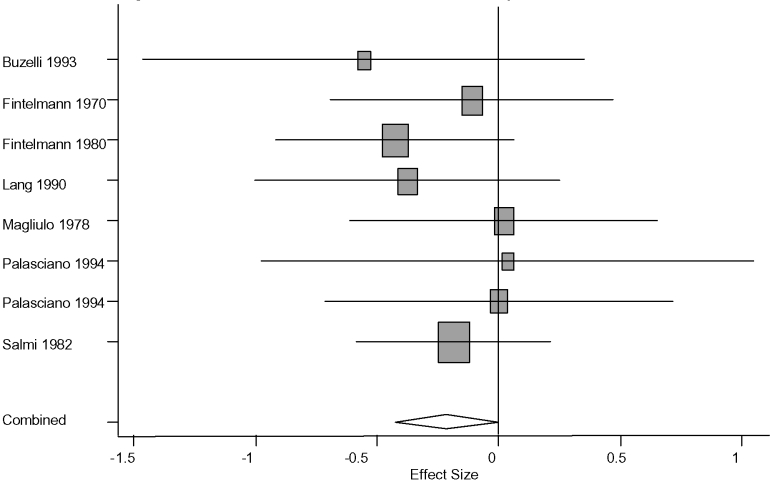
Figure 1-10. Aspartate aminotransferase, 90 days Begg's funnel plot with pseudo 95% confidence limits
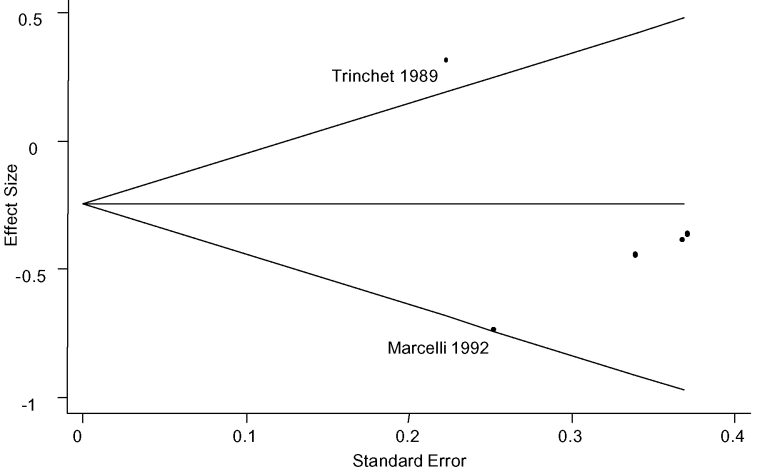
Figure 1-11. Aspartate aminotransferase, 90 days
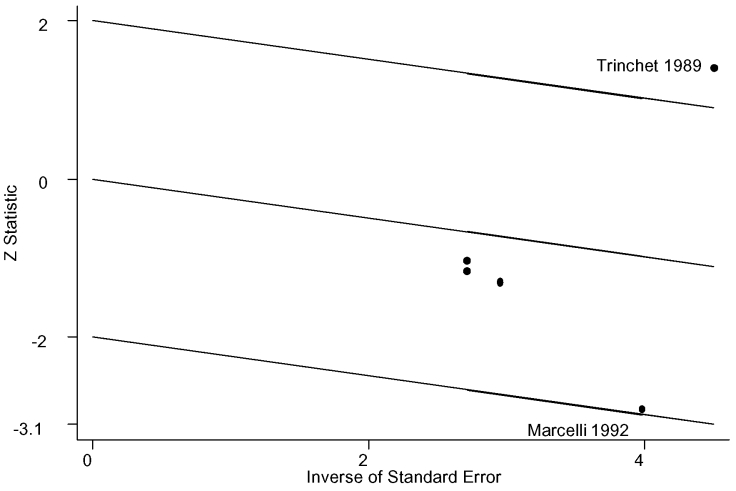
Figure 1-12a. Aspartate aminotransferase, 90 days

Figure 1-12b. Aspartate aminotransferase, less outlier, 90 days
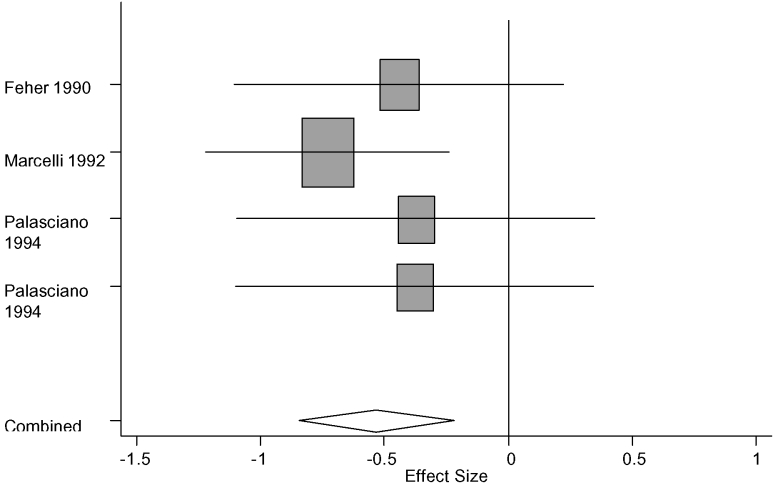
Figure 1-13. Alanine aminotransferase, less drug study, <45 days Begg's funnel plot with pseudo 95% confidence limits
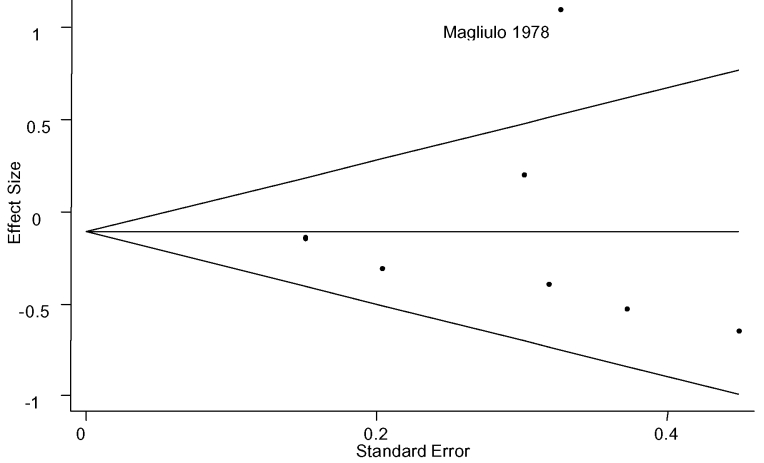
Figure 1-14. Alanine aminotransferase, less drug study, <45 days
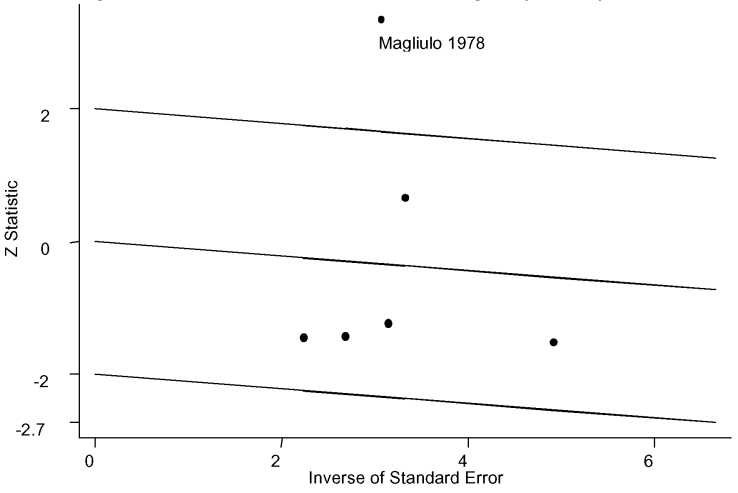
Figure 1-15a. Alanine aminotransferase, less drug study, <45 days
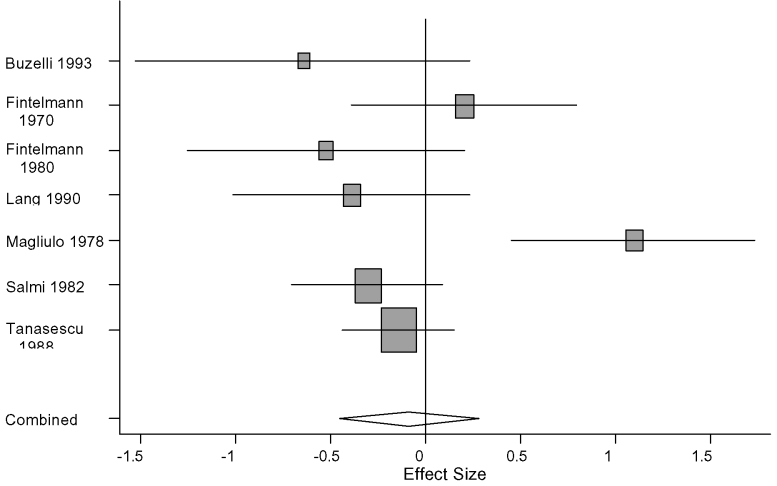
Figure 1-15b. Alanine aminotransferase, less drug study, less outlier, <45 days
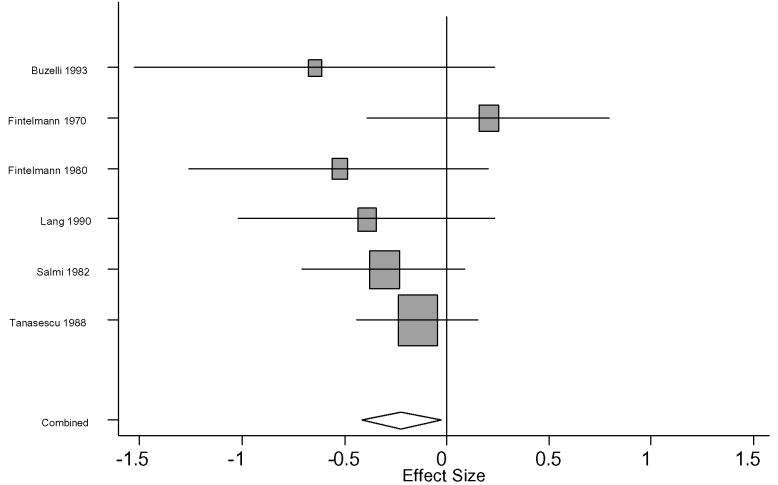
Figure 1-16. Alanine aminotransferase, less drug study, 90 days Begg's funnel plot with pseudo 95% confidence limits
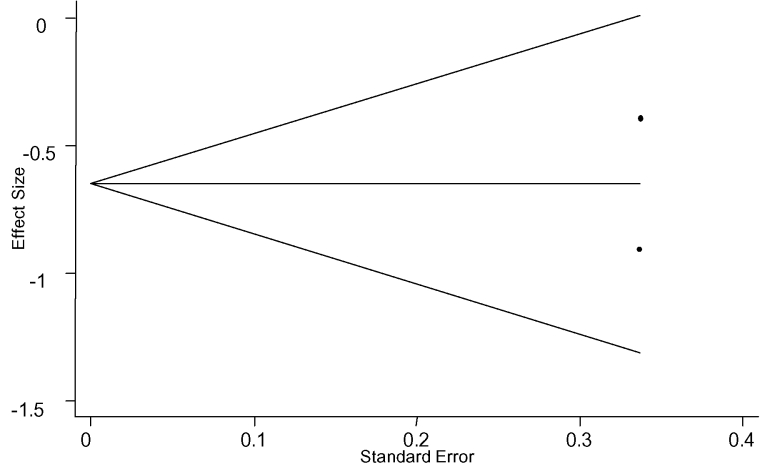
Figure 1-17. Alanine aminotransferase, less drug study, 90 days
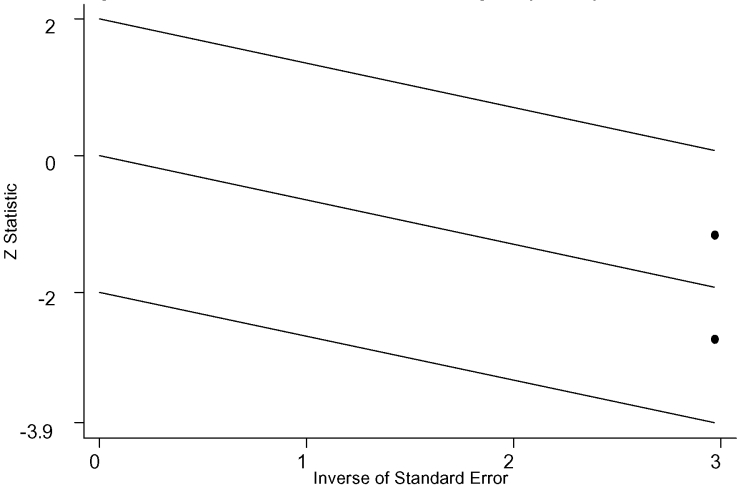
Figure 1-18. Alanine aminotransferase, less drug study, 90 days
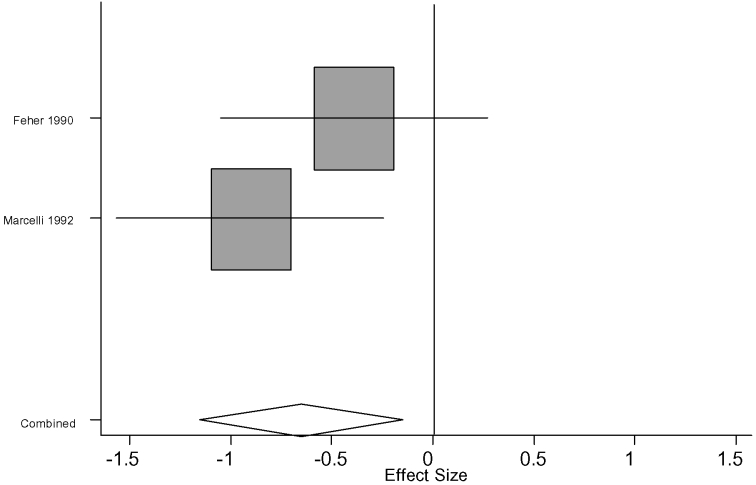
Figure 1-19. Alanine aminotransferase, <45 days Begg's funnel plot with pseudo 95% confidence limits
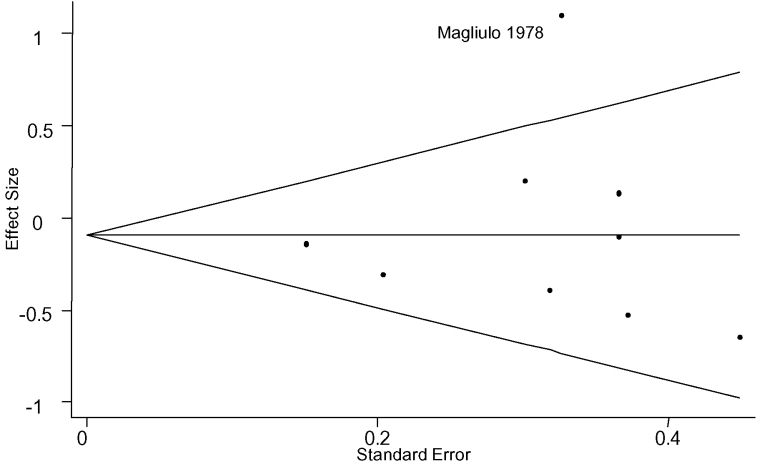
Figure 1-20. Alanine aminotransferase, <45 days
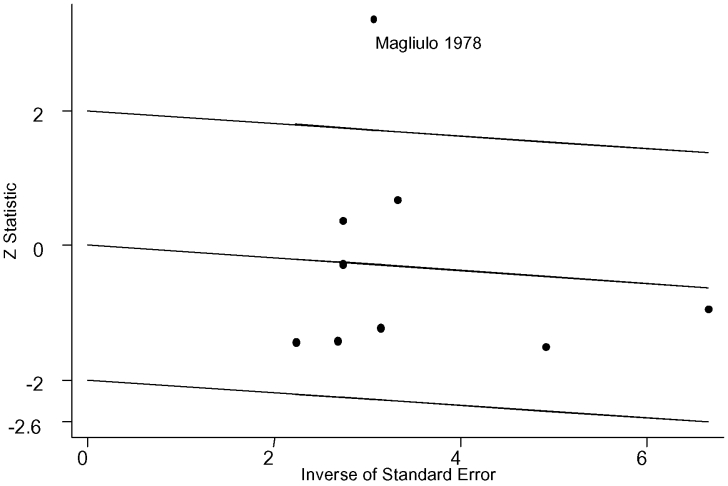
Figure 1-21a. Alanine aminotransferase, <45 days

Figure 1-21b. Alanine aminotransferase, less outlier, <45 days
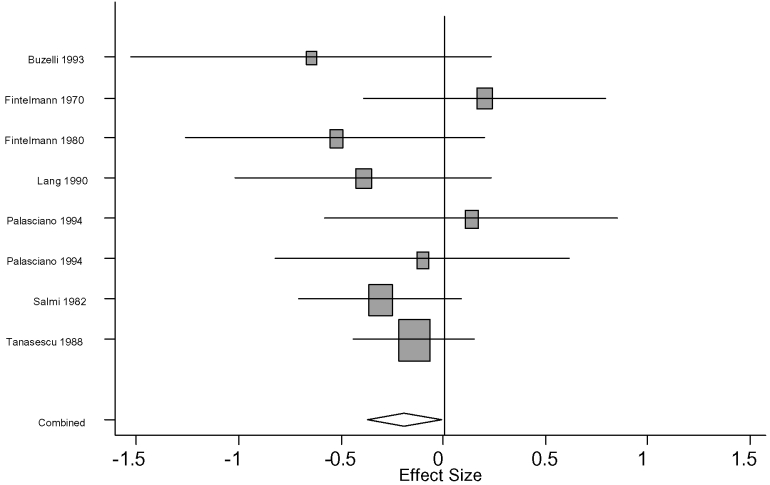
Figure 1-22. Alanine aminotransferase, 90 days Begg's funnel plot with pseudo 95% confidence limits
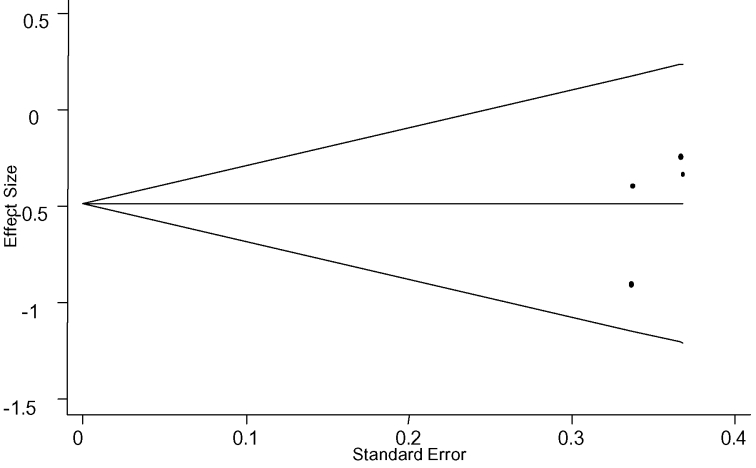
Figure 1-23. Alanine aminotransferase, 90 days
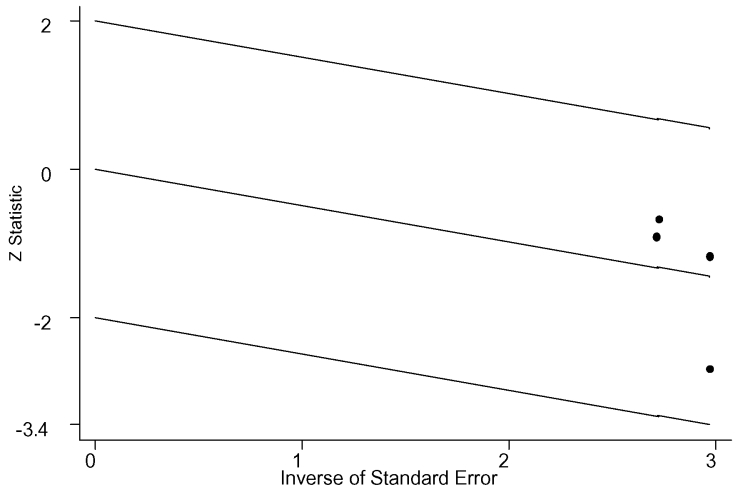
Figure 1-24. Alanine aminotransferase, 90 days
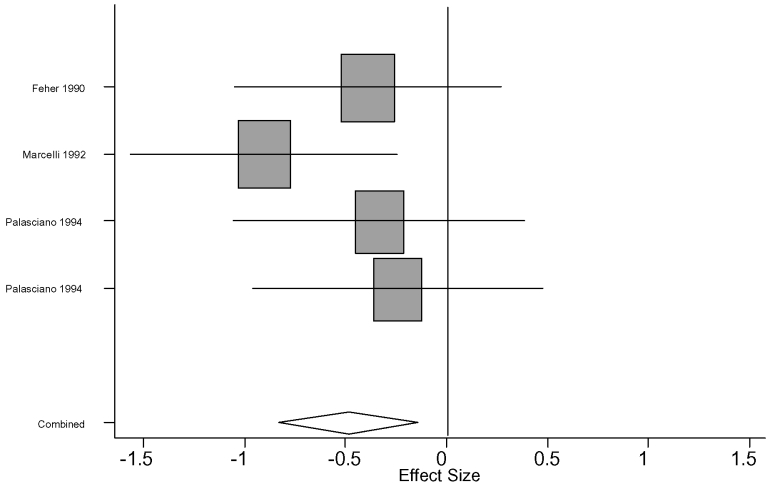
Figure 1-25. Gammaglutamyl transpeptidase, <45 days Begg's funnel plot with pseudo 95% confidence limits
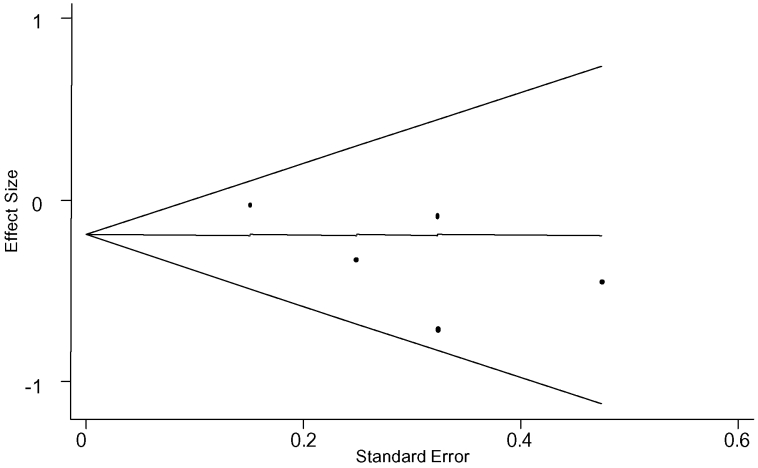
Figure 1-26. Gammaglutamyl transpeptidase, <45 days
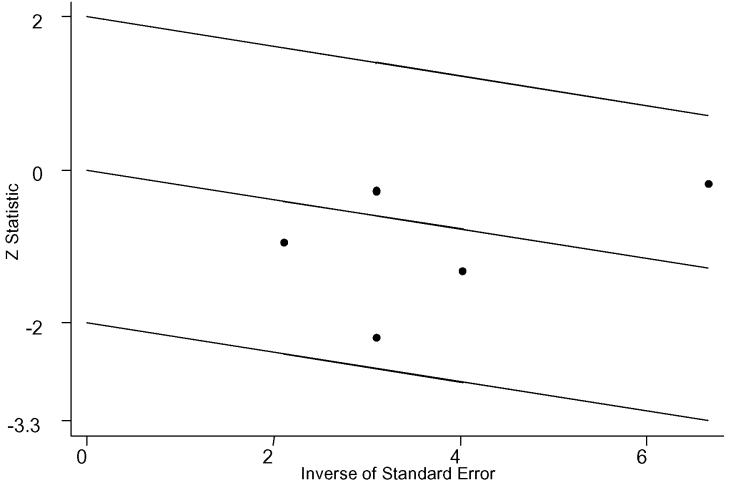
Figure 1-27. Gammaglutamyl transpeptidase, <45 days
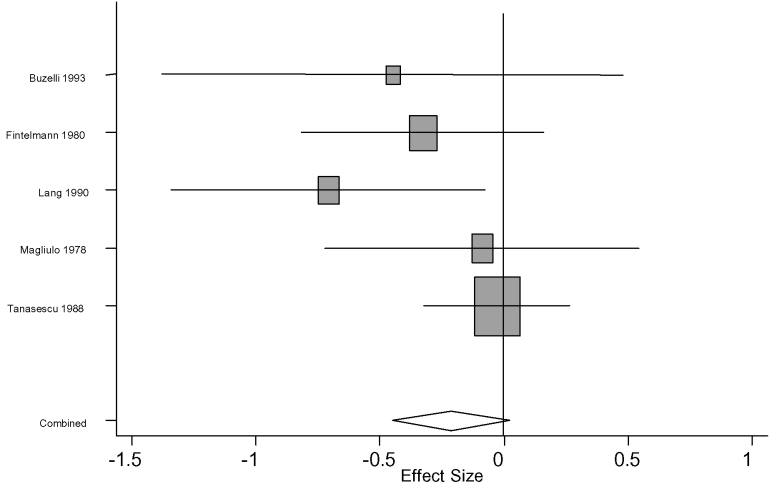
Figure 1-28. Gammaglutamyl transpeptidase, 90 days Begg's funnel plot with pseudo 95% confidence limits
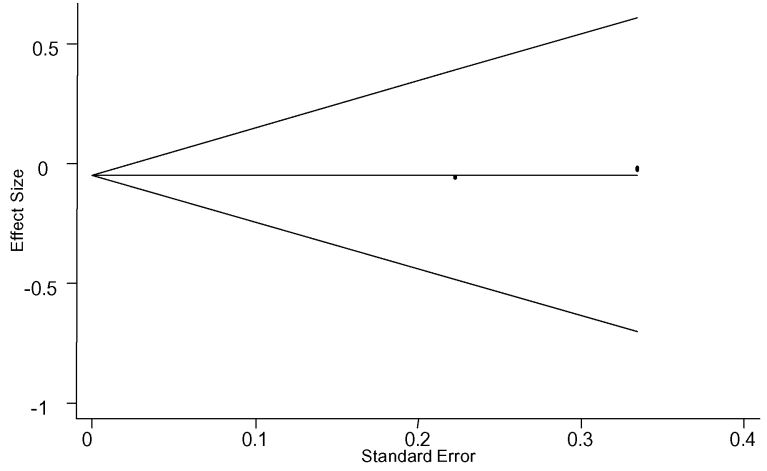
Figure 1-29. Gammaglutamyl transpeptidase, 90 days
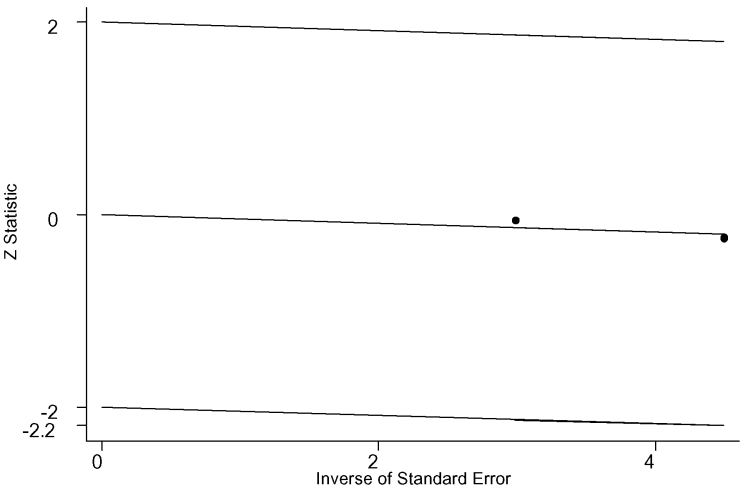
Figure 1-30. Gammaglutamyl transpeptidase, 90 days
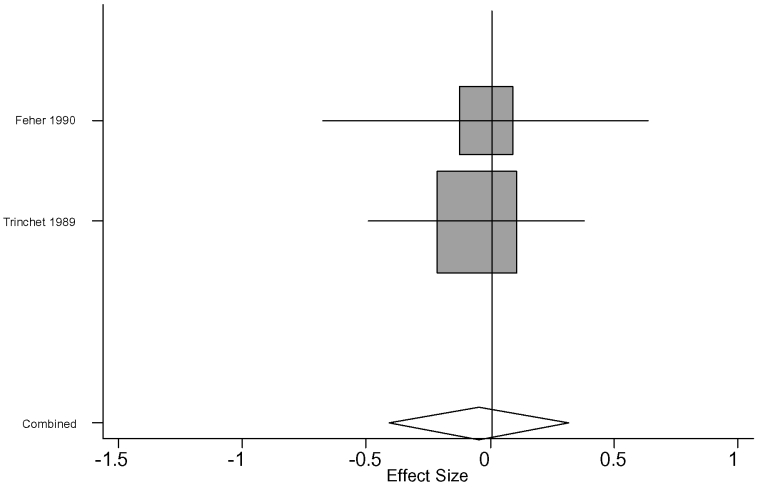
Figure 1-31. Alkaline phosphatase, <45 days Begg's funnel plot with pseudo 95% confidence limits
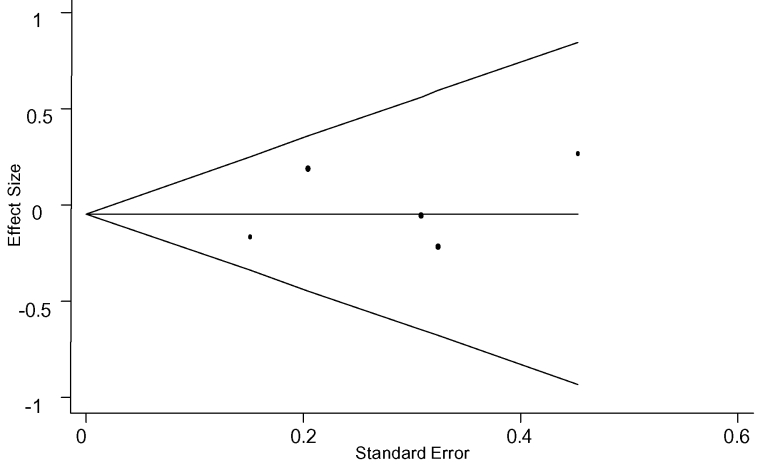
Figure 1-32. Alkaline phosphatase, <45 days
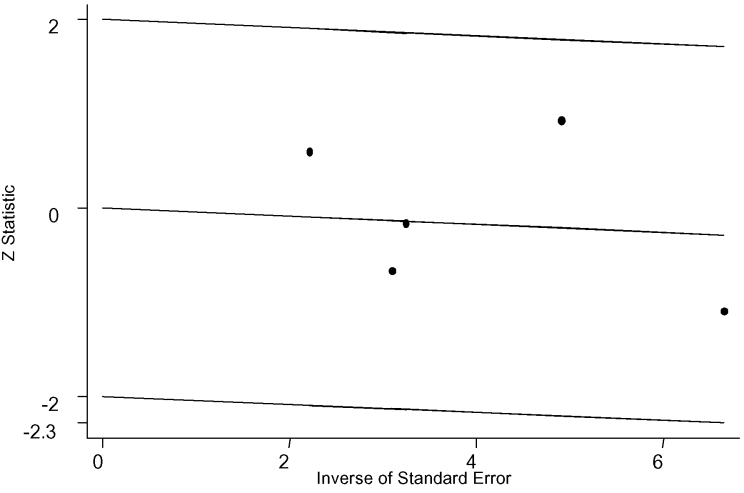
Figure 1-33. Alkaline phosphatase, <45 days
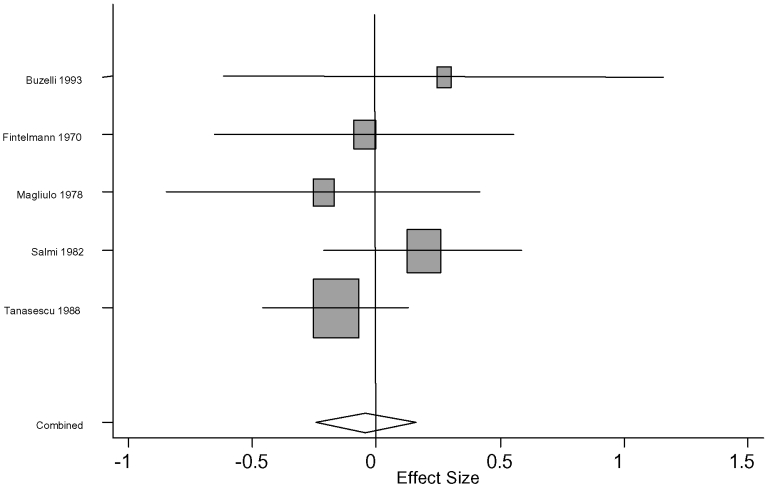
Figure 1-34. Bilirubin, <45 days Begg's funnel plot with pseudo 95% confidence limits
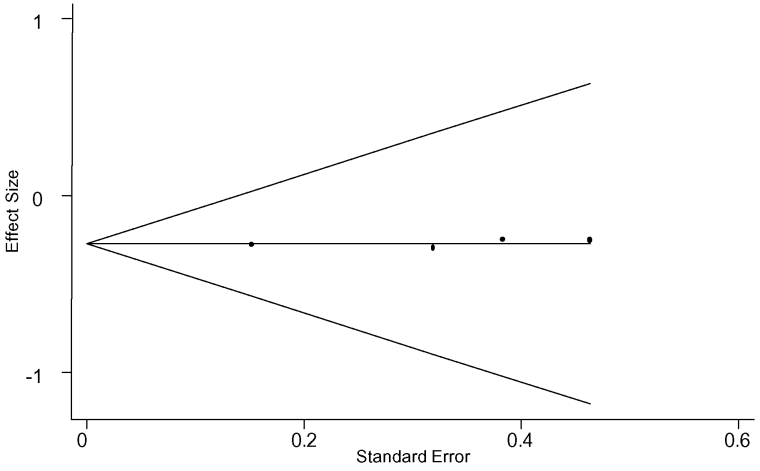
Figure 1-35. Bilirubin, <45 days
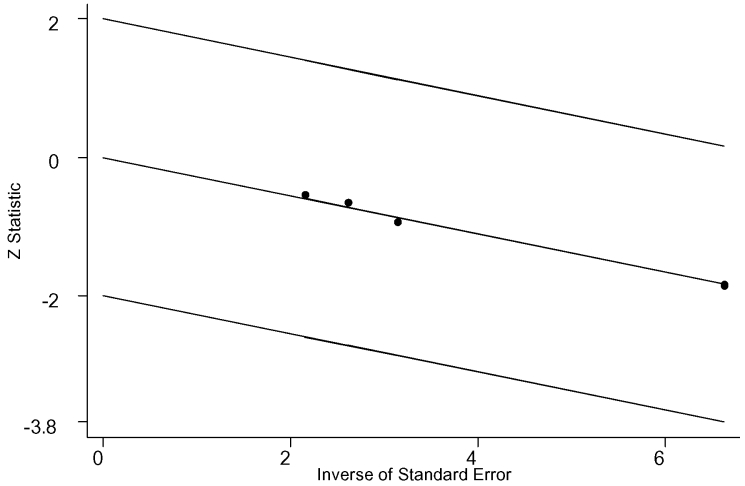
Figure 1-36. Bilirubin, <45 days
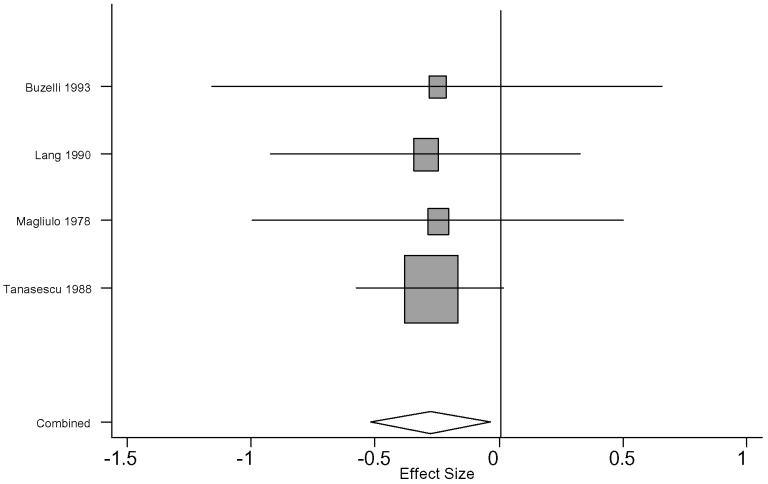
Figure 1-37. Bilirubin, 90 days Begg's funnel plot with pseudo 95% confidence limits
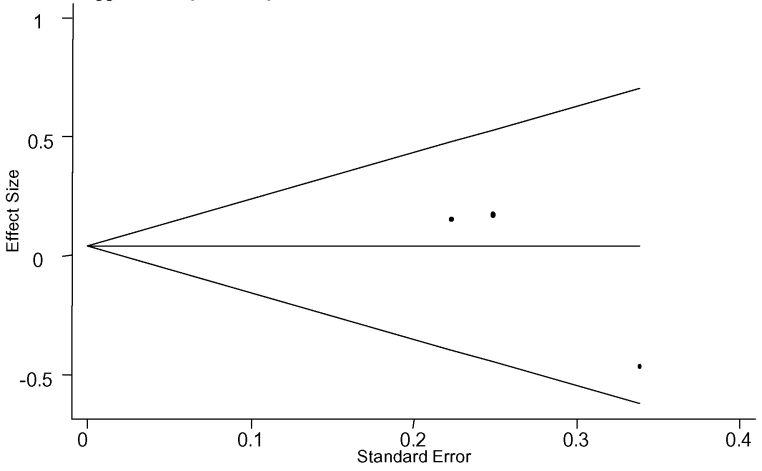
Figure 1-38. Bilirubin, 90 days
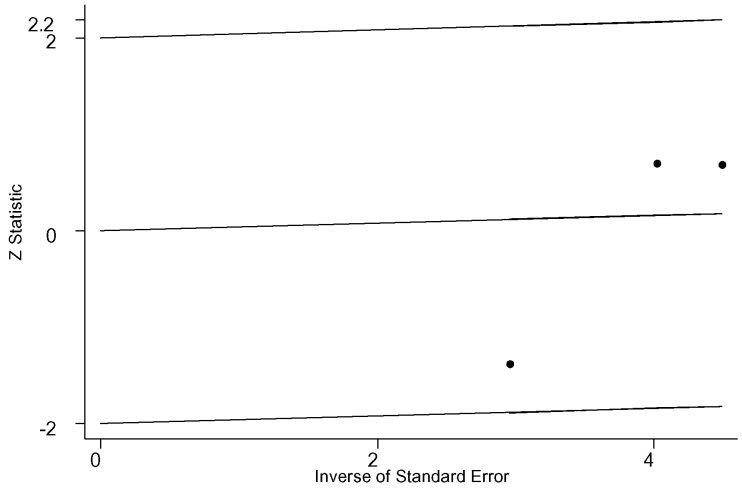
Figure 1-39. Bilirubin, 90 days
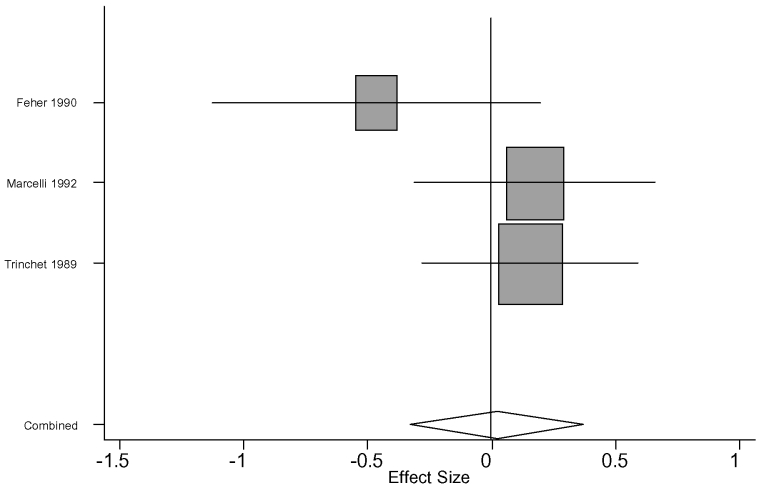
Figure 1-40. Albumin, 90 days Begg's funnel plot with pseudo 95% confidence limits
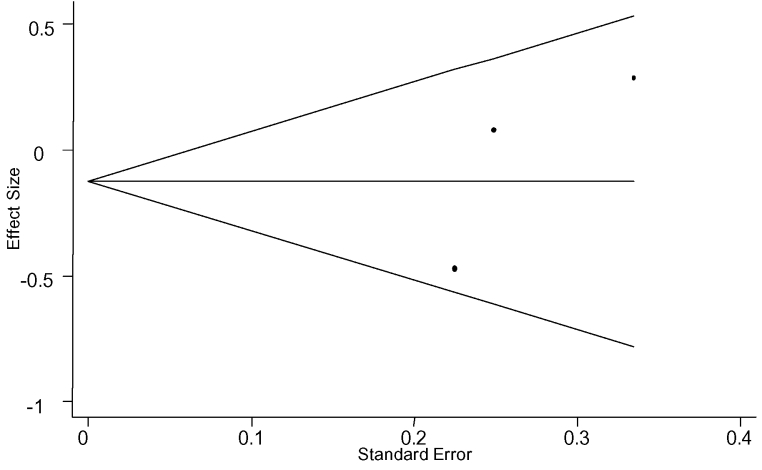
Figure 1-41. Albumin, 90 days
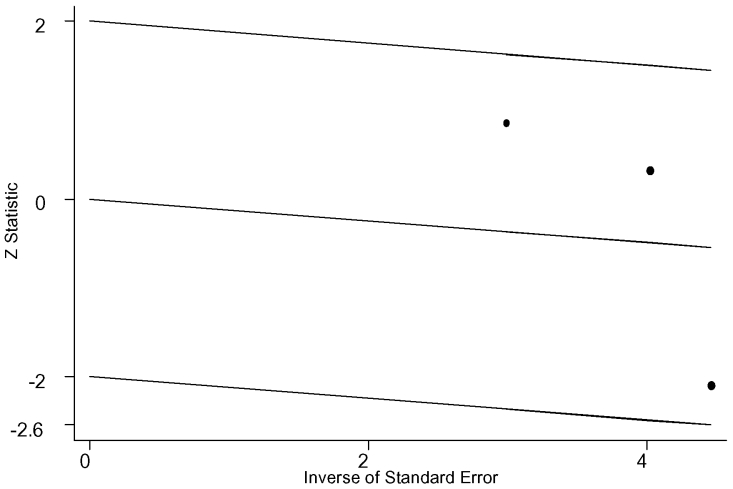
Figure 1-42. Albumin, 90 days
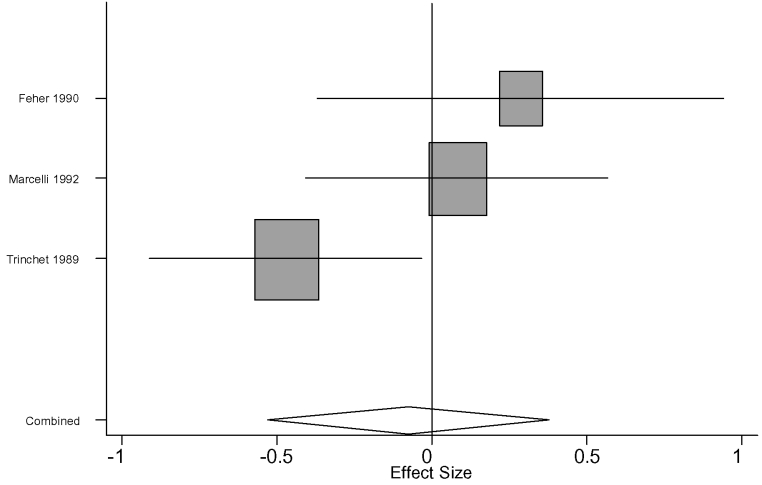
Figure 1-43. Prothrombin time, 90 days Begg's funnel plot with pseudo 95% confidence limits

Figure 1-44. Prothrombin time, 90 days
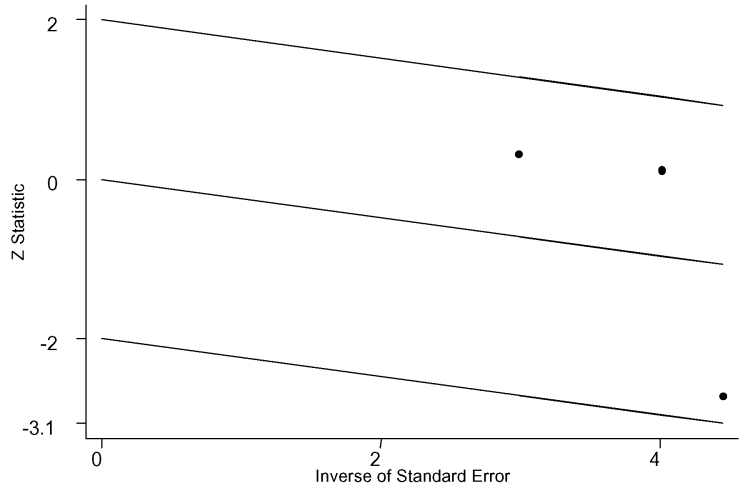
Figure 1-45. Prothrombin time, 90 days
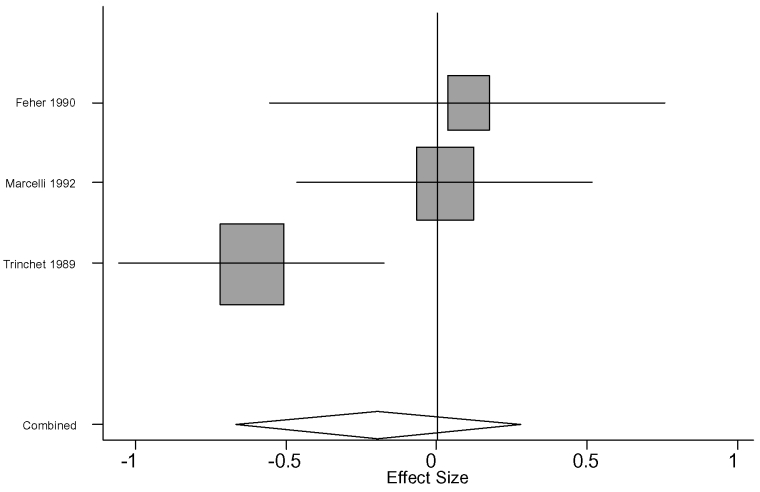
- Figure 1-1. Aspartate aminotransferase, less drug study, <45 days Begg's funnel plot with pseudo 95% confidence limits
- Figure 1-2. Aspartate aminotransferase, less drug study, <45 days
- Figure 1-3. Aspartate aminotransferase, less drug study, <45 days
- Figure 1-4. Aspartate aminotransferase, less drug study, 90 days Begg's funnel plot with pseudo 95% confidence limits
- Figure 1-5. Aspartate aminotransferase, less drug study, 90 days
- Figure 1-6a. Aspartate aminotransferase, less drug study, 90 days
- Figure 1-6b. Aspartate aminotransferase, less drug study, less outlier, 90 days
- Figure 1-7. Aspartate aminotransferase, <45 days Begg's funnel plot with pseudo 95% confidence limits
- Figure 1-8. Aspartate aminotransferase, <45 days
- Figure 1-9. Aspartate aminotransferase, <45 days
- Figure 1-10. Aspartate aminotransferase, 90 days Begg's funnel plot with pseudo 95% confidence limits
- Figure 1-11. Aspartate aminotransferase, 90 days
- Figure 1-12a. Aspartate aminotransferase, 90 days
- Figure 1-12b. Aspartate aminotransferase, less outlier, 90 days
- Figure 1-13. Alanine aminotransferase, less drug study, <45 days Begg's funnel plot with pseudo 95% confidence limits
- Figure 1-14. Alanine aminotransferase, less drug study, <45 days
- Figure 1-15a. Alanine aminotransferase, less drug study, <45 days
- Figure 1-15b. Alanine aminotransferase, less drug study, less outlier, <45 days
- Figure 1-16. Alanine aminotransferase, less drug study, 90 days Begg's funnel plot with pseudo 95% confidence limits
- Figure 1-17. Alanine aminotransferase, less drug study, 90 days
- Figure 1-18. Alanine aminotransferase, less drug study, 90 days
- Figure 1-19. Alanine aminotransferase, <45 days Begg's funnel plot with pseudo 95% confidence limits
- Figure 1-20. Alanine aminotransferase, <45 days
- Figure 1-21a. Alanine aminotransferase, <45 days
- Figure 1-21b. Alanine aminotransferase, less outlier, <45 days
- Figure 1-22. Alanine aminotransferase, 90 days Begg's funnel plot with pseudo 95% confidence limits
- Figure 1-23. Alanine aminotransferase, 90 days
- Figure 1-24. Alanine aminotransferase, 90 days
- Figure 1-25. Gammaglutamyl transpeptidase, <45 days Begg's funnel plot with pseudo 95% confidence limits
- Figure 1-26. Gammaglutamyl transpeptidase, <45 days
- Figure 1-27. Gammaglutamyl transpeptidase, <45 days
- Figure 1-28. Gammaglutamyl transpeptidase, 90 days Begg's funnel plot with pseudo 95% confidence limits
- Figure 1-29. Gammaglutamyl transpeptidase, 90 days
- Figure 1-30. Gammaglutamyl transpeptidase, 90 days
- Figure 1-31. Alkaline phosphatase, <45 days Begg's funnel plot with pseudo 95% confidence limits
- Figure 1-32. Alkaline phosphatase, <45 days
- Figure 1-33. Alkaline phosphatase, <45 days
- Figure 1-34. Bilirubin, <45 days Begg's funnel plot with pseudo 95% confidence limits
- Figure 1-35. Bilirubin, <45 days
- Figure 1-36. Bilirubin, <45 days
- Figure 1-37. Bilirubin, 90 days Begg's funnel plot with pseudo 95% confidence limits
- Figure 1-38. Bilirubin, 90 days
- Figure 1-39. Bilirubin, 90 days
- Figure 1-40. Albumin, 90 days Begg's funnel plot with pseudo 95% confidence limits
- Figure 1-41. Albumin, 90 days
- Figure 1-42. Albumin, 90 days
- Figure 1-43. Prothrombin time, 90 days Begg's funnel plot with pseudo 95% confidence limits
- Figure 1-44. Prothrombin time, 90 days
- Figure 1-45. Prothrombin time, 90 days
- Appendix B. Graphic Summaries - Milk Thistle: Effects on Liver Disease and Cirrh...Appendix B. Graphic Summaries - Milk Thistle: Effects on Liver Disease and Cirrhosis and Clinical Adverse Effects
- Summary - Milk Thistle: Effects on Liver Disease and Cirrhosis and Clinical Adve...Summary - Milk Thistle: Effects on Liver Disease and Cirrhosis and Clinical Adverse Effects
Your browsing activity is empty.
Activity recording is turned off.
See more...