NCBI Bookshelf. A service of the National Library of Medicine, National Institutes of Health.
Shojania KG, Burton EC, McDonald KM, et al. The Autopsy as an Outcome and Performance Measure. Rockville (MD): Agency for Healthcare Research and Quality (US); 2002 Oct. (Evidence Reports/Technology Assessments, No. 58.)
This publication is provided for historical reference only and the information may be out of date.
Appendix Table 1 - Studies reporting rates of persistent diagnostic uncertainty after autopsy
| Institution | Autopsy Rate | Case Mix (Number of Autopsies) | Persistent Uncertainty After Autopsy (95% CI) |
|---|---|---|---|
| Paddington General Hospital (UK): 195890 | 53% | General inpatientsa (265) | 21.1% (16.5–26.6%) |
| Woodend General Hospital and Aberdeen City Hospital (Scotland): 1972-74 77 | 37% | General inpatients (1,000) | 5.1%b (3.9–6.7%) |
| Oulu University Hospital (Finland): 1972-74292 | 24%c | Oncology (377) | 1.1% (0.3–2.9%) |
| Holstebro Central Hospital, Denmark: 1974 199 | 85% | General inpatients (266) | 0.4% (02–2.4%) |
| University of Bergen (Norway): 1975293 | 75% | General inpatients (742) | 4.3% (3.0–6.1%) |
| Huddinge University Hospital (Sweden): 1977-78, 1987-88)53, 294 | 76%, 42%d | General inpatients (3,042) | 2.4% (1.9–3.1%) |
| Salford Health Authority (UK): 1981295 | 35% | Inpatients age >65 (332) | 3.6% (2.0–6.4%) |
| University of Colorado (Denver, CO): 1981-8391 | 81% | Fetal deaths (64) | 46.2% (32.5–60.4%) |
| University of Colorado (Denver, CO): 1981-8391 | 80% | Neonatal/infant deaths (108) | 23.0% (14.9–33.5%) |
| White River Junction VA Medical Center (White River Junction, VT): 198378 | 60% | General inpatients (111) | 3.6% (1.2–9.5%) |
| Hospital Central de la Cruz Roja (Spain): 1983-85125 | 51% | ICU (100) | 6% (2.5–13.1%) |
| Sumitomo Hospital (Japan): 1983-97296 | 40% | General inpatientsa (1,044) | 0.6% (0.2–1.3%) |
| Leiden University Hospital (Netherlands): 1984 118 | 47% | Medicine patients (133) | 9% (5–16%) |
| Northwestern Memorial Hospital (Chicago): 1985 130 | 36% | General inpatient (151) | 6% (3–11%) |
| Institute Jules Bordet (Belgium): 1985-86 297 | 69% | Adult Oncology ICU (34) | 17.6% (7.4–35.2%) |
| Johns Hopkins Hospital (Baltimore, MD): 1985-9594 | 24% | Adult cardiac surgery (147) | 25.2% (18.6–33.1%) |
| Women and Infants Hospital (Providence, RI): 1991-9293 | 83% | Fetal deaths (77) | 37.7% (27.1–49.5%) |
| Women and Infants Hospital (Providence, RI): 1991-9293 | 74% | Neonatal deathse (47) | 2.1% (0.1–12.7%) |
| Lund University Hospital (Sweden): 1991-9292 | 50% | Fetal deathsf (54) | 42.6% (29.5–56.7%) |
| Lund University Hospital (Sweden): 1991-9292 | 50% | Neonatal and infant deaths (31) | 3.2% (0.2–18.5%) |
| Lund University Hospital (Sweden): 1991-9292 | 90% | Medical abortions (19) | 0% (0–20.9%) |
| 248 Departments of Pathology (USA): 1993 298 | ----1 | General inpatients (2,479) | 5.2%2 (4.1–6.6%) |
| Prince of Wales Hospital (Hong Kong): 1997211 | 18% | General inpatients and forensic cases (332) | 1.8% (0.7–4.1%) |
- a
Presumed from description of study and results, but not explicitly stated.
- b
The authors reported that “the solution of a clinical problem proved impossible despite an adequately performed and reported autopsy” in 71 cases. The rate listed in the table derives from these cases, but excluding the 20 cases in which this failure to solve the clinical problem involved failure to perform biochemical or hematological tests.
- c
This rate reflects cancer patients only, which was focus of study.
- d
The rate of indeterminate autopsies was reported for the study overall and not separated by time periods.
- e
Defined by authors as deaths within 48 hrs of birth.
- f
Included 40 spontaneous abortions and 14 intra-uterine deaths.
- 1
Rate not calculable given study design in which each of 248 institutions contributed a small, consecutive sample of its autopsies.
- 2
This study reported the number of clinical questions answered by the autopsy, with each of the 2,479 cases having a mean of 2.6 associated questions. The listed figure for “persisted uncertainty” after autopsy reflects the percentage of the cases in which the autopsy did not establish the cause of death (The answer to this question was provided by respondents for 1,330 of the total of 2,479 autopsies.)
Appendix Table 2 - Studies Reporting "Class I"; or "Class I Equivalent" Error Rates (These error rates and 95% confidence intervals are displayed graphically in Appendix Figure 5.)
| Institution | Autopsy Rate | Case Mix (Number of Autopsies) | Error Rate (95% CI) |
|---|---|---|---|
| Peter Bent Brigham Hospital (Boston): 1960 51 | 75% | Adult inpatients (100) | 8% (4–16%) |
| Christian- Albrechts University Hospital (Germany): 1959 54 | 88% | General inpatients (100) | 7% (3–14%) |
| Christian- Albrechts University Hospital (Germany): 196954 | 82% | General inpatients (100) | 12% (7–20%) |
| Peter Bent Brigham Hospital (Boston): 1970 51 | 71% | Adult inpatients (100) | 12% (7–20%) |
| Zurich University Hospital (Switzerland): 197255 | 94% | Adult medical (100) | 16% (10–25%) |
| Winnipeg Health Sciences Center (Canada): 1978-79299 | 26%3 | Adult inpatients (200) | 1.5% (0.4–4.7%) |
| Royal Adelaide Hospital (Australia): 1979300 | 45% | Adult inpatients (99) | 2.0% (0.4–7.8%) |
| Christian- Albrechts University Hospital (Germany): 197954 | 58% | General inpatients (100) | 12% (7–20%) |
| Peter Bent Brigham Hospital (Boston): 198051 | 38% | Adult inpatients (100) | 11% (6–19%) |
| 39 Connecticut institutions performing autopsies: 198014 | 14% | General (272) | 4.0% (2.1–7.3%) |
| Belgrade University School of Medicine (Yugoslavia): 1981-84301 | 12% | General inpatients (2,145) | 29% (26.9–30.8%) |
| Zurich University Hospital (Switzerland): 198255 | 89% | Adult medical (100) | 9% (4–17%) |
| 32 US hospitals (21 university and 11 community non-teaching): 1984 70 | 30% | General inpatients (2,067)4 | 13% (12–15%) |
| Brigham & Women's Hospital (Boston, MA): 1984-85 129 | 37% | Adult inpatients (175) | 11% (7–17%) |
| Emerson Hospital (Concord, MA): 1984-85 129 | 26% | General inpatients (58) | 12% (5–24%) |
| Medical Center of Delaware: 1988-91 210 | 17% | General inpatients (145) | 3% (1–8%) |
| St. Vincent's Hospital (Australia): 1988160 | 22% | General inpatients (139) | 6% (3–11%) |
| Christian- Albrechts University Hospital (Germany): 198954 | 36% | General inpatients (100) | 11% (6–19%) |
| Zurich University Hospital (Switzerland): 199255 | 89% | Adult medical (100) | 7% (3–14%) |
| Ben Taub General Hospital (Houston, TX): 1992-3 116 | 16% | Auult medical5 (110) | 10.9% (6.3–16.8%) |
| San Francisco General Hospital and 31 hospital in Orange County, CA: 1974-756, 302 | 100% | Adults and pediatric moror vehicle accident fatalities (182) | 12.6% (8.3–18.6%) |
| Mason F. Lord Nursing Home (Baltimore, MD):1981-88303 | 3.5%7 | Nursing home residents (34) | 32.4% (18–50.6%) |
| Hospital Central de la Cruz Roja (Spain): 1983-85125 | 51% | Adult ICU (100) | 7% (3.1–14.4%) |
| Six Department of Veterans Affairs Hospitals: 1986-87131 | 43% | Adult medical ICU (172) | 12% (8–18%) |
| Hartford Hospital (New Haven, CT): 1986-92304 | 29% | Adult surgical ICU patients (149) | 11% (6.5–17.1%) |
| Gloucestershire Royal Hospital (U.K.): 1996-993 | 40% | Adult ICU patients (97) | 4.1% (1.3–10.8%) |
| University of Massachusetts Medical Center (Worcester, MA): 1984-88120 | 32% | Adult ED patients8 (244) | 1.6% (0.5–4.4%) |
| University of Texas Medical Branch (Galveston, TX): 1984-88305 | 73% | Adult and pediatric surgical patients (409) | 7.8% (5.5–11%) |
| Royal Victoria Hospital (Northern Ireland): 1986-88306 | 23% | Adult and pediatric perioperative deaths (213) | 20.7% (15.6–26.8%) |
| Ben Taub General Hospital (Houston, TX): 1992-3 116 | 16%9 | Patients with AIDS (42) | 9.5% (3.1–23.6%) |
| Lutheran General Children's Hospital (Park Ridge, Ill): 1984-93128 | 36% | Pediatric inpatients (107)10 | 6.5% (2.9–13.5%) |
| Children's Hospital of Western Ontario (Canada): 1985-89307 | 75% | Pediatric deaths in the ED (52) | 0%11 (0–8.6%) |
| Toronto Hospital for Sick Children (Canada): 1985-90124 | 62% | Neonatal ICU (338) | 2.1% (0.9–4.4%) |
| North Shore University Hospital (Manhasset, NY): 1985-92132 | 26% | Pediatric ICU (50) | 10% (3.7–22.6%) |
| Royal Alexandra Hospital for Children (Australia): 1991-97308 | 40% | Neonatal ICU (91) | 5.5 % (2.0–12.9 %) |
| General Hospital Celje (Slovenia): 1998-99320 | 47% | Medical ICU (126) | 9.5% (5.2–16.4%) |
| Ryder Trauma Center (Miami): 1997-98321 | 97% | Adult & pediatric trauma/burn patients dying in ICU (153) | 2.6% (0.8–7.0%) |
| King Edward Memorial Hospital (India): 1995-96319 | 82% | Neonatal ICU (197) | 12.2% (8.1–17.8%) |
- 3
Rate reflects “teaching cases” only, with medicolegal cases excluded; overall autopsy rate for this period including medicolegal/forensic cases was 44%.
- 4
Not clear how many pediatric patients included as study states only that 2,067 autopsies reviewed included 360 cases under 20 years of age.
- 5
Patients with Acquired Immunodeficiency Syndrome (AIDS) were reported separately; these data are presented in the line below this entry.
- 6
The authors of this study were focused primarily on demonstrating the difference in quality of care between a region with a Level 1 trauma center (San Francisco County) and a region (Orange County) where trauma patients are sent to nearest available facility. Chart reviews were conducted by the authors and were not blinded to patient location. Because of the significant potential for bias introduced by non-blinded peer review, the results for the two regions were combined rather than presenting separate Class I error rates for the two regions.
- 7
This value represents an average over the study period, with yearly rates ranging from 1.6–10.8%. In fact, all but the last year had rates under 3%, with the increase in the final year attributed to targeted efforts to increase autopsies.
- 8
Study focused on patients who died in the Emergency Department (ED) or within 7 days of hospitalization after admission through the ED; forensic cases were included.
- 9
Listed autopsy rate is for all medical patients; specific autopsy rate for AIDS patients not stated.
- 10
Deaths in neonatal ICU were excluded.
- 11
As noted by the authors of this study, the lack of Class I errors likely reflects the high proportion of deaths due to cardiac arrest in the ED, making changes in outcome unlikely even in the presence of major unrecognized diagnoses.
As explained in the text, inclusion as a “Class I” error rate required that the study explicitly reference the classification scheme of Goldman et al51 or the modification of this scheme by Battle et al.70 “Class I equivalents” included missed diagnoses that “would,” “could,” possibly” or “might” have affected patient “prognosis” or “outcome” had they been detected during life. (At a minimum, such impact involved discharge from the hospital alive). Errors for which expected impacts on patient outcomes were explicitly identified as being restricted symptom palliation were excluded from this category and included with major errors (Appendix Table 3)
Studies with fewer than 50 cases were included only if they involved a specific patient population (e.g., perinatal autopsies, ICU patients, oncology, etc.). Such studies are listed in the table below
Appendix Table 3 - Autopsy Studies Reporting Major Error Rates
| Institution | Autopsy Rate | Case Mix (Number of Autopsies) | Error Rate (95% CI) |
|---|---|---|---|
| Peter Bent Brigham Hospital (Boston): 1960 51 | 75% | Adult inpatients (100) | 22% (15–32%) |
| Peter Bent Brigham Hospital (Boston): 1970 51 | 71% | Adult inpatients (100) | 23% (15–33%) |
| Zurich University Hospital (Switzerland): 197255 | 94% | Adult medical (100) | 30% (21.4–40.1%) |
| South Lothian District hospitals (Scotland): 1975-7 155, 156 | 25% | General inpatients (1,152) | 38% (36–41%) |
| University of Edinburgh teaching hospital (Scotland): 1978 123 | 64% | General inpatients (154) | 15% (10–22%) |
| Peter Bent Brigham Hospital (Boston): 198051 | 38% | Adult inpatients (100) | 21% (14–30%) |
| Zurich University Hospital (Switzerland): 198255 | 89% | Adult medical (100) | 18% (11.3–27.2%) |
| White River Junction VA Medical Center (White River Junction, VT): 198378 | 60% | General inpatients (111) | 12.6% (7.3–20.6%) |
| Chandigarh Postgraduate Institute of Medical Education and Research (India): 1983-88309 | 23–27%12 | Adult inpatients13 (1,000) | 31.7% (28.8–34.7%) |
| 32 US hospitals (21 university and 11 community non-teaching): 1984 70 | 30% | General inpatients (2,067) | 34% (32–36%) |
| Brigham & Women's Hospital (Boston): 1984-85 129 | 37% | General inpatients (175) | 23% (17–30%) |
| Northwestern Memorial Hospital (Chicago): 1985 130 | 36% | General inpatients (142) | 23% (17–31%) |
| Medical Center of Delaware: 1988-91 210 | 17% | General inpatients (145) | 12% (7–18%) |
| Peterborough District Health Authority (England): 1990 310 | 13% | General inpatients (63) | 19% (11–31%) |
| Zurich University Hospital (Switzerland): 199255 | 89% | Adult medical (100) | 14% (8.1–22.7%) |
| University of Pittsburgh Medical Center (Pittsburgh): 1994 152 | 19% | General inpatients (172) | 34% (27–42%) |
| Prince of Wales Hospital (Hong Kong): 1997211 | 17.7% | General inpatients and forensic cases (332) | 23.5% (19.1–28.5%) |
| Mason F. Lord Nursing Home (Baltimore, MD):1981-88303 | 3.5%14 | Nursing home residents (34) | 47.1% (30.2–64.6%) |
| Leiden University Hospital (Netherlands): 1984118 | 47% | Adult medical (133) | 41% (33–50%) |
| Ben Taub General Hospital (Houston, TX): 1992-3 116 | 16% | Medical PAtients15 (110) | 23.6% (16.3–32.9%) |
| Ben Taub General Hospital (Houston, TX): 1992-3 116 | 16%16 | Patients with AIDS (42) | 33.3% (20.0–49.6%) |
| Salford Health Authority (UK): 1981295 | 35%17 | Inpatients over 85 yrs old (129) | 31% (23.3–39.8%) |
| Beth Israel Hospital (Boston, MA): 1981-83158 | 27% | Adult inpatient deaths after undergoing CPR18 (130) | 13.8% (8.6–21.3%) |
| University of Massachusetts Medical Center (Worcester, MA): 1984-88120 | 32% | Emergency patients19 (244) | 4.1% (2.1–7.6%) |
| Johns Hopkins Hospital (Baltimore, MD): 1985-9594 | 24% | Adult cardiac surgery (147) | 38.8% (31.0–47.2 %) |
| Royal Victoria Hospital (Northern Ireland): 1986-88306 | 23% | Adult and pediatric perioperative deaths (213) | 49.8% (42.9–56.6%) |
| Hospital Central de la Cruz Roja (Spain): 1983-85125 | 51% | Adult ICU (100) | 22% (14.6–31.6%) |
| Hartford Hospital (New Haven, CT): 1986-92304 | 29% | Adult surgical ICU (149) | 23% (16.5–30.6%) |
| Hershey Medical Center (Pennsylvania, PA): 1994-5 117 | 31% | Adult ICU (41) | 27% (15–43%) |
| Cleveland Clinic (Cleveland, OH): 1994-952 | 23% | Medical ICU (91) | 19.8% (12.4–29.7%) |
| Gloucestershire Royal Hospital (U.K.): 1996-993 | 40% | ICU patients (97) | 23.7% (15.9–33.6%) |
| University of Rochester Medical Center (Rochester, NY): 1989-94126 | 74% | Pediatric inpatients including forensic cases (157) | 6.4% (3.3–11.7%) |
| Children's Hospital of New Jersey (Newark, NJ): 1992133 | 29% | General Pediatrics20 (23) | 13.0% (3.4–34.7%) |
| University of Texas Medical Branch (Galveston, TX): 1984-88305 | 73% | Adult and pediatric surgical patients (409) | 30.3% (26–35.1%) |
| Lutheran General Children's Hospital (Park Ridge, Ill): 1984-93128 | 36% | Pediatric inpatients (107)21 | 13.1% (7.6–21.3%) |
| Children's Hospital of Western Ontario (Canada): 1985-89307 | 75% | Pediatric Deaths in the Emergency Department (52) | 15.4% (7.3–28.6%) |
| Hospital for Sick Children (Canada): 1985-90124 | 62% | Neonatal ICU (338) | 18.9% (15.0–23.6%) |
| North Shore University Hospital (Manhasset, NY): 1985-92132 | 26% | Pediatric ICU (50) | 28.0% (16.7–42.7%) |
| Ryder Trauma Center (Miami): 1997-98321 | 97% | Adult & pediatric trauma/burn patients dying in ICU (153) | 15.7% (10.5–22.6%) |
| King Edward Memorial Hospital (India): 1995-96319 | 82% | Neonatal ICU (197) | 26.9% (21.0–33.8%) |
- 12
Stated range for annual autopsy rates during study period; overall autopsy rate not stated.
- 13
Aged 15 years and older.
- 14
This value represents an average over the study period, with yearly rates ranging from 1.6–10.8%. In fact, all but the last year had rates under 3%, with the increase in the final year attributed to targeted efforts to increase autopsies.
- 15
Patients with Acquired Immunodeficiency Syndrome (AIDS) were reported separately; these data are presented in the line below this entry.
- 16
Listed autopsy rate is for all medical patients; specific autopsy rate for AIDS patients not stated.
- 17
The autopsy rate is for patients aged 65 and over; the rate specifically for the group over 85 years is unclear.
- 18
Study autopsies drawn from inpatients who died after undergoing cardiopulmonary resuscitation (CPR); patients experienced cardiac arrest outside the hospital, in the Emergency Department or ambulatory clinics were excluded.
- 19
Study focused on patients who died in the Emergency Department or within 7 days of hospitalization after admission through the Emergency Department; forensic cases were included.
- 20
Deaths in the Emergency Department were excluded.
- 21
Deaths in neonatal ICU were excluded
As explained in the text, “major errors” included missed diagnoses that, while important, likely had no effect on patient outcome. Changes in management could be assessed as possible or even expected, but impacts on outcome for errors in this category were judged to have been “equivocal,” “doubtful,” “unlikely,” or otherwise unexpected. (Errors for which expected impacts on patient outcomes were explicitly restricted to symptom palliation were included in this category.) This category also included the sum of Class I and Class II errors from articles that explicitly reference the classifications of Goldman et al51 or Battle et al.70
Appendix Table 4 - Studies Reporting Autopsy-detected Diagnostic Errors in terms of Discrepant Major ICD Disease Categories
| Institution | Autopsy Rate | Case Mix (Number of Autopsies) | Error Rate (95% CI) |
|---|---|---|---|
| Serafimerlasarettet (Sweden): 1970-1122 | 96% | General inpatients (383) | 7% (5–10%) |
| Holstebro Central Hospital (Denmark): 1974 199 | 85% | General inpatients (266) | 10% (6.9–14.6%) |
| University of Bergen (Norway): 1975293 | 75% | General inpatients (742) | 18.7% (16–21.8%) |
| South Lothian District hospitals (Scotland): 1975-7 155, 156 | 25% | General inpatients (1,152) | 22% (20–24%) |
| Anonymous community teaching hospital (New York State): 1977-7815 | 37% | General inpatients (130)a | 17.7 % (11.8–25.6%) |
| University of Sao Paulo (Brazil): 1978-80311 | 84% | General inpatients (997) | 33.7% (30.8–36.7%)b |
| 39 Connecticut institutions performing autopsies: 198014 | 14% | General (272) | 26.8%c (21.8–32.6%) |
- a
This study was primarily focused on the accuracy of death certificates. Two anonymous hospitals were involved. At one of the hospitals, 130 of the 229 autopsies had death certificates that the treating clinicians had completed prior to autopsy. The data from these 130 autopsies at one of the two study hospitals provide the basis for the rate of diagnostic discrepancies indicated in the table. The autopsy rate listed for this study is based on all of the autopsies, as it is not possible to calculate a rate applicable to just the 130 cases for which the death certificate was competed prior to autopsy.
- b
This outlier result is largely attributable to the high misclassification rate involving cases of Chagas' disease, which was quite prevalent in this Brazilian autopsy series. Clinical diagnosis was regarded as having missed 71 cases of Chagas's disease, so that 71 cases were assigned to some major disease grouping other than “infectious”- most often the “circulatory” category.
- c
This relatively high result partially reflects the shift of all of 13 cases in the “ill-defined” category to the trauma category and failure to code 15 deaths as due to alcoholism, all of which then counted as missed “mental disorders.” Excluding all 28 of these cases lowers the observed error rate to 16.5% (95% CI: 12.4–21.6%).
As explained in the text, studies included in this table reported the prevalence of cases for which major clinical and autopsy diagnoses fell in different disease categories in the International Classification of Diseases (ICD). Although this classification of clinical-autopsy discrepancies makes no mention of changes in outcome or treatment, such changes would be likely in many, if not most cases. Moreover, the classification scheme is well defined and likely involves less subjectivity than the other two error categories above.
Appendix Table 5 - Studies Addressing the Issue of Clinical Selection Bias in Referral for Autopsy
| Study | Major Findings |
|---|---|
| 75 hospitals in England and Wales (U.K.): 1959127 | Autopsy rates inversely related to clinicians' diagnostic certainty |
| Rates of disagreement between autopsy and clinical diagnoses increased as clinicians became less certain of the cause of death. | |
| Significant clinical-autopsy disagreements still noted in 16% of cases clinicians rated with the high level of confidence. | |
| Serafimerlasarettet (Sweden): 1970-1122 | Rates of autopsy detected diagnostic errors higher in cases with clinical uncertainty |
| Major diagnostic discrepancies still noted in 15% of clinically confident cases under age 70 years of age and 34% of confident cases over age 70. | |
| University of Bergen (Norway): 1975293 | Autopsy rated as “essential” in only 45% of cases identified by clinicians as diagnostically “uncertain” |
| Clinicians appeared to base their impression of autopsy necessity on more than just diagnostic confidence | |
| South Lothian District hospitals (Scotland): 1975-7 155, 156 | Autopsy rates and error rates inversely correlated with clinical confidence |
| Failure to confirm clinical diagnoses still noted in 25% of clinically certain cases | |
| One University of Edinburgh teaching hospital from above study (Scotland): 1978 123 | Study again documented that clinicians pursue autopsies less frequently and make fewer diagnostic errors when they are confident of their diagnoses |
| By contrast, there was no difference in diagnostic error rates between autopsies clinicians viewed as necessary and those they viewed as unnecessary | |
| Leiden University Hospital (Netherlands): 1984 118 | Clinicians identified cases as certain (185), probable (54) or uncertain (50). Major diagnostic errors were identified in 4% of the first category, 15% of the second and 46% for the third. |
| Brigham & Women's Hospital (Boston, MA) and Emerson Hospital (Concord, MA): 1984-85 129 | Clinicians' prospective impressions of the likelihood of unexpected findings at autopsy showed no significant relationship to the occurrence of major unexpected findings (Class I or II errors) |
Appendix Table 6 - Unsuspected complications of care detected at Autopsy
| Institution | Autopsy Rate | Case Mix (Number of Autopsies) | Unsuspected complications (95% CI) |
|---|---|---|---|
| Peter Bent Brigham Hospital (Boston): 196051 | 38% | Adult inpatients (100) | 1% (0.05–6.2%) |
| Peter Bent Brigham Hospital (Boston): 197051 | 38% | Adult inpatients (100) | 3% (0.8–9.2%) |
| Evanston Hospital (Evanston, IL): 1973-82 | Not stated | General inpatients and forensic cases (2,537) | 3.1% (2.5–3.9%) |
| Peter Bent Brigham Hospital (Boston): 198051 | 38% | Adult inpatients (100) | 0% (0–4.6%) |
| Brigham & Women's Hospital (Boston, MA): 1984-85 129 | 37% | Adult inpatients (175) | 0.6% (0.03–3.6%) |
| Emerson Hospital (Concord, MA): 1984-85 129 | 26% | Adult inpatients (58) | 0% (0–7.7%) |
| Hospital for Sick Children (Canada): 1985-90124 | 62% | Neonatal ICU (338) | 15.4% (11.8–19.8%) |
| Johns Hopkins Hospital (Baltimore, MD): 1985-9594 | 24% | Adult cardiac surgery (147) | 1.4% (0.2–5.3%) |
| Royal Alexandra Hospital for Children (Australia): 1991-97308 | 40% | Neonatal ICU (91) | 4.4% (1.4–11.5%) |
| Prince of Wales Hospital (Hong Kong): 1997211 | 17.7% | General inpatients and forensic cases (332) | 3.6% (2.0–6.4%) |
| Central Hospital of Akershus (Norway): 1993-95312 | 78% | Adult medicine (572) | 7.7%d (5.7–10.3%) |
- d
This rate refers to adverse drug events (ADEs) only, not all complications. On the other hand, it is not clear how “unsuspected” these complications were. The authors stated that the autopsy was “decisive for identifying fatal ADEs” in 44 autopsies (from a total of 572).
Appendix Table 7 - Sensitivity Of Clinical Diagnosis For Patients with Five Target Conditions
| Condition | Estimated Sensitivity of Clinical Diagnosis | Source of Estimate |
|---|---|---|
| Acute PE | 87–97% | A prospective clinical registry of 2,454 patients with suspected or confirmed PE, included 61 major PE cases first detected at autopsy. 177 As a high proportion of the remaining cases were diagnosed with high probability, these data permit a reasonable estimate of the sensitivity of clinical diagnosis in detecting acute PE. (The assumptions required to generate this estimate are discussed in the text.) |
| Acute myocardial infarction | 96–98% | Four large cohort studies of patients presenting to the hospital189–192 have reported that 2–4% wutg acute MI or unstable angina are clinically missed and inappropriately discharged from the emergency departmente |
| Acute appendicitis | ~98% | This estimate comes from the one autopsy study155, 156 that includes data on discharge diagnoses for all patients, not just those who died. The high sensitivity listed here does not take into account whether or not perforation had already occurred by the time the clinical diagnosis was made. |
| ~90% | This estimate reflects the false-negative rate for physicians assessing patients with acute abdominal pain in the office or ED - i.e., it does not take into account eventual clinical diagnosis by consulting surgeons or other physicians seeing these patients after hospital admission. As explained in the text, the study included a cohort of 1,118 consecutive patients with abdominal pain, 44 of whom proved to have appendicitis.194 | |
| Acute dissection of the aorta | 45–90% | Data from two large clinical series indicate that 10–55% of patients with aortic dissection are not identified until autopsy.204, 205 |
| Active tuberculosis | >83% | One autopsy study155, 156 included data on discharge diagnoses for all patients, not just those who died, allowing estimation of the sensitivity of clinical diagnosis using reasonable assumptions discussed in the text. |
| 39–96% | Data from a department of health indicated that the diagnosis of TB followed death in 4% of 3,102 reported cases.219 | |
- e
As explained in the text, population level studies of “unrecognized MI” were not included here, because the majority of patients with this entity have minimal or no symptoms and so do not seek medical attention.
Appendix Figure 1. Autopsy Rates Over Time Based on Autopsy Studies of Diagnostic Errors
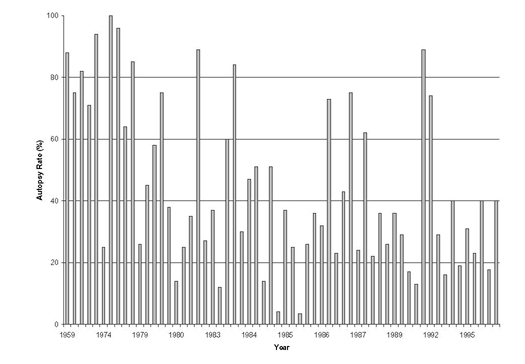
Legend: these autopsy rates are those reported from all included studies of autopsy-detected diagnostic errors and thus reflect rates from institutions around the world. Appendix Figure 2 shows US data only and is limited to institutions with more than one time point, so that the general trend toward fewer autopsies is more apparent
NB: This figure does not include the 3 most recent studies,319–321 though these studies were used in the regression analyses and have been included in several of the other figures and tables.
Appendix Figure 2. Trends in U.S. Autopsy Rates
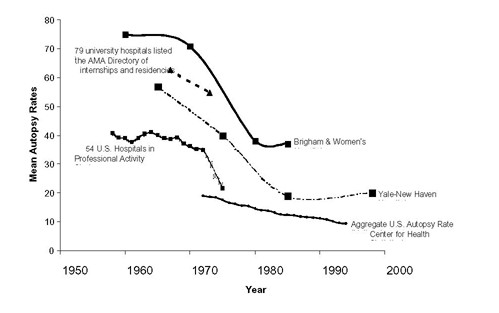
Legend: Trends derived from the following sources: 54 US Hospitals in Professional Activity Study (PAS)313; aggregate US autopsy rate32; 79 university hospitals listed in the American Medical Association directory of approved internships and residencies314; Yale-New Haven Hospital (New Haven, CT)28, 315; Brigham & Women's Hospital (Boston, MA)51, 129
The table on the following page shows additional data on US autopsy rates.
Addendum to Appendix Figures 2: Trends in Autopsy Rates - Studies from a single time period, but involving more than 2 US institutions
| Place/Institution | Observation Period | Mean Autopsy Rate |
|---|---|---|
| 18 States316 | 1967 | 26.7% |
| 19 States (only partial overlap with above)316 | 1968 | 20.2% |
| 1,828 US Hospitals in Professional Activity Study (PAS)317 | 1975 | 21.7% (28.4% for teaching hospitals) |
| 21 university teaching hospitals70 | 1984 | 32% |
| 11 community non-teaching hospitals70 | 1984 | 20% |
| Six Veterans Affairs Hospitals131 | 1986-7 | 43% |
| 256 Pathology departments in College of American Pathologists Q-probe study (49% teaching hospitals)318 | 1993 | 12.4% (median 8.5%) |
Appendix Figure 3. Class I Error Rates with 95% Confidence Intervals
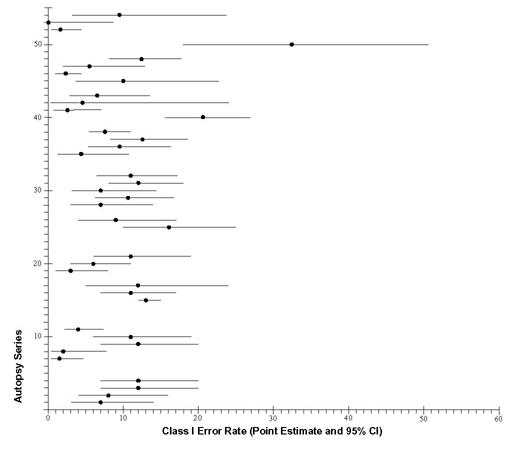
Legend for Appendix Figures 3 & 4
The numbering of the autopsy series here corresponds to the vertical axis in Appendix Figure 3 and in Appendix Figure 4
| Autopsy Series | Year | Autopsy Rate | Case Mix (No. of autopsies) | Major Error Rate (95% CI) | Class I Error Rate (95% CI) |
|---|---|---|---|---|---|
| 1. Christian-Albrechts University Hospital (Germany)54 | 1959 | 88% | General inpatients (100) | ---- | 7% (3–14%) |
| 2. Peter Bent Brigham Hospital (Boston)51 | 1960 | 75% | Adult inpatients (100) | 22% (15–32%) | 8% (4–16%) |
| 3. Christian- Albrechts University Hospital (Germany)54 | 1969 | 82% | General inpatients (100) | ---- | 12% (7–20%) |
| 4. Peter Bent Brigham Hospital (Boston)51 | 1970 | 71% | Adult inpatients (100) | 23% (15–33%) | 12% (7–20%) |
| 5. South Lothian District hospitals (Scotland)3, 4 | 1975-77 | 25% | General inpatients (1,152) | 38% (36–41%) | ---- |
| 6. University of Edinburgh (Scotland)5 | 1978 | 64% | General inpatients (154) | 15% (10–22%) | ---- |
| 7. Winnipeg Health Sciences Center (Canada)299 | 1978-79 | 26%22 | Adult inpatients (200) | ---- | 1.5% (0.4–4.7%) |
| 8. Royal Adelaide Hospital (Australia)300 | 1979 | 45% | Adult inpatients (99) | ---- | 2.0% (0.4–7.8%) |
| 9. Christian- Albrechts University Hospital (Germany)54 | 1979 | 58% | General inpatients (100) | ---- | 12% (7–20%) |
| 10. Peter Bent Brigham Hospital (Boston)51 | 1980 | 38% | Adult inpatients (100) | 21% (14–30%) | 11% (6–19%) |
| 11. Thirty-nine Connecticut institutions performing autopsies 14 | 1980 | 14% | General autopsies (272) | ---- | 4.0% (2.1–7.3%) |
| 12. Belgrade University School of Medicine (Yugoslavia)301 | 1981-84 | 12% | General inpatients (2,145) | 29% (26.9–30.8%) | ---- |
| 13. White River Junction VA Medical Center 78 | 1983 | 60% | General inpatients (111) | 12.6% (7.3–20.6%) | ---- |
| 14. Chandigarh Postgraduate Institute (India)309 | 1983-88 | 23–27%23 | Adult inpatients24 (1,000) | 31.7% (28.8–34.7%) | ---- |
| 15. 32 U.S. university and community hospitals 70 | 1984 | 30% | General inpatients (2,067)25 | 34% (32–36%) | 13% (12–15%) |
| 16. Brigham & Women's Hospital (Boston)129 | 1984-85 | 37% | Adult inpatients (175) | 23% (17–30%) | 11% (7–17%) |
| 17. Emerson Hospital (Concord, MA)129 | 1984-85 | 26% | Adult inpatients (58) | 33% (21–46%) | 12% (5–24%) |
| 18. Northwestern Memorial Hospital (Chicago)130 | 1985 | 36% | General inpatients (142) | 23% (17–31%) | ---- |
| 19. Medical Center of Delaware 210 | 1988-91 | 17% | General inpatients (145) | 12% (7–18%) | 3% (1–8%) |
| 20. St. Vincent's Hospital (Australia)160 | 1988 | 22% | General inpatients (139) | ---- | 6% (3–11%) |
| 21. Christian- Albrechts University Hospital (Germany)54 | 1989 | 36% | General inpatients (100) | ---- | 11% (6–19%) |
| 22. Peterborough District Health Authority (UK)310 | 1990 | 13% | General inpatients (63) | 19% (11–31%) | ---- |
| 23. University of Pittsburgh Medical Center150 | 1994 | 19% | General inpatients (172) | 34% (27–42%) | ---- |
| 24. Prince of Wales Hospital (Hong Kong)211 | 1997 | 17.7% | General autopsies (332) | 23.5% (19.1–28.5%) | ---- |
| 25. Zurich University Hospital (Switzerland)55 | 1972 | 94% | Medical patients (100) | 30% (21.4–40.1%) | 16% (10–25%) |
| 26. Zurich University Hospital (Switzerland)55 | 1982 | 89% | Medical patients (100) | 18% (11.3–27.2%) | 9% (4–17%) |
| 27. Leiden University Hospital (Netherlands)118 | 1984 | 47% | Medical patients (133) | 41% (33–50%) | ---- |
| 28. Zurich University Hospital (Switzerland)55 | 1992 | 89% | Medical patients (100) | 14% (8.1–22.7%) | 7% (3–14%) |
| 29. Ben Taub General Hospital (Houston)116 26 | 1992-93 | 16% | Medical patients (110) | 23.6% (16.3–32.9%) | 10.9% (6.3–16.8%) |
| 30. Hospital Central de la Cruz Roja (Spain)125 | 1983-8527 | 51% | Adult ICU (100) | 22% (14.6–31.6%) | 7% (3.1–14.4%) |
| 31. Six Department of Veterans Affairs Hospitals131 | 1986-87 | 43% | Medical ICU (172) | 27.9% (21.5–35.3%) | 12% (8–18%) |
| 32. Hartford Hospital (New Haven, CT) 304 | 1986-92 | 29% | Surgical ICU (149) | 23% (16.5–30.6%) | 11% (6.5–17.1%) |
| 33. Cleveland Clinic2 | 1994-95 | 23% | Medical ICU (91) | 19.8% (12.4–29.7%) | ---- |
| 34. Hershey Medical Center (Hershey, PA)117 | 1994-95 | 31% | Medical-Coronary ICU (41) | 27% (15–43%) | ---- |
| 35. Gloucestershire Royal Hospital (UK)3 | 1996-99 | 40% | Adult ICU (97) | 23.7% (15.9–33.6%) | 4.1% (1.3–10.8%) |
| 36. General Hospital Celje (Slovenia)320 | 1998-99 | 47% | Medical ICU (126) | ---- | 9.5% (5.2–16.4%) |
| 37. San Francisco General Hospital and 31 hospitals in Orange County, CA302 28 | 1974-75 | 100% | Motor vehicle fatalities (182) | ---- | 12.6% (8.3–18.6%) |
| 38. University of Texas Medical Branch (Galveston)305 | 1984-88 | 73% | Adult and pediatric surgery (409) | 30.3% (26–35.1%) | 7.8% (5.5–11%) |
| 39. Johns Hopkins Hospital (Baltimore)94 | 1985-95 | 24% | Cardiac surgery (147) | 38.8% (31.0–47.2 %) | ---- |
| 40. Royal Victoria Hospital (Northern Ireland)306 | 1986-88 | 23% | Post-operative deaths (213)29 | 49.8% (42.9–56.6%) | 20.7% (15.6–26.8%) |
| 41. Ryder Trauma Center (Miami)321 | 1997-98 | 97% | Adult & pediatric trauma/bum patients dying in ICU30 (153) | 15.7% (10.5–22.6%) | 2.6% (0.8–7.0%) |
| 42. Children's Hospital of New Jersey (Newark)133 | 1992 | 29% | General pediatrics31 (23) | 13.0% (3.4–34.7%) | 4.3 % (0.2–24.0%) |
| 43. Lutheran General Children's Hospital (Park Ridge, III)128 | 1984-93 | 36% | General pediatrics32 (107) | 13.1% (7.6–21.3%) | 6.5 % (2.9–13.5 %) |
| 44. University of Rochester Medical Center (Rochester, NY)126 | 1989-94 | 74% | General pediatrics (157) | 6.4% (3.3–11.7%) | ---- |
| 45. North Shore University Hospital (Manhasset, NY)132 | 1985-92 | 26% | Pediatric ICU (50) | 28.0% (16.7–42.7%) | 10% (3.7–22.6%) |
| 46. Toronto Hospital for Sick Children (Canada)124 | 1985-90 | 62% | Neonatal ICU (338) | 18.9% (15.0–23.6%) | 2.1% (0.9–4.4%) |
| 47. Royal Alexandra Hospital for Children (Australia)308 | 1991-97 | 40% | Neonatal ICU (91) | ---- | 5.5 % (2.0–12.9 %) |
| 48. King Edward Memorial Hospital (India)319 | 1995-9633 | 82% | Neonatal ICU (197) | 26.9 (21.0–33.8%) | 12.2 (8.1–17.8%) |
| 49. Salford Health Authority (UK)295 | 1981 | 35%34 | Inpatients over 85 yrs old (129) | 31% (23.3–39.8%) | ---- |
| 50. Mason F. Lord Nursing Home (Baltimore)303 35 | 1981-88 | 3.5% | Nursing home residents (34) | 47.1% (30.2–64.6%) | 32.4% (18–50.6%) |
| 51. Beth Israel Hospital (Boston)158 | 1981-83 | 27% | Adult inpatients post-CPR36 (130) | 13.8% (8.6–21.3%) | ---- |
| 52. University of Massachusetts Medical Center (Worcester, MA)120 | 1984-88 | 32% | Deaths in ED37 (244) | 4.1% (2.1–7.6%) | 1.6% (0.5–4.4%) |
| 53. Children's Hospital of Western Ontario (Canada)307 | 1985-89 | 75% | Pediatric Deaths in ED (52) | 15.4% (7.3–28.6%) | 0% (0–8.6%) |
| 54. Ben Taub General Hospital (Houston)116 | 1992-93 | 16%38 | Adult inpatients with AIDS (42) | 33.3% (20.0–49.6%) | 9.5% (3.1–23.6%) |
- 22
Rate reflects “teaching cases” only, with medicolegal cases excluded; overall autopsy rate for this period including medicolegal/forensic cases was 44%.
- 23
Stated range for annual autopsy rates during study period; overall autopsy rate not stated.
- 24
Aged 15 years and older.
- 25
Not clear how many pediatric patients included as study states only that 2,067 autopsies reviewed included 360 cases under 20 years of age.
- 26
Patients with Acquired Immunodeficiency Syndrome (AIDS) were reported separately — series 54, the last entry in this table.
- 27
May, 1983-Dec.1985 —> in calculating midpoint, was roundd to nearest year or mid-year so became 1984.5.
- 28
The authors of this study were focused primarily on demonstrating the difference in quality of care between a region with a Level 1 trauma center (San Francisco County) and a region (Orange County) where trauma patients are sent to nearest available facility. Chart reviews were conducted by the authors and were not blinded to patient location. Because of the significant potential for bias introduced by non-blinded peer review, the results for the two regions were combined rather than presenting separate Class I error rates for the two regions.
- 29
“Perioperative” was defined as deaths during surgery or within 30 days after surgery. Thus, this sample essentially represents deaths among patients who have undergone surgery, as opposed to patients who die on the surgical service without having undergone operation.
- 30
Age range 9–104; mean = 50 y.o.
- 31
Deaths in the Emergency Department were excluded.
- 32
Deaths in neonatal ICU were excluded.
- 33
July 1995-August 1996, so only one year, but midpoint is January 1996.
- 34
The listed autopsy rate is for patients aged 65 and over; the rate specifically for the group over 85 years is unclear.
- 35
This value represents an average over the study period, with yearly rates ranging from 1.6–10.8%. In fact, all but the last year had rates under 3%, with the increase in the final year attributed to targeted efforts to increase autopsies.
- 36
Study autopsies drawn from inpatients who died after undergoing cardiopulmonary resuscitation (CPR); patients who experienced cardiac arrest outside the hospital, in the Emergency Department or ambulatory clinics were excluded.
- 37
Study focused on patients who died in the Emergency Department (ED) or within 7 days of hospitalization after admission through the ED; forensic cases were included.
- 38
Listed autopsy rate is for all medical patients; specific autopsy rate for AIDS patients not stated.
Appendix Figure 4 - Major Error Rates with 95% confidence Intervals
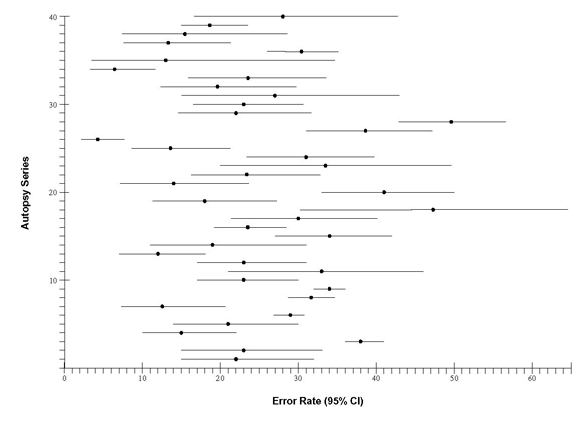
Legend to Appendix Figure 4
The numbering of the autopsy series here corresponds to the vertical axis in the Appendix Figure 4
| Institution | Autopsy Rate | Case Mix (Number of Autopsies) | Error Rate (95% CI) |
|---|---|---|---|
| 1. Peter Bent Brigham Hospital (Boston): 196051 | 75% | Adult inpatients (100) | 22% (15–32%) |
| 2. Peter Bent Brigham Hospital (Boston): 197051 | 71% | Adult inpatients (100) | 23% (15–33%) |
| 3. South Lothian District hospitals (Scotland): 1975-7155, 156 | 25% | General inpatients (1152) | 38% (36–41%) |
| 4. University of Edinburgh teaching hospital (Scotland): 1978123 | 64% | General inpatients (154) | 15% (10–22%) |
| 5. Peter Bent Brigham Hospital (Boston): 198051 | 38% | Adult inpatients (100) | 21% (14–30%) |
| 6. Belgrade University School of Medicine (Yugoslavia): 1981-84301 | 12% | General inpatients (2,145) | 29% (26.9–30.8%) |
| 7. White River Junction VA Medical Center (White River Junction, VT): 198378 | 60% | General inpatients (111) | 12.6% (7.3–20.6%) |
| 8. Chandigarh Postgraduate Institute of Medical Education and Research (India): 1983-88309 | 23–27% | Adult inpatients (1000) | 31.7% (28.8–34.7%) |
| 9. 32 US hospitals (21 university and 11 community non-teaching): 198470 | 30% | General inpatients (2067) | 34% (32–36%) |
| 10. Brigham & Women's Hospital (Boston): 1984-85129 | 37% | General inpatients (175) | 23% (17–30%) |
| 11. Emerson Hospital (Concord, MA): 1984-85129 | 26% | General inpatients (58) | 33% (21–46%) |
| 12. Northwestern Memorial Hospital (Chicago): 1985130 | 36% | General inpatients (142) | 23% (17–31%) |
| 13. Medical Center of Delaware: 1988-91210 | 17% | General inpatients (145) | 12% (7–18%) |
| 14. Peterborough District Health Authority (England): 1990310 | 13% | General inpatients (63) | 19% (11–31%) |
| 15. University of Pittsburgh Medical Center (Pittsburgh): 1994152 | 19% | General inpatients (172) | 34% (27–42%) |
| 16. Prince of Wales Hospital (Hong Kong): 1997211 | 17.7% | General inpatients and forensic cases (332) | 23.5% (19.1–28.5%) |
| 17. Zurich University Hospital (Switzerland): 197255 | 94% | Adult medical (100) | 30% (21.4–40.1%) |
| 18. Mason F. Lord Nursing Home (Baltimore, MD): 1981-88303 | 3.5% | Nursing home residents (34) | 47.1% (30.2–64.6%) |
| 19. Zurich University Hospital (Switzerland): 198255 | 89% | Adult medical (100) | 18% (11.3–27.2%) |
| 20. Leiden University Hospital (Netherlands): 1984118 | 47% | Adult medical (133) | 41% (33–50%) |
| 21. Zurich University Hospital (Switzerland): 199255 | 89% | Adult medical (100) | 14% (8.1–22.7%) |
| 22. Ben Taub General Hospital (Houston, TX): 1992-3116 | 16% | Medical patients (110) | 23.6% (16.3–32.9%) |
| 23. Ben Taub General Hospital (Houston, TX): 1992-3116 | 16% | Patients with AIDS (42) | 33.3% (20.0–49.6%) |
| 24. Salford Health Authority (UK): 1981295 | 35% | Inpatients over 85 yrs old (129) | 31% (23.3–39.8%) |
| 25. Beth Israel Hospital (Boston, MA): 1981-83158 | 27% | Adult inpatient deaths after undergoing CPR (130) | 13.8% (8.6–21.3%) |
| 26. University of Massachusetts Medical Center (Worcester, MA): 1984-88120 | 32% | Emergency patients (244) | 4.1% (2.1–7.6%) |
| 27. Johns Hopkins Hospital (Baltimore, MD): 1985-9594 | 24% | Adult cardiac surgery (147) | 38.8% (31.0–47.2 %) |
| 28. Royal Victoria Hospital (Northern Ireland): 1986-88306 | 23% | Adult and pediatric perioperative deaths (213) | 49.8% (42.9–56.6%) |
| 29. Hospital Central de la Cruz Roja (Spain): 1983-85125 | 51% | Adult ICU (100) | 22% (14.6–31.6%) |
| 30. Hartford Hospital (New Haven, CT): 1986-92304 | 29% | Adult surgical ICU (149) | 23% (16.5–30.6%) |
| 31. Hershey Medical Center (Pennsylvania, PA): 1994-5117 | 31% | Adult ICU (41) | 27% (15–43%) |
| 32. Cleveland Clinic (Cleveland, OH): 1994-952 | 23% | Medical ICU (91) | 19.8% (12.4–29.7%) |
| 33. Gloucestershire Royal Hospital (U.K.): 1996-993 | 40% | ICU patients (97) | 23.7% (15.9–33.6%) |
| 34. University of Rochester Medical Center (Rochester, NY): 1989-94126 | 74% | Pediatric inpatients including forensic cases (157) | 6.4% (3.3–11.7%) |
| 35. Children's Hospital of New Jersey (Newark, NJ): 1992133 | 29% | General Pediatrics (23) | 13.0% (3.4–34.7%) |
| 36. University of Texas Medical Branch (Galveston, TX): 1984-88305 | 73% | Adult and pediatric surgical patients (409) | 30.3% (26–35.1%) |
| 37. Lutheran General Children's Hospital (Park Ridge, III): 1984-93128 | 36% | Pediatric inpatients (107) | 13.1% (7.6–21.3%) |
| 38. Children's Hospital of Western Ontario (Canada): 1985-89307 | 75% | Pediatric Deaths in the Emergency Department (52) | 15.4% (7.3–28.6%) |
| 39. Hospital for Sick Children (Canada): 1985-90124 | 62% | Neonatal ICU (338) | 18.9% (15.0–23.6%) |
| 40. North Shore University Hospital (Manhasset, NY): 1985-92132 | 26% | Pediatric ICU (50) | 28.0% (16.7–42.7%) |
Appendix Figure 5. Class I Error Rates Over Time
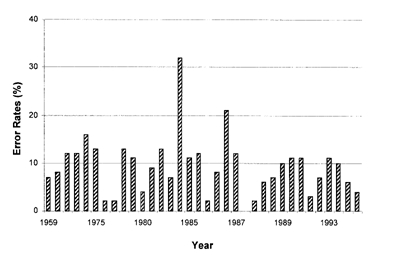
Legend: Class I error rates reported in autopsy series included in review without adjustment from variations in autopsy rate or case mix.
NB: This figure does not include the 3 most recent studies,319–321 though these studies were used in the regression analyses and have been included in several of the other figures and tables.
Appendix Figure 6. Major Error Rates Over Time
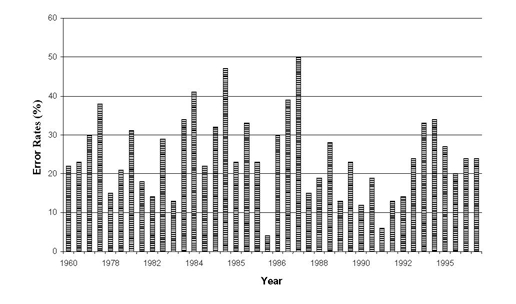
Legend: Major error rates reported in autopsy series included in review without adjustment from variations in autopsy rate or case mix.
NB: This figure does not include the 3 most recent studies,319–321 though these studies were used in the regression analyses and have been included in several of the other figures and tables.
Appendix Figure 7. Class I Error as a Function of Autopsy Rate for 4 Different Time Periods
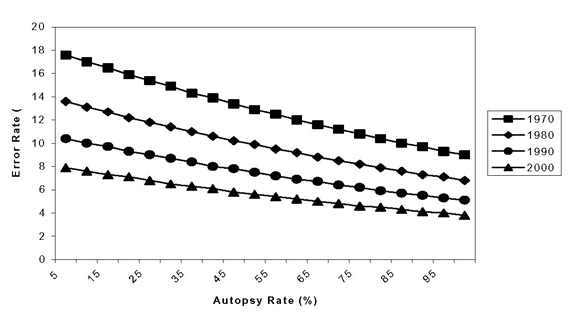
Legend: Class I error rates derived from regression model over a range of autopsy rates in 4 different time periods with a case mix consisting of general inpatients.
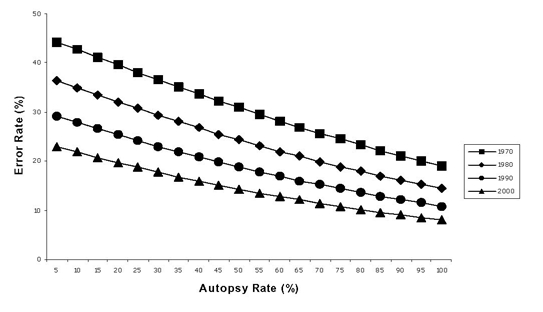
Appendix Figure 8. Major Errors as a Function of Autopsy Rate for 4 Different Time Periods
Appendix Figure 9a. Assessment of Publication Bias: Funnel Plot of All Studies Reporting Class I Errors
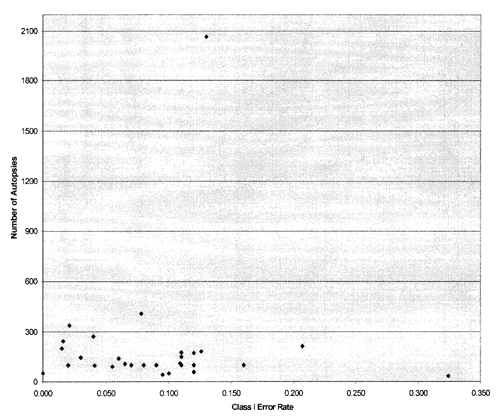
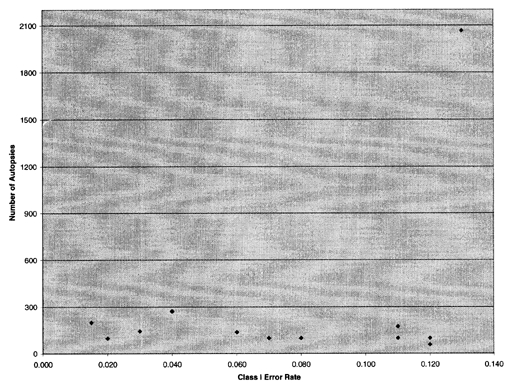
Legend: The above scatter plot graphs the observed error rate against sample size for studies reporting class I errors. For studies of therapeutic interventions, an inverted funnel distribution is expected if there is no publication bias, as the reported effect sizes are expected to be symmetrically distributed about the true effect. In this case, the inclusion of studies with different patient populations introduces additional asymmetry (e.g., the data point furthest to the right represents the only study involving nursing home patients). Therefore, we constructed a funnel plot limited to studies reporting autopsies among general inpatients, Appendix Figure 9b).
NB: Figures 9a & 9b and Figures 10a &10b do not include the 3 most recent studies,319–321 though these studies were used in the regression analyses and have been included in several of the other figures and tables.
Appendix Figure 9b. Assessment of Publication Bias: Funnel Plot Restricted to Studies of Major Errors Among General Inpatients
Appendix Figure 10a. Assessment of Publication Bias: Funnel Plot For All Autopsy Studies Reporting “Major Errors”
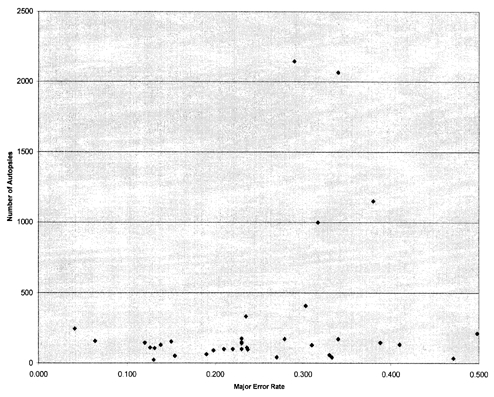
Legend: This scatter plot is more symmetric appearing than that in Appendix Figure 9a. However, because the issue of asymmetry due to inclusion of different patient populations still applies, a separate plot involving general inpatient studies only was again created (Appendix Figure 10b).
NB: Figures 9a & 9b & Figures 10a & 10b do not include the 3 most recent studies,319–321 though these studies were used in the regression analyses and have been included in several of the other figures and tables.
Appendix Figure 10b. Assessment of Publication Bias: Funnel Plot Restricted to Studies of Major Errors Among General Inpatients
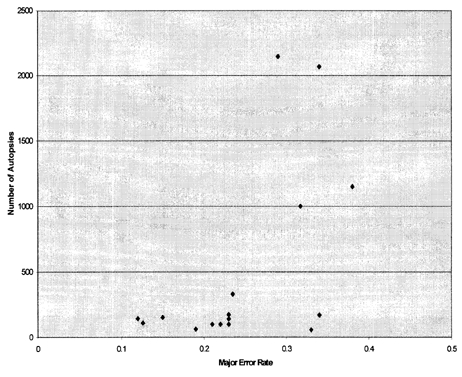
Legend: Restricting the funnel plot to studies reporting general inpatients (as shown above), indicates a relative absence of large studies with low error rates and small studies with high error rates. As explained in the text, the present review differs from systematic reviews of therapeutic studies in that publication bias might be operating in opposing directions (as suggested here). On the one hand, studies reporting very low error rates might be considered uninteresting and subject to publication bias in a manner similar to “negative” therapeutic trials. On the other hand, studies reporting high error rates might be self-censored by the institutions themselves. It is even possible that institutions with high error rates are less likely to conduct these types of studies in the first place (e.g., because they have less interest in performance measurement and improvement).
- Appendix Figure 1. Autopsy Rates Over Time Based on Autopsy Studies of Diagnostic Errors
- Appendix Figure 2. Trends in U.S. Autopsy Rates
- Appendix Figure 3. Class I Error Rates with 95% Confidence Intervals
- Legend for Appendix Figures 3 & 4
- Appendix Figure 4 - Major Error Rates with 95% confidence Intervals
- Legend to Appendix Figure 4
- Appendix Figure 5. Class I Error Rates Over Time
- Appendix Figure 6. Major Error Rates Over Time
- Appendix Figure 7. Class I Error as a Function of Autopsy Rate for 4 Different Time Periods
- Appendix Figure 8. Major Errors as a Function of Autopsy Rate for 4 Different Time Periods
- Appendix Figure 9a. Assessment of Publication Bias: Funnel Plot of All Studies Reporting Class I Errors
- Appendix Figure 9b. Assessment of Publication Bias: Funnel Plot Restricted to Studies of Major Errors Among General Inpatients
- Appendix Figure 10a. Assessment of Publication Bias: Funnel Plot For All Autopsy Studies Reporting “Major Errors”
- Appendix Figure 10b. Assessment of Publication Bias: Funnel Plot Restricted to Studies of Major Errors Among General Inpatients
- Appendix A: Additional Tables and Figures - The Autopsy as an Outcome and Perfor...Appendix A: Additional Tables and Figures - The Autopsy as an Outcome and Performance Measure
- LOC129998007 [Homo sapiens]LOC129998007 [Homo sapiens]Gene ID:129998007Gene
Your browsing activity is empty.
Activity recording is turned off.
See more...
