From: Childhood Cancer Genomics (PDQ®)

NCBI Bookshelf. A service of the National Library of Medicine, National Institutes of Health.

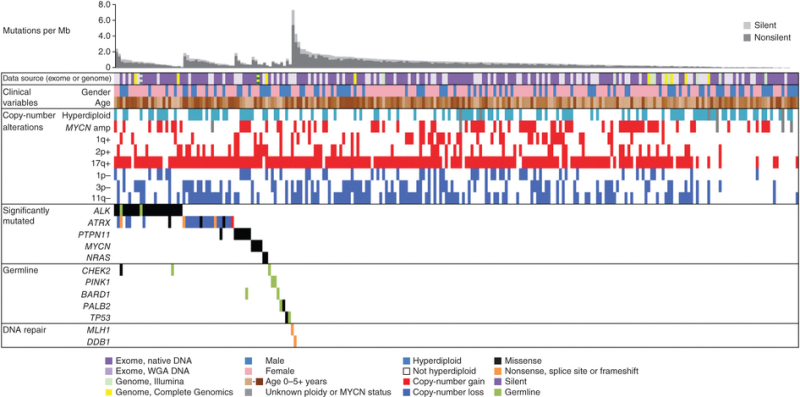
Figure 12. Data tracks (rows) facilitate the comparison of clinical and genomic data across cases with neuroblastoma (columns). The data sources and sequencing technology used were whole-exome sequencing (WES) from whole-genome amplification (WGA) (light purple), WES from native DNA (dark purple), Illumina WGS (green), and Complete Genomics WGS (yellow). Striped blocks indicate cases analyzed using two approaches. The clinical variables included were gender (male, blue; female, pink) and age (brown spectrum). Copy number alterations indicates ploidy measured by flow cytometry (with hyperdiploid meaning DNA index >1) and clinically relevant copy number alterations derived from sequence data. Significantly mutated genes are those with statistically significant mutation counts given the background mutation rate, gene size, and expression in neuroblastoma. Germline indicates genes with significant numbers of germline ClinVar variants or loss-of-function cancer gene variants in our cohort. DNA repair indicates genes that may be associated with an increased mutation frequency in two apparently hypermutated tumors. Predicted effects of somatic mutations are color coded according to the legend. Reprinted by permission from Macmillan Publishers Ltd: Nature Genetics (Pugh TJ, Morozova O, Attiyeh EF, et al.: The genetic landscape of high-risk neuroblastoma. Nat Genet 45 (3): 279-84, 2013), copyright (2013).
From: Childhood Cancer Genomics (PDQ®)

NCBI Bookshelf. A service of the National Library of Medicine, National Institutes of Health.