From: Childhood Cancer Genomics (PDQ®)

NCBI Bookshelf. A service of the National Library of Medicine, National Institutes of Health.

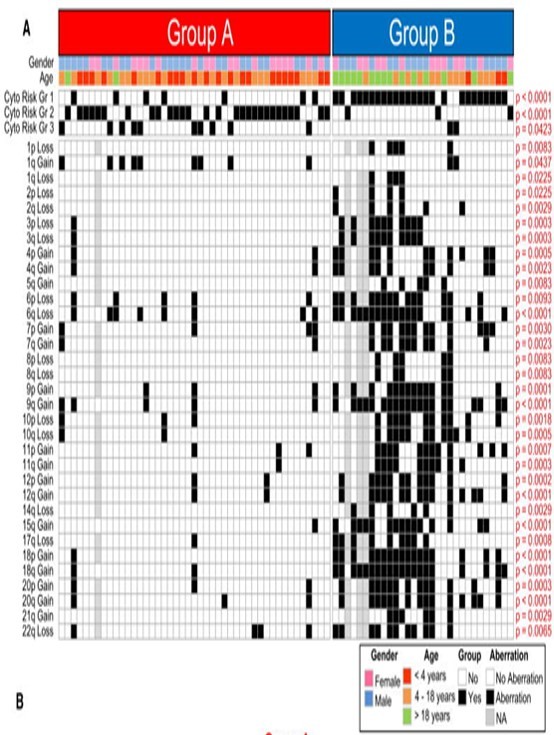
Figure 7. Identification of Subgroup-Specific Copy Number Alterations in the Posterior Fossa Ependymoma Genome. (A) Copy number profiling of 75 PF ependymomas using 10K array-CGH identifies disparate genetic landscapes between Group A and Group B tumors. Toronto and Heidelberg copy number datasets have been combined and summarized in a heatmap. The heatmap also displays the association of tumors to cytogenetic risk groups 1, 2, and 3 (Korshunov et al., 2010). Statistically significant chromosomal aberrations (black boxes) are also displayed between both subgroups, calculated by Fisher's exact test. Witt H, Mack SC, Ryzhova M, et al.: Delineation of two clinically and molecularly distinct subgroups of posterior fossa ependymoma. Cancer Cell 20 (2): 143-57, 2011, doi:10.1016/j.ccr.2011.07.007. Copyright © 2011 Elsevier Inc. All rights reserved.
From: Childhood Cancer Genomics (PDQ®)

NCBI Bookshelf. A service of the National Library of Medicine, National Institutes of Health.