NCBI Bookshelf. A service of the National Library of Medicine, National Institutes of Health.

National Guideline Alliance (UK). Mental Health Problems in People with Learning Disabilities: Prevention, Assessment and Management. London: National Institute for Health and Care Excellence (NICE); 2016 Sep. (NICE Guideline, No. 54.)

Appendix OClinical evidence – forest plots for all studies

Abbreviations

AAMD

American Association for Mental Deficiency (now American Association on Intellectual and Developmental Disabilities)

ABA

applied behaviour analysis

ADAS

Abbreviated Dyadic Adjustment Scale

ADHD

attention deficit hyperactivity disorder

A-PS

assertiveness training, followed by social problem solving

BDI

Beck Depression Inventory

CBT

cognitive behavioural therapy

CI

confidence interval

DASS

Depression Anxiety and Stress Scale

DC-LD

Diagnostic Criteria for Psychiatric Disorders for Use with Adults with Learning Disabilities/mental Retardation

DMR

Dementia Questionnaire for Mentally Retarded

DSDS

Down Syndrome Dementia Scale

DSM-IV

Diagnostic and Statistical Manual of Mental Disorders (4th edition)

DSQIID

Dementia Screening Questionnaire for Individuals with Intellectual Disabilities

FN

false negatives

FP

false positives

GHQ30

General Health Questionnaire (30 item)

ICD-10

International Statistical Classification of Diseases and Related Health Problems (10th edition)

IV

Inverse variance method

KPS-SF

Kansas Parental Satisfaction Scale – Short Form

MASS

Mood and Anxiety Semi-structured Interview

M-H

Mantel-Haenszel method

NADIID

Neuropsychological Assessment of Dementia in Intellectual Disabilities

PAS-ADD

Psychiatric Assessment Schedule for Adults with a Developmental Disability

PS-A

social problem solving, followed by assertiveness training

PSI (-SF)

Parenting Stress Index (-Short Form)

PSOC

Parenting Sense of Competence Scale

QoL

quality of life

RCT

randomised controlled trial

ROC

receiver operating characteristic

SAS-ID

Zung Self-rating Anxiety Scale for Adults with Intellectual Disabilities

SD

standard deviation

SDQ

Strengths and Difficulties Questionnaire

SE

standard error

SF-12

Short Form Health Survey

SIB-R

Severe Impairment Battery – Revised

SNAP-IV

Swanson, Nolan and Pelham Questionnaire (version 4)

SSTP

Stepping Stones Triple-P

STATE-A

state anxiety

TAU

treatment as usual

TN

true negatives

TP

true positives

TRAIT-A

trait anxiety

VABS

Vineland Adaptive Behaviour Scales

O.1. Measures to assess mental health needs among people with learning disabilities

O.1.1. General measures of mental health

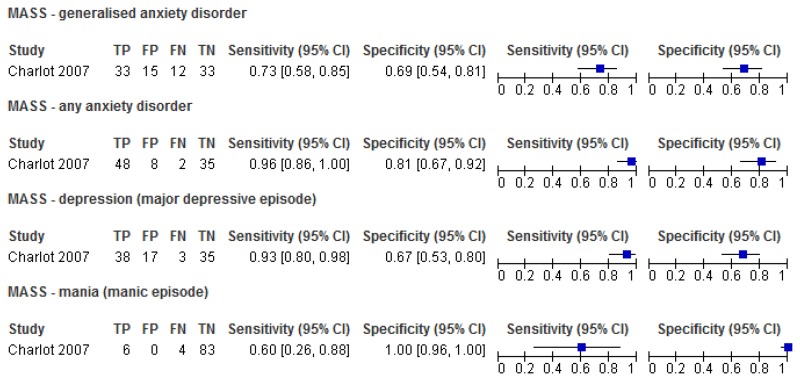
O.1.1.1. Mood and Anxiety Semi-Structured Interview (MASS)

Figure 1. Sensitivity and specificity of the MASS for the detection of mental health problems among adults with learning disabilities.

Figure 1Sensitivity and specificity of the MASS for the detection of mental health problems among adults with learning disabilities

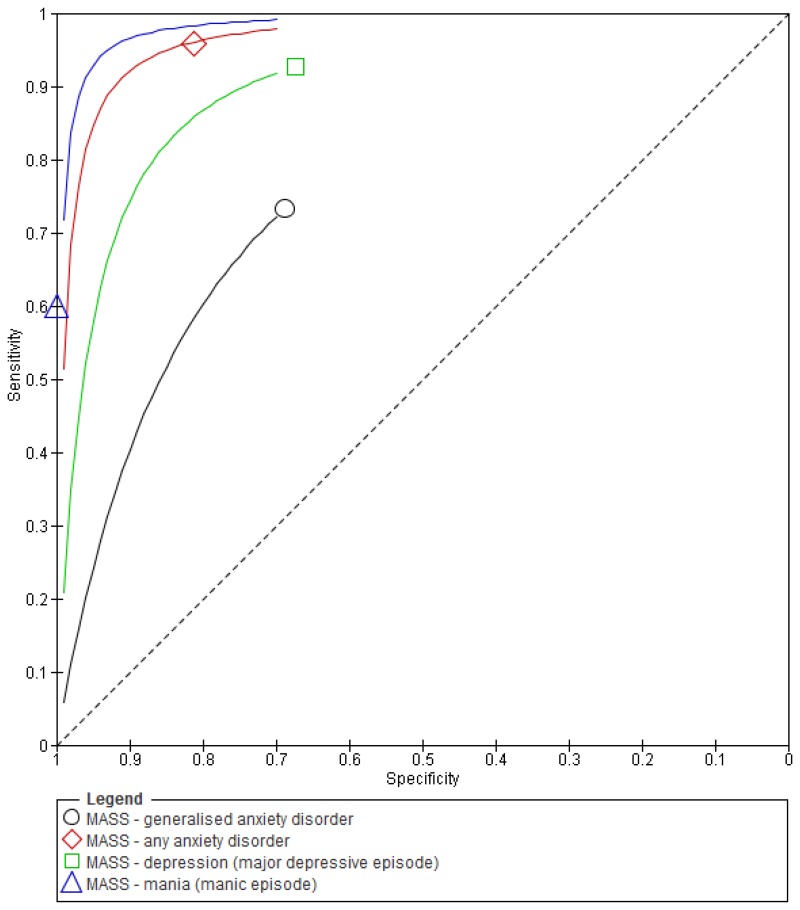
Figure 2. ROC curve for MASS (DSM-IV reference standard).

Figure 2ROC curve for MASS (DSM-IV reference standard)

O.1.1.2. Psychiatric Assessment Schedule for Adults with Developmental Disabilities (PAS-ADD) – Interview

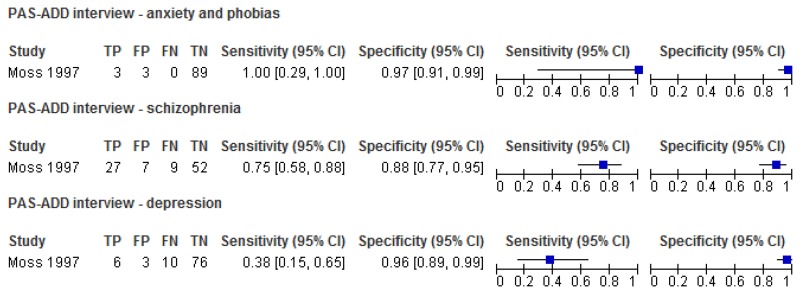
Figure 3. Sensitivity and specificity of the PAS-ADD Interview for detecting mental health problems in adults with learning disabilities.

Figure 3Sensitivity and specificity of the PAS-ADD Interview for detecting mental health problems in adults with learning disabilities

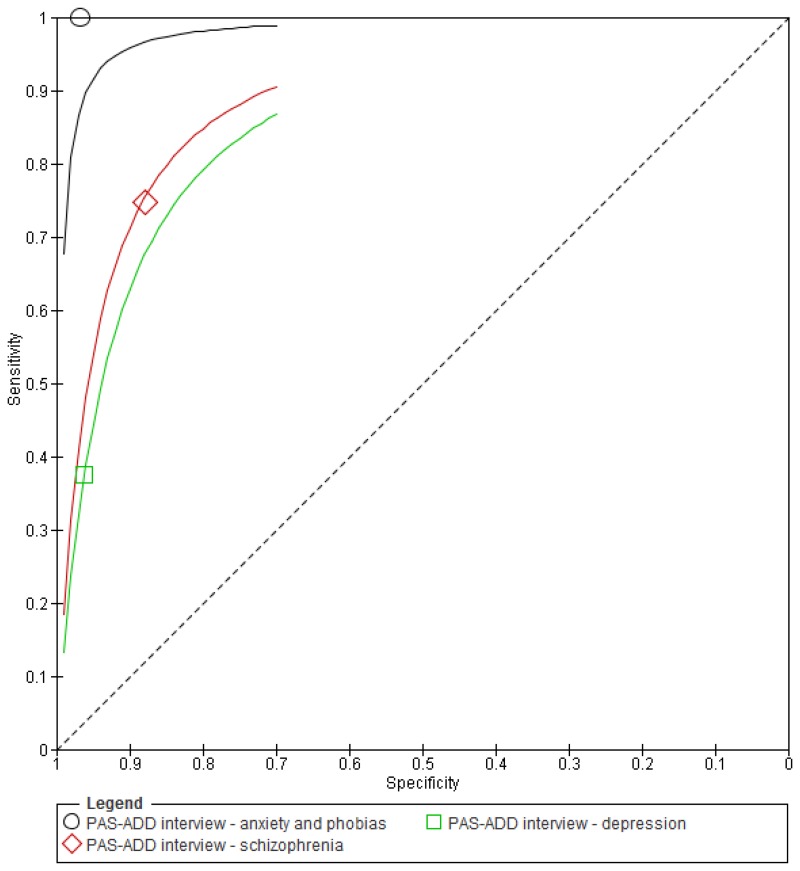
Figure 4. ROC curve for the PAS-ADD Interview (unclear reference standard).

Figure 4ROC curve for the PAS-ADD Interview (unclear reference standard)

O.1.1.3. Psychiatric Assessment Schedule for Adults with Developmental Disabilities (PAS-ADD) – Checklist

Figure 5. Sensitivity and specificity of the PAS-ADD Checklist for the detection of mental health problems among adults with learning disabilities.

Figure 5Sensitivity and specificity of the PAS-ADD Checklist for the detection of mental health problems among adults with learning disabilities

Figure 6. ROC curve for the PAS-ADD Checklist (psychiatric [unspecified] reference standard).

Figure 6ROC curve for the PAS-ADD Checklist (psychiatric [unspecified] reference standard)

O.1.1.4. Psychiatric assessment schedule for adults with developmental disabilities (PAS-ADD) – Mini

Figure 7. Sensitivity and specificity of the Mini PAS-ADD for the detection of mental health problems in adults with learning disabilities.

Figure 7Sensitivity and specificity of the Mini PAS-ADD for the detection of mental health problems in adults with learning disabilities

Figure 8. ROC curve for the Mini PAS-ADD (psychiatric diagnosis [unspecified] reference standard).

Figure 8ROC curve for the Mini PAS-ADD (psychiatric diagnosis [unspecified] reference standard)

O.1.1.5. Comparison between different tools used to identify mental health problems in adults with learning disabilities

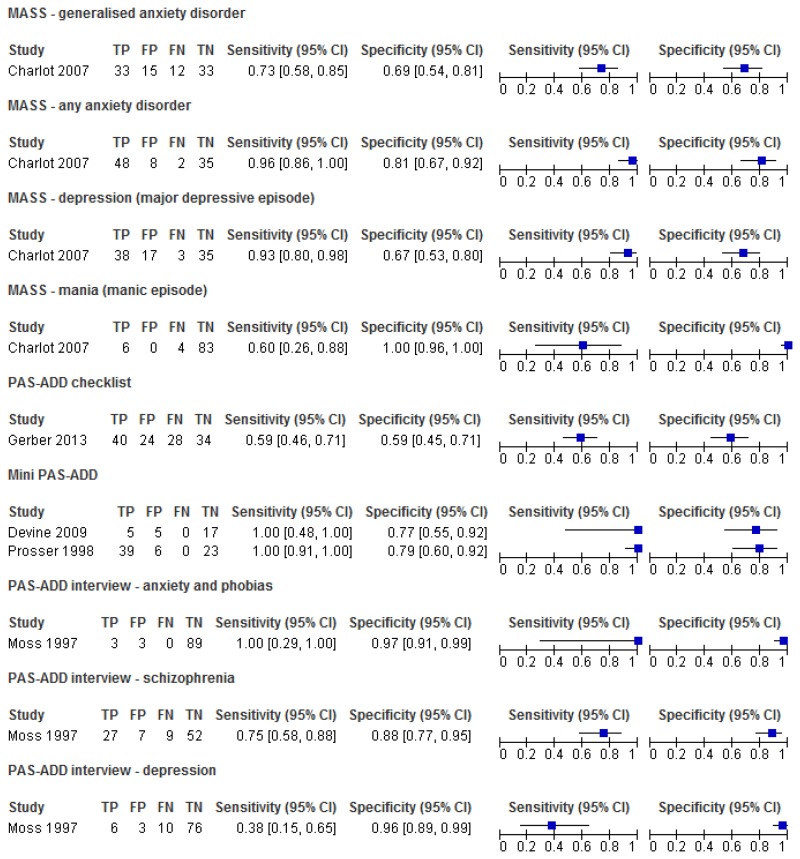
Figure 9. Sensitivity and specificity of different tools used to identify mental health problems in adults with learning disabilities.

Figure 9Sensitivity and specificity of different tools used to identify mental health problems in adults with learning disabilities

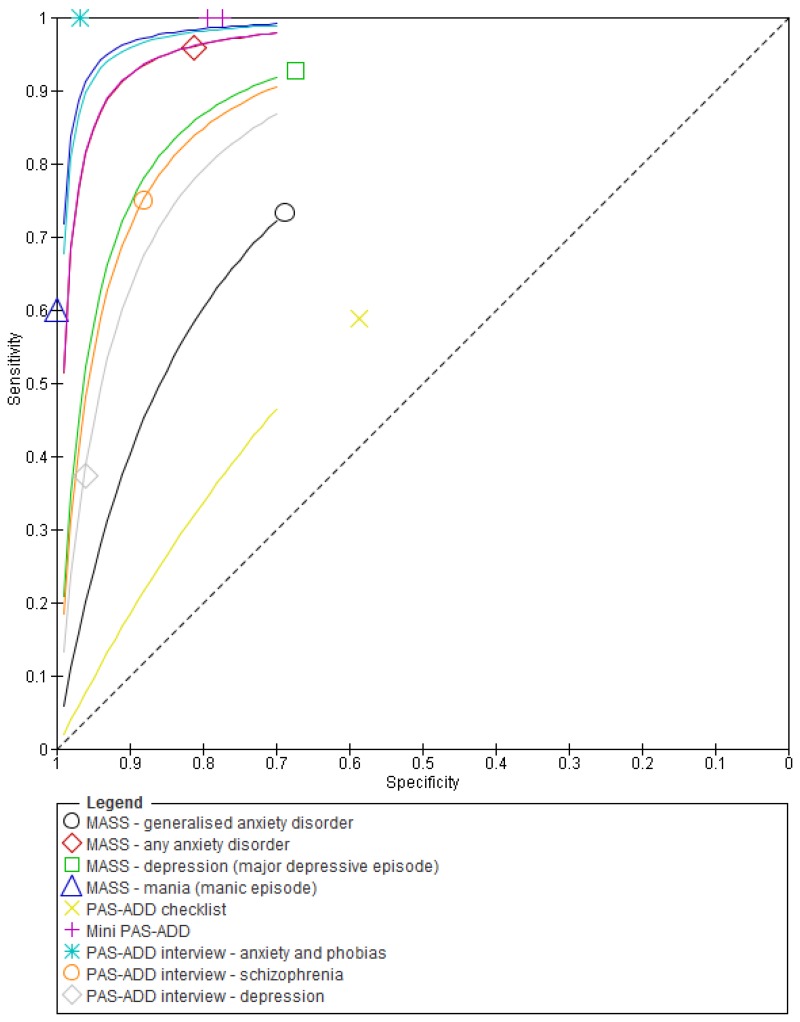
Figure 10. ROC curves for instruments designed to identify mental health problems in adults with learning disabilities.

Figure 10ROC curves for instruments designed to identify mental health problems in adults with learning disabilities

O.1.2. Dementia

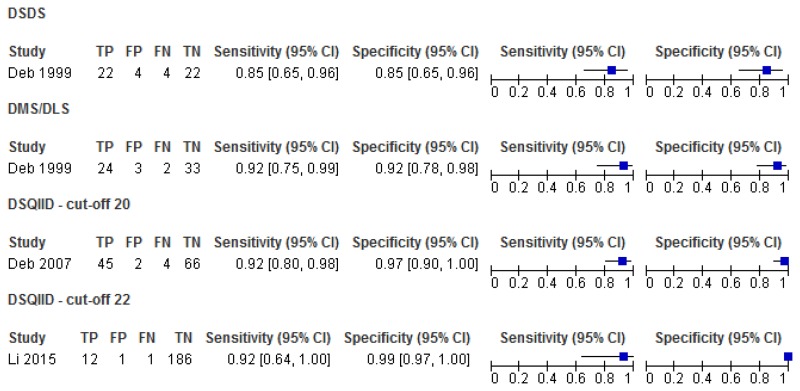
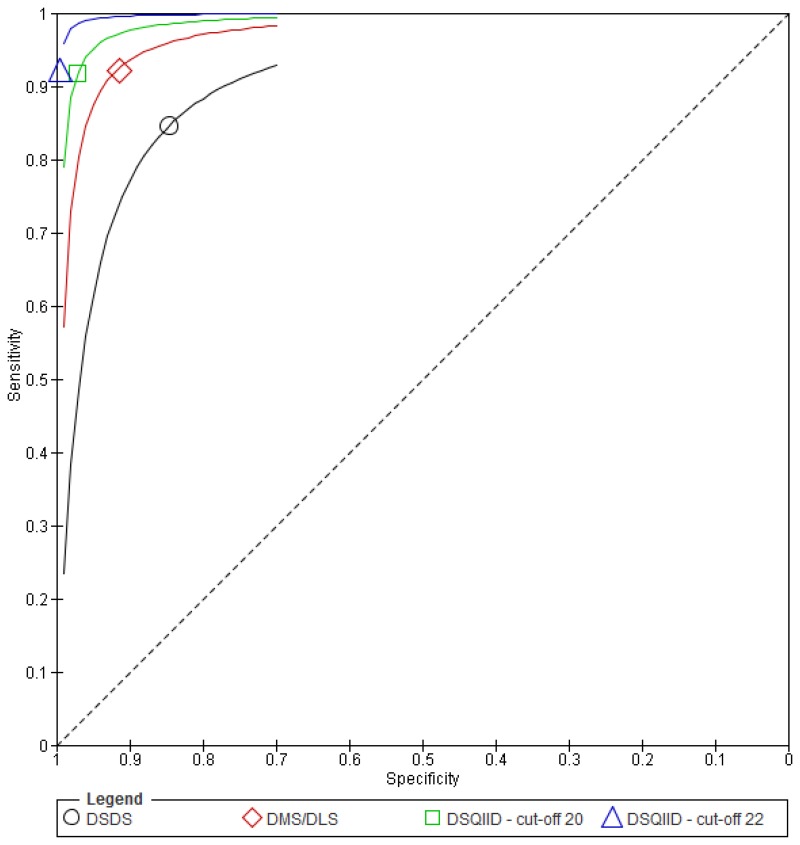
O.1.2.1. Dementia Screening Questionnaire for Individuals with Intellectual Disabilities (DSQIID), Dementia Questionnaire for Mentally Retarded (DMR) and Down Syndrome Dementia Scale (DSDS)

Figure 11. Sensitivity and specificity of the DSQIID, DMR and DSDS for detecting symptoms of dementia in people with learning disabilities.

Figure 11Sensitivity and specificity of the DSQIID, DMR and DSDS for detecting symptoms of dementia in people with learning disabilities

Figure 12. ROC curve for the DSQIID, DMR and DSDS (ICD-10 and DC-LD reference standards).

Figure 12ROC curve for the DSQIID, DMR and DSDS (ICD-10 and DC-LD reference standards)

O.2. Psychological interventions

O.2.1. Mixed mental health problems

O.2.1.1. Mild to moderate learning disabilities

Figure 13. Psychological intervention versus control (RCTs) – mental health measured with various scales (after mean 13.25 weeks of treatment).

Figure 13Psychological intervention versus control (RCTs) – mental health measured with various scales (after mean 13.25 weeks of treatment)

Various scales used including Overall fear rating, Nurses’ Observation Scale for Inpatient Evaluation (NOSIE-30), Brief Symptom Inventory; random-effects model used because of unexplained heterogeneity

Figure 14. Psychological intervention versus control (controlled before-and-after studies) – mental health (Brief Symptom Inventory: Global Severity Index, after 12 weeks of treatment).

Figure 14Psychological intervention versus control (controlled before-and-after studies) – mental health (Brief Symptom Inventory: Global Severity Index, after 12 weeks of treatment)

Figure 15. Psychological intervention versus control – low problem behaviour (Role-play test of anger arousing situations, after 10 weeks of treatment).

Figure 15Psychological intervention versus control – low problem behaviour (Role-play test of anger arousing situations, after 10 weeks of treatment)

Figure 16. Psychological intervention versus control – maladaptive functioning (Adaptive behaviour scale - revised - part II, carer version, after 10 weeks of treatment).

Figure 16Psychological intervention versus control – maladaptive functioning (Adaptive behaviour scale - revised - part II, carer version, after 10 weeks of treatment)

Figure 17. Psychological intervention versus control – adaptive functioning -interpersonal skills on the social performance survey schedule after 18 weeks of treatment).

Figure 17Psychological intervention versus control – adaptive functioning -interpersonal skills on the social performance survey schedule after 18 weeks of treatment)

Figure 18. Social problem solving then assertiveness training versus assertiveness training followed by social problem solving – mental health (Brief Symptom Inventory, after 3 months’ follow-up).

Figure 18Social problem solving then assertiveness training versus assertiveness training followed by social problem solving – mental health (Brief Symptom Inventory, after 3 months’ follow-up)

Figure 19. Social problem solving then assertiveness training versus assertiveness training followed by social problem solving – maladaptive behaviour (Adaptive Behavior Scale-Revised, after 3 months’ follow-up).

Figure 19Social problem solving then assertiveness training versus assertiveness training followed by social problem solving – maladaptive behaviour (Adaptive Behavior Scale-Revised, after 3 months’ follow-up)

Figure 20. Social problem solving then assertiveness training versus assertiveness training followed by social problem solving – adaptive behaviour (problem-solving task, after 3 months’ follow-up).

Figure 20Social problem solving then assertiveness training versus assertiveness training followed by social problem solving – adaptive behaviour (problem-solving task, after 3 months’ follow-up)

Figure 21. Social problem solving then assertiveness training versus assertiveness training followed by social problem solving – low problem behaviour (role-play test of anger arousing situations, after 3 months’ follow-up).

Figure 21Social problem solving then assertiveness training versus assertiveness training followed by social problem solving – low problem behaviour (role-play test of anger arousing situations, after 3 months’ follow-up)

O.2.2. Substance misuse

O.2.2.1. Unclear level of learning disabilities

Figure 22. Psychological intervention versus control – alcohol abuse (after 34 weeks’ follow-up).

Figure 22Psychological intervention versus control – alcohol abuse (after 34 weeks’ follow-up)

Figure 23. Assertiveness versus modelling – alcohol abuse (after 34 weeks’ follow-up).

Figure 23Assertiveness versus modelling – alcohol abuse (after 34 weeks’ follow-up)

O.2.3. Anxiety disorders

O.2.3.1. Anxiety symptoms

O.2.3.1.1. Mild to moderate learning disabilities
Figure 24. Any psychological intervention versus control (RCTs) – anxiety symptoms (various scales at 42 weeks follow-up).

Figure 24Any psychological intervention versus control (RCTs) – anxiety symptoms (various scales at 42 weeks follow-up)

Various scales used – modified Beck’s anxiety inventory and modified Zung anxiety scale; random-effects model used because of unexplained heterogeneity

Figure 25. Any psychological intervention versus control (controlled before-and-after study) – anxiety symptoms (Brief Symptom Inventory: anxiety symptom dimension after 12 weeks follow-up).

Figure 25Any psychological intervention versus control (controlled before-and-after study) – anxiety symptoms (Brief Symptom Inventory: anxiety symptom dimension after 12 weeks follow-up)

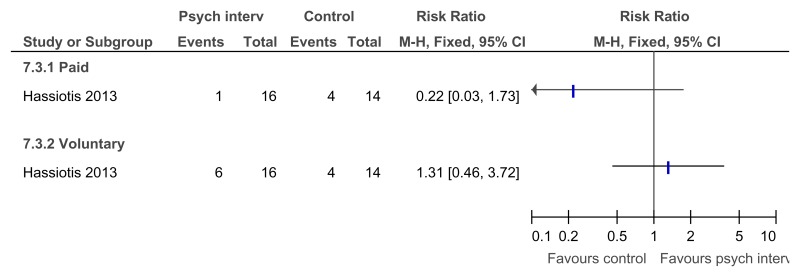
Figure 26. Any psychological intervention versus control – in employment after treatment (16 weeks after treatment).

Figure 26Any psychological intervention versus control – in employment after treatment (16 weeks after treatment)

Figure 27. Any psychological intervention versus control – hours per week in paid employment after treatment (16 weeks after treatment).

Figure 27Any psychological intervention versus control – hours per week in paid employment after treatment (16 weeks after treatment)

Figure 28. Any psychological intervention versus control – hours per week in voluntary work after treatment (16 weeks after treatment).

Figure 28Any psychological intervention versus control – hours per week in voluntary work after treatment (16 weeks after treatment)

O.2.3.1.2. Moderate to severe learning disabilities
Figure 29. Group relaxation training versus control – anxiety symptoms on various scales (after treatment – 2.29 weeks or unclear).

Figure 29Group relaxation training versus control – anxiety symptoms on various scales (after treatment – 2.29 weeks or unclear)

Various scales used – Behavioural anxiety scale and modified Zung anxiety scale; SMD estimated from t-value for Lindsay 1989

Figure 30. Individual relaxation training versus control – anxiety symptoms on Behavioural anxiety scale (after treatment – 2.29 weeks).

Figure 30Individual relaxation training versus control – anxiety symptoms on Behavioural anxiety scale (after treatment – 2.29 weeks)

SMD estimated from t-value; random-effects model used because of unexplained heterogeneity.

O.2.3.2. Social anxiety symptoms

O.2.3.2.1. Mild to moderate learning disabilities
Figure 31. Dating skills programme versus control – mental health (social anxiety symptoms at 24 weeks’ follow-up).

Figure 31Dating skills programme versus control – mental health (social anxiety symptoms at 24 weeks’ follow-up)

Figure 32. Dating skills programme versus control – mental health: significant change in anxiety symptoms (20 weeks’ follow-up).

Figure 32Dating skills programme versus control – mental health: significant change in anxiety symptoms (20 weeks’ follow-up)

O.2.3.3. Post-traumatic stress disorder

O.2.3.3.1. Mild learning disabilities
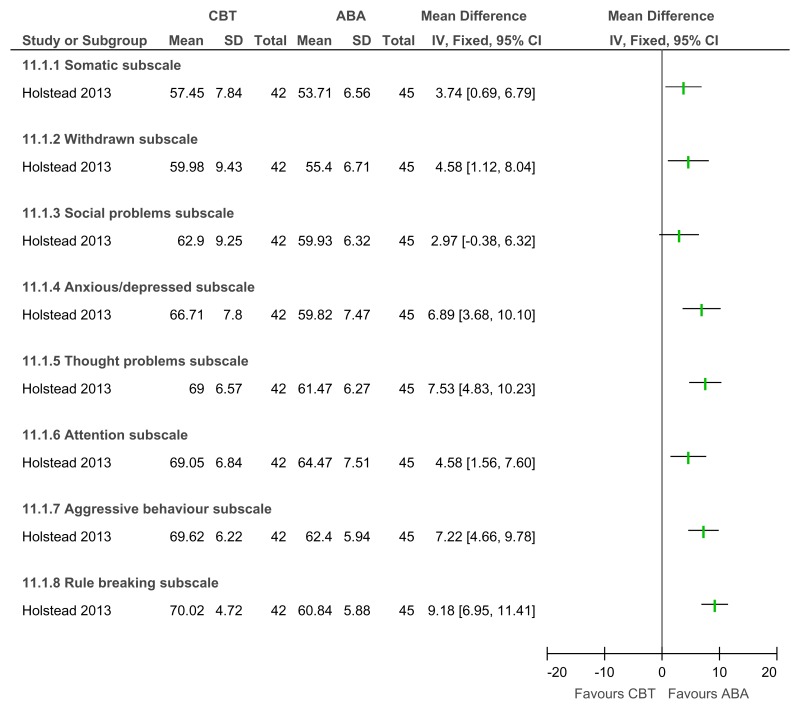
Figure 33. CBT versus applied behavioural analysis – mental health/problem behaviour/adaptive behaviour (teacher-rated Achenbach subscale); unclear follow-up.

Figure 33CBT versus applied behavioural analysis – mental health/problem behaviour/adaptive behaviour (teacher-rated Achenbach subscale); unclear follow-up

O.2.4. Depressive symptoms

O.2.4.1. Mild to moderate learning disabilities

Figure 34. CBT versus control – depressive symptoms (BDI; from 6 to 42 weeks).

Figure 34CBT versus control – depressive symptoms (BDI; from 6 to 42 weeks)

Figure 35. CBT versus control – depressive symptoms (various scales; from 12 to 46.7 weeks).

Figure 35CBT versus control – depressive symptoms (various scales; from 12 to 46.7 weeks)

Various scales used including BDI, GDS-LD, and depression subscale on Brief Symptom Inventory Source

Figure 36. CBT versus control – at least small improvement in depressive symptoms on BDI (RCT, 12 weeks).

Figure 36CBT versus control – at least small improvement in depressive symptoms on BDI (RCT, 12 weeks)

Figure 37. CBT versus control – problem behaviour on the SIB-R (controlled before-and-after; 23 weeks).

Figure 37CBT versus control – problem behaviour on the SIB-R (controlled before-and-after; 23 weeks)

Figure 38. CBT versus control – social skills (adaptive functioning on the Social Comparison Scale, RCT, 6–12 weeks).

Figure 38CBT versus control – social skills (adaptive functioning on the Social Comparison Scale, RCT, 6–12 weeks)

Figure 39. CBT versus control – social behaviours (adaptive functioning, controlled before-and-after study, 23 weeks).

Figure 39CBT versus control – social behaviours (adaptive functioning, controlled before-and-after study, 23 weeks)

Figure 40. CBT versus behavioural strategies only – depressive symptoms on BDI (38 weeks).

Figure 40CBT versus behavioural strategies only – depressive symptoms on BDI (38 weeks)

Figure 41. CBT versus behavioural strategies only – improvement in those with clinical depression at baseline (reduced score on BDI II at 38 weeks).

Figure 41CBT versus behavioural strategies only – improvement in those with clinical depression at baseline (reduced score on BDI II at 38 weeks)

Figure 42. CBT versus behavioural strategies only – recovery in those with clinical depression at baseline (score 13 or less on BDI II at 38 weeks).

Figure 42CBT versus behavioural strategies only – recovery in those with clinical depression at baseline (score 13 or less on BDI II at 38 weeks)

Figure 43. CBT versus cognitive strategies only – depressive symptoms (BDI, 38 weeks).

Figure 43CBT versus cognitive strategies only – depressive symptoms (BDI, 38 weeks)

Figure 44. CBT versus cognitive strategies only – improvement in those with clinical depression at baseline (reduced score on BDI II, 38 weeks).

Figure 44CBT versus cognitive strategies only – improvement in those with clinical depression at baseline (reduced score on BDI II, 38 weeks)

Figure 45. CBT versus cognitive strategies only – recovery in those with clinical depression at baseline (score 13 or less on BDI II, 38 weeks).

Figure 45CBT versus cognitive strategies only – recovery in those with clinical depression at baseline (score 13 or less on BDI II, 38 weeks)

O.2.5. Sexually inappropriate behaviour

Figure 46. Psychodynamic psychotherapy versus no treatment – recidivism.

Figure 46Psychodynamic psychotherapy versus no treatment – recidivism

O.3. Parent training interventions aimed at reducing and managing behaviour that challenges

Figure 47 was amended from the challenging behaviour guideline and has therefore been included in this appendix. However for all other forest plots relating to the effectiveness of parent training please refer to the appropriate appendix in the challenging behaviour guideline.

O.3.1. Parent training versus any control

Figure 47. Mental health (severity, various scales) – post-treatment.

Figure 47Mental health (severity, various scales) – post-treatment

Various scales included DBC-total score, CBCL – total score, Parent Symptom Questionnaire, SDQ – total score, Home Situations Questionnaire (severity), ECBI – problem subscale, 2 studies did not report a total score on the DBC so the disruptive behaviour score was used.

O.4. Pharmacological interventions for prevention and/or treatment

O.4.1. Attention deficit hyperactivity disorder in children and young people

Figure 48. Methylphenidate versus placebo – mental health (ADHD symptoms at 16 weeks measured with the Conners ADHD Index).

Figure 48Methylphenidate versus placebo – mental health (ADHD symptoms at 16 weeks measured with the Conners ADHD Index)

Figure 49. Methylphenidate versus placebo – mental health (hyperactivity at 16 weeks measured with the Conners hyperactivity scale).

Figure 49Methylphenidate versus placebo – mental health (hyperactivity at 16 weeks measured with the Conners hyperactivity scale)

Figure 50. Methylphenidate versus placebo – mental health (hyperactivity at 16 weeks measured with Aberrant Behavior Checklist).

Figure 50Methylphenidate versus placebo – mental health (hyperactivity at 16 weeks measured with Aberrant Behavior Checklist)

Figure 51. Methylphenidate versus placebo – mental health (‘improved’ or ‘better’ on Clinical Global Impressions scale at 16 weeks).

Figure 51Methylphenidate versus placebo – mental health (‘improved’ or ‘better’ on Clinical Global Impressions scale at 16 weeks)

Figure 52. Methylphenidate versus placebo – side effects (weight loss at 16 weeks in kg).

Figure 52Methylphenidate versus placebo – side effects (weight loss at 16 weeks in kg)

Figure 53. Methylphenidate versus placebo – side effects (trouble falling asleep at 16 weeks).

Figure 53Methylphenidate versus placebo – side effects (trouble falling asleep at 16 weeks)

Figure 54. Methylphenidate versus placebo – side effects (poor appetite at 16 weeks).

Figure 54Methylphenidate versus placebo – side effects (poor appetite at 16 weeks)

Figure 55. Methylphenidate versus placebo – side effects (looks sad/miserable at 16 weeks).

Figure 55Methylphenidate versus placebo – side effects (looks sad/miserable at 16 weeks)

Figure 56. Methylphenidate versus placebo – side effects (crying at 16 weeks).

Figure 56Methylphenidate versus placebo – side effects (crying at 16 weeks)

Figure 57. Methylphenidate versus placebo – side effects (looks anxious at 16 weeks).

Figure 57Methylphenidate versus placebo – side effects (looks anxious at 16 weeks)

Figure 58. Methylphenidate versus placebo – side effects (meaningless repetitive behaviour at 16 weeks).

Figure 58Methylphenidate versus placebo – side effects (meaningless repetitive behaviour at 16 weeks)

Figure 59. Methylphenidate versus placebo – side effects (talks less with other children at 16 weeks).

Figure 59Methylphenidate versus placebo – side effects (talks less with other children at 16 weeks)

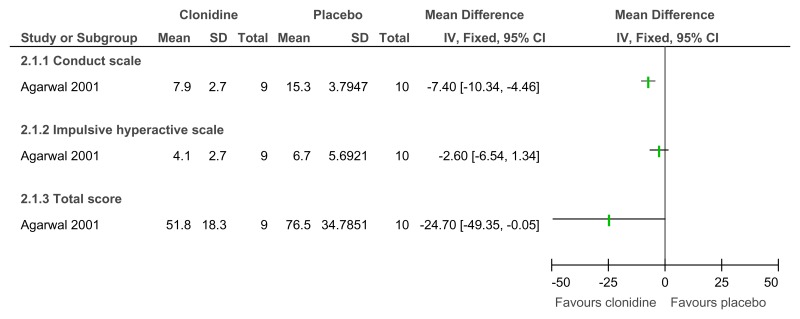
Figure 60. Clonidine versus placebo – mental health (ADHD symptoms on Conners Parent scale at 6 weeks).

Figure 60Clonidine versus placebo – mental health (ADHD symptoms on Conners Parent scale at 6 weeks)

Figure 61. Clonidine versus placebo – mental health (ADHD symptoms on Clinical Global Impression Scale at 6 weeks).

Figure 61Clonidine versus placebo – mental health (ADHD symptoms on Clinical Global Impression Scale at 6 weeks)

Figure 62. Clonidine versus placebo – mental health (much or very much improved ADHD symptoms on Clinical Global Impression Scale at 6 weeks).

Figure 62Clonidine versus placebo – mental health (much or very much improved ADHD symptoms on Clinical Global Impression Scale at 6 weeks)

Figure 63. Risperidone versus methylphenidate – ADHD symptoms (measured on SNAP-IV total score at 4 weeks).

Figure 63Risperidone versus methylphenidate – ADHD symptoms (measured on SNAP-IV total score at 4 weeks)

SMD estimated from F-value

Figure 64. Risperidone versus methylphenidate – side effects (measured on Barkley’s Side Effects Rating Scale at 4 weeks).

Figure 64Risperidone versus methylphenidate – side effects (measured on Barkley’s Side Effects Rating Scale at 4 weeks)

SMD estimated from F-value

Figure 65. Risperidone versus methylphenidate – side effects (vomiting at 4 weeks).

Figure 65Risperidone versus methylphenidate – side effects (vomiting at 4 weeks)

Figure 66. Risperidone versus methylphenidate – side effects (galactorrhoea at 4 weeks).

Figure 66Risperidone versus methylphenidate – side effects (galactorrhoea at 4 weeks)

O.4.2. Dementia

Figure 67. Donepezil versus placebo (prevention) – cognitive abilities (Severe Impairment Battery; 12 weeks).

Figure 67Donepezil versus placebo (prevention) – cognitive abilities (Severe Impairment Battery; 12 weeks)

Random-effects model used as significant unexplained heterogeneity

Figure 68. Donepezil versus placebo (prevention) – behavioural problems (various scales; 12 weeks).

Figure 68Donepezil versus placebo (prevention) – behavioural problems (various scales; 12 weeks)

Various scales used included Scales of Independent Behavior-Revised (SIB-R) and Vineland Adaptive Behaviour Scale

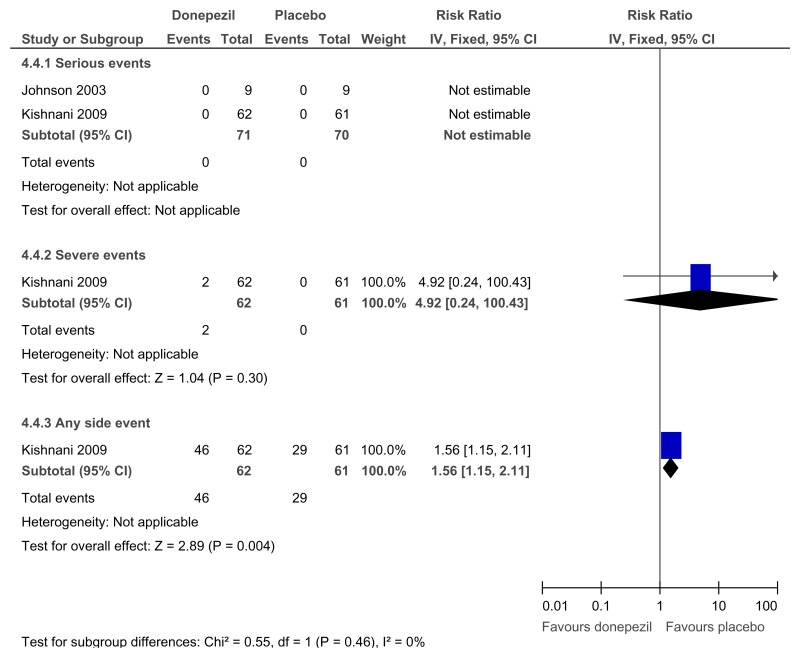
Figure 69. Donepezil versus placebo (prevention) – adverse events (12 weeks).

Figure 69Donepezil versus placebo (prevention) – adverse events (12 weeks)

Figure 70. Donepezil versus placebo (treatment) – cognitive abilities (Severe Impairment Battery; 24 weeks).

Figure 70Donepezil versus placebo (treatment) – cognitive abilities (Severe Impairment Battery; 24 weeks)

Figure 71. Donepezil versus placebo (treatment) – behavioural problems (24 weeks).

Figure 71Donepezil versus placebo (treatment) – behavioural problems (24 weeks)

Figure 72. Donepezil versus placebo (treatment) – global functioning (proportion with improved impression of quality of life; 24 weeks).

Figure 72Donepezil versus placebo (treatment) – global functioning (proportion with improved impression of quality of life; 24 weeks)

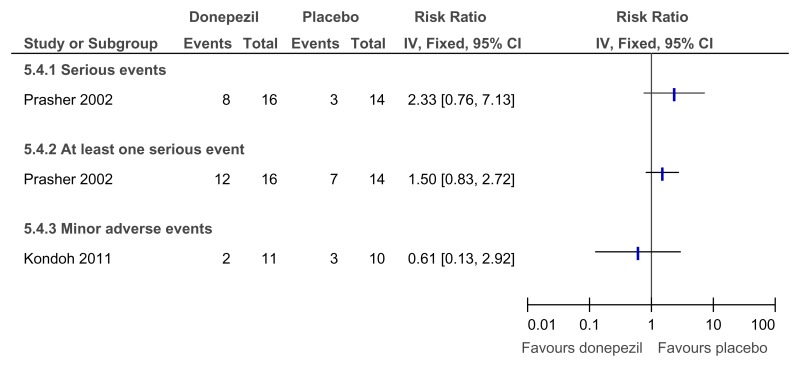
Figure 73. Donepezil versus placebo (treatment) – adverse events (24 weeks).

Figure 73Donepezil versus placebo (treatment) – adverse events (24 weeks)

Figure 74. Memantine versus placebo (prevention or treatment) – cognitive abilities (various scales, 16–52 weeks).

Figure 74Memantine versus placebo (prevention or treatment) – cognitive abilities (various scales, 16–52 weeks)

Figure 75. Memantine versus placebo (prevention or treatment) – behavioural problems (various scales, 16–52 weeks).

Figure 75Memantine versus placebo (prevention or treatment) – behavioural problems (various scales, 16–52 weeks)

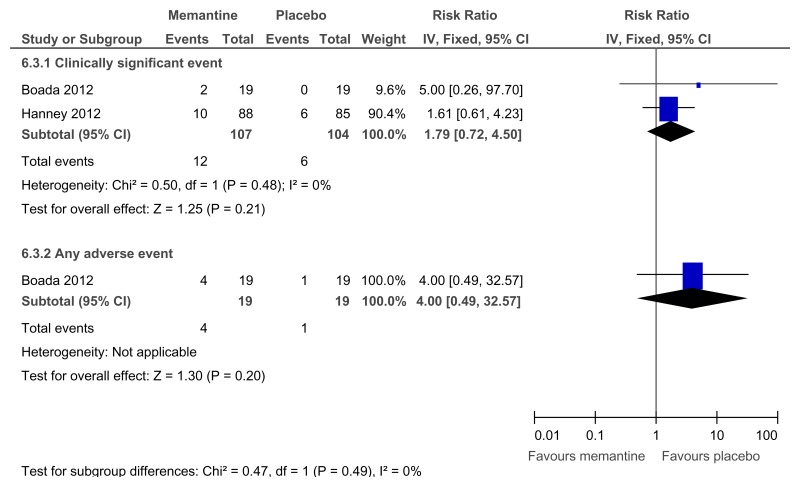
Figure 76. Memantine versus placebo (prevention or treatment) – adverse events (16–52 weeks).

Figure 76Memantine versus placebo (prevention or treatment) – adverse events (16–52 weeks)

Figure 77. Simvastin versus placebo (prevention or treatment) – cognitive abilities (NADIID battery; 52 weeks).

Figure 77Simvastin versus placebo (prevention or treatment) – cognitive abilities (NADIID battery; 52 weeks)

Figure 78. Simvastin versus placebo (prevention or treatment) – cognitive abilities (NADIID battery; 52 weeks, adjusted for baseline and stratification values).

Figure 78Simvastin versus placebo (prevention or treatment) – cognitive abilities (NADIID battery; 52 weeks, adjusted for baseline and stratification values)

Figure 79. Simvastin versus placebo (prevention or treatment) – adaptive functioning (52 weeks).

Figure 79Simvastin versus placebo (prevention or treatment) – adaptive functioning (52 weeks)

Figure 80. Simvastin versus placebo (prevention or treatment) – adaptive functioning (52 weeks, adjusted for baseline and stratification values).

Figure 80Simvastin versus placebo (prevention or treatment) – adaptive functioning (52 weeks, adjusted for baseline and stratification values)

O.5. Other interventions

O.5.1. Annual health checks

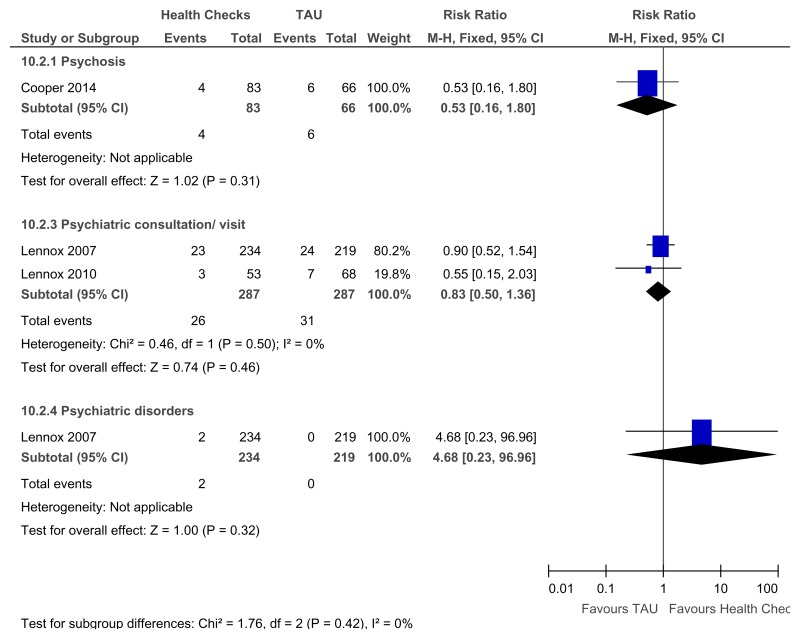
Figure 81. Annual health checks versus treatment as usual – Identification of mental health needs for all levels of learning disabilities (Mental health at 39 weeks).

Figure 81Annual health checks versus treatment as usual – Identification of mental health needs for all levels of learning disabilities (Mental health at 39 weeks)

Figure 82. Annual health checks versus treatment as usual – Newly detected health issues for all levels of learning disabilities (Quality of life at 39 to 52 weeks).

Figure 82Annual health checks versus treatment as usual – Newly detected health issues for all levels of learning disabilities (Quality of life at 39 to 52 weeks)

Overall OR reported rather than RR as one study only reported the OR only and the RR was not calculable

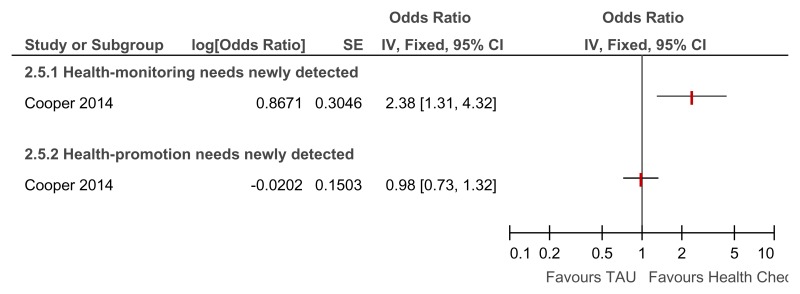
Figure 83. Annual health checks versus treatment as usual – Newly detected health monitoring and health promotion needs for all levels of learning disabilities (Quality of life at 39 weeks).

Figure 83Annual health checks versus treatment as usual – Newly detected health monitoring and health promotion needs for all levels of learning disabilities (Quality of life at 39 weeks)

Overall OR reported rather than RR as one study only reported the OR only and the RR was not calculable

Figure 84. Annual health checks versus treatment as usual – Obesity (Identification of health needs for all levels of learning disabilities; Quality of life at 39 to 52 weeks).

Figure 84Annual health checks versus treatment as usual – Obesity (Identification of health needs for all levels of learning disabilities; Quality of life at 39 to 52 weeks)

Random-effects model used because of unexplained heterogeneity.

O.5.2. Dietary interventions

O.5.2.1. ADHD

O.5.2.2. Unclear level of learning disabilities

Figure 85. L-acetylcarnitine versus placebo for the treatment of ADHD in children with Fragile X syndrome – ADHD symptoms (mental health; Conners Parents rating scale; 52 weeks).

Figure 85L-acetylcarnitine versus placebo for the treatment of ADHD in children with Fragile X syndrome – ADHD symptoms (mental health; Conners Parents rating scale; 52 weeks)

Figure 86. L-acetylcarnitine versus placebo for the treatment of ADHD in children with Fragile X syndrome – ADHD symptoms (mental health; Conners Teachers rating scale; 52 weeks).

Figure 86L-acetylcarnitine versus placebo for the treatment of ADHD in children with Fragile X syndrome – ADHD symptoms (mental health; Conners Teachers rating scale; 52 weeks)

Figure 87. L-acetylcarnitine versus placebo for the treatment of ADHD in children with Fragile X syndrome – adaptive functioning (VABS – full scale; 52 weeks).

Figure 87L-acetylcarnitine versus placebo for the treatment of ADHD in children with Fragile X syndrome – adaptive functioning (VABS – full scale; 52 weeks)

Figure 88. L-acetylcarnitine versus placebo for the treatment of ADHD in children with Fragile X syndrome – adaptive functioning (VABS – socialisation scale; 52 weeks).

Figure 88L-acetylcarnitine versus placebo for the treatment of ADHD in children with Fragile X syndrome – adaptive functioning (VABS – socialisation scale; 52 weeks)

O.5.2.3. Dementia

O.5.2.3.1. Mild to moderate learning disabilities
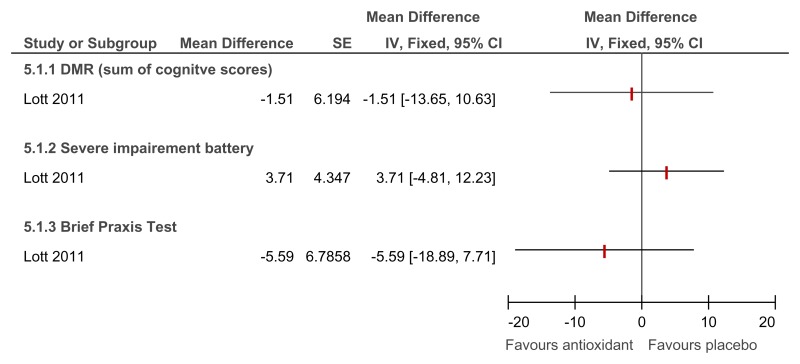
Figure 89. Antioxidant versus placebo for the treatment of dementia in people with Down’s syndrome – cognitive abilities (mental health; 2 year follow-up).

Figure 89Antioxidant versus placebo for the treatment of dementia in people with Down’s syndrome – cognitive abilities (mental health; 2 year follow-up)

Direction of effect not reported in study (only the mean difference in change scores) and author not contactable so the direction of effect was assumed. However, the paper reported that there was no significant difference between groups on these measures.

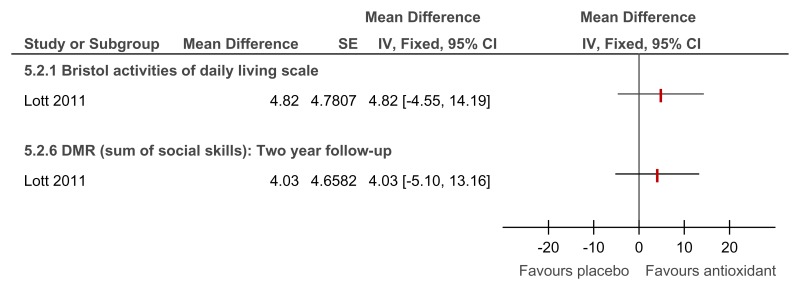
Figure 90. Antioxidant versus placebo for the treatment of dementia in people with Down’s syndrome – adaptive functioning (2 year follow-up).

Figure 90Antioxidant versus placebo for the treatment of dementia in people with Down’s syndrome – adaptive functioning (2 year follow-up)

Figure 91. Antioxidant versus placebo for the treatment of dementia in people with Down’s syndrome – Any serious adverse events (incapacitation and/or inability to sustain daily activities: 2 year follow-up).

Figure 91Antioxidant versus placebo for the treatment of dementia in people with Down’s syndrome – Any serious adverse events (incapacitation and/or inability to sustain daily activities: 2 year follow-up)

Assuming no events among missing data (intention-to-treat analysis).

O.5.3. Exercise interventions

O.5.3.1. Anxiety symptoms

O.5.3.1.1. Mild to moderate learning disabilities
Figure 92. Exercise versus painting control – Trait anxiety (self-report; TRAIT-A, 12 weeks).

Figure 92Exercise versus painting control – Trait anxiety (self-report; TRAIT-A, 12 weeks)

Figure 93. Exercise versus painting control – State anxiety (self-report; STATE-A, 12 weeks).

Figure 93Exercise versus painting control – State anxiety (self-report; STATE-A, 12 weeks)

Figure 94. Exercise versus painting control – Anxiety symptoms (self-report; Zung anxiety SAS-ID, 12 weeks).

Figure 94Exercise versus painting control – Anxiety symptoms (self-report; Zung anxiety SAS-ID, 12 weeks)

O.5.3.2. Depressive symptoms– mild to moderate learning disabilities

O.5.3.2.1. Mild to moderate learning disabilities
Figure 95. Exercise versus painting control – Depressive symptoms (Zung Self-Rating Depression Scale, 12 weeks).

Figure 95Exercise versus painting control – Depressive symptoms (Zung Self-Rating Depression Scale, 12 weeks)

Figure 96. Exercise + education versus no treatment – Depressive symptoms (Child Depression Inventory; 12 weeks).

Figure 96Exercise + education versus no treatment – Depressive symptoms (Child Depression Inventory; 12 weeks)

Figure 97. Exercise + education versus no treatment – Community participation and meaningful occupation (Community Integration Scale; 12 weeks).

Figure 97Exercise + education versus no treatment – Community participation and meaningful occupation (Community Integration Scale; 12 weeks)

Figure 98. Exercise + education versus no treatment – Quality of life (Life Satisfaction Scale; 12 weeks).

Figure 98Exercise + education versus no treatment – Quality of life (Life Satisfaction Scale; 12 weeks)

O.6. Organising health care services for people with intellectual disabilities

O.6.1. Innovative intensive support services model versus standard model of service delivery

Figure 99. Impact on maladaptive behaviour (AAMD scale).

Figure 99Impact on maladaptive behaviour (AAMD scale)

Figure 100. Impact on adaptive behaviour (AAMD scale).

Figure 100Impact on adaptive behaviour (AAMD scale)

Figure 101. Impact on maladaptive behaviour (Michigan Maladaptive Behaviour Scale).

Figure 101Impact on maladaptive behaviour (Michigan Maladaptive Behaviour Scale)

Figure 102. Effect on a move to more staff intensive day or residential programming.

Figure 102Effect on a move to more staff intensive day or residential programming

O.6.2. Assertive community treatment versus standard model

Figure 103. Global assessment of function (symptomatology) – follow-up.

Figure 103Global assessment of function (symptomatology) – follow-up

Figure 104. Global assessment of function (disability) – follow-up.

Figure 104Global assessment of function (disability) – follow-up

Figure 105. Carer uplift or burden – follow-up.

Figure 105Carer uplift or burden – follow-up

Figure 106. Quality of life – follow-up.

Figure 106Quality of life – follow-up

O.6.3. Specialist liaison worker model versus no liaison worker

Figure 107. Mental health (SDQ score) – follow-up.

Figure 107Mental health (SDQ score) – follow-up

SMD estimated from p-value

Figure 108. Carer quality of life (SF12-physical score; ANOVA) – follow-up.

Figure 108Carer quality of life (SF12-physical score; ANOVA) – follow-up

SMD estimated from p-value

Figure 109. Carer quality of life (SF12-mental health score) – follow-up.

Figure 109Carer quality of life (SF12-mental health score) – follow-up

SMD estimated from p-value

Figure 110. Carer mental health (GHQ30 score) – follow-up.

Figure 110Carer mental health (GHQ30 score) – follow-up

SMD estimated from p-value

Figure 111. Frequency of contact with services – follow-up.

Figure 111Frequency of contact with services – follow-up

SMD estimated from p-value

O.7. Interventions aimed at improving the health and well-being of carers of people with learning disabilities

Forest plots for carer outcomes from parent training are presented below. For all other forest plots relating to the effectiveness of interventions aimed at improving the health and well-being of carers of people with learning disabilities please refer to the appropriate appendix in the challenging behaviour guideline.
O.7.1. Carer outcomes from parent training

O.7.1.1. Individually delivered parent training

Figure 112. Individual parent training versus waitlist control – mental health measured by the DASS at end of treatment.

Figure 112Individual parent training versus waitlist control – mental health measured by the DASS at end of treatment

Figure 113. Individual parent training versus waitlist control – carer satisfaction measured by the PSOC at the end of treatment.

Figure 113Individual parent training versus waitlist control – carer satisfaction measured by the PSOC at the end of treatment

Figure 114. Individual parent training versus waitlist control – quality of life measured by the ADAS at the end of treatment.

Figure 114Individual parent training versus waitlist control – quality of life measured by the ADAS at the end of treatment

Figure 115. Individual parent training versus waitlist control – stress measured by the parenting scale at the end of treatment.

Figure 115Individual parent training versus waitlist control – stress measured by the parenting scale at the end of treatment

Figure 116. Individual parent training (standard) versus individual parent training (enhanced) – mental health measured by the DASS at 52-week follow-up.
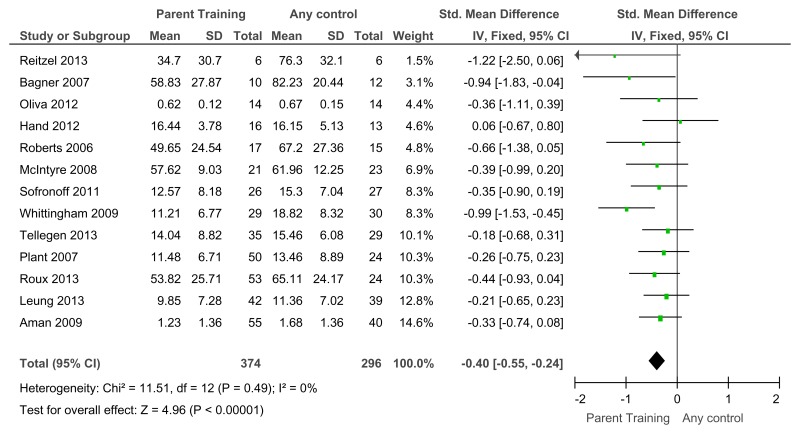
Figure 116Individual parent training (standard) versus individual parent training (enhanced) – mental health measured by the DASS at 52-week follow-up

Figure 117. Individual parent training (standard) versus individual parent training (enhanced) – quality of life measured by the ADAS at 52-week follow-up.

Figure 117Individual parent training (standard) versus individual parent training (enhanced) – quality of life measured by the ADAS at 52-week follow-up

Figure 118. Individual parent training (standard) versus individual parent training (enhanced) – carer satisfaction measured by the PSOC at 52-week follow-up.

Figure 118Individual parent training (standard) versus individual parent training (enhanced) – carer satisfaction measured by the PSOC at 52-week follow-up

Figure 119. Individual parent training (standard) versus individual parent training (enhanced) – stress measured by the parenting scale at 52-week follow-up.

Figure 119Individual parent training (standard) versus individual parent training (enhanced) – stress measured by the parenting scale at 52-week follow-up

O.7.1.2. Group parent training

Figure 120. Group parent training versus no treatment – carer satisfaction measured using the KPS-SF at the end of treatment.

Figure 120Group parent training versus no treatment – carer satisfaction measured using the KPS-SF at the end of treatment

Figure 121. Group parent training versus no treatment – stress measured using the parenting scale at the end of treatment.

Figure 121Group parent training versus no treatment – stress measured using the parenting scale at the end of treatment

Copyright © National Institute for Health and Care Excellence 2016.

All rights reserved. NICE copyright material can be downloaded for private research and study, and may be reproduced for educational and not-for-profit purposes. No reproduction by or for commercial organisations, or for commercial purposes, is allowed without the written permission of NICE.

Bookshelf ID: NBK401813