U.S. flag

An official website of the United States government

NCBI Bookshelf. A service of the National Library of Medicine, National Institutes of Health.

Wang Z, Pianosi P, Keogh K, et al. The Clinical Utility of Fractional Exhaled Nitric Oxide (FeNO) in Asthma Management [Internet]. Rockville (MD): Agency for Healthcare Research and Quality (US); 2017 Dec. (Comparative Effectiveness Reviews, No. 197.)

Cover of The Clinical Utility of Fractional Exhaled Nitric Oxide (FeNO) in Asthma Management

The Clinical Utility of Fractional Exhaled Nitric Oxide (FeNO) in Asthma Management [Internet].

Show details

Appendix DFigures

This figure shows the pooled sensitivity, specificity, and hierarchical summary receiver operating characteristic (HSROC) curve for diagnosis of asthma when fractional exhaled nitric oxide (FeNO) cutoff is less than 20 ppb. The x-axis shows specificity. The y-axis shows sensitivity. Each circle represents a study. The size of each circle is proportional to the weight of a study contributed to the pooled estimates. The solid line shows the HSROC curve. The square mark on the HSROC curve represents the pooled sensitivity and specificity. The area delimited by the dashed line is the 95% confidence interval (CI) for the pooled sensitivity and specificity. The area delimited by the dotted line represents the 95% prediction interval of the pooled sensitivity and specificity.

Figure D.1

Pooled sensitivity, specificity and HSROC curve for diagnosis of asthma when FeNO cutoff <=20 ppb.

This figure shows the pooled sensitivity, specificity, and hierarchical summary receiver operating characteristic (HSROC) curve for diagnosis of asthma when fractional exhaled nitric oxide (FeNO) cutoff is between 20 and 30 ppb. The x-axis shows specificity. The y-axis shows sensitivity. Each circle represents a study. The size of each circle is proportional to the weight of a study contributed to the pooled estimates. The solid line shows the HSROC curve. The square mark on the HSROC curve represents the pooled sensitivity and specificity. The area delimited by the dashed line is the 95% confidence interval (CI) for the pooled sensitivity and specificity. The area delimited by the dotted line represents the 95% prediction interval of the pooled sensitivity and specificity.

Figure D.2

Pooled sensitivity, specificity and HSROC curve for diagnosis of asthma when FeNO cutoff between 20 and 30 ppb.
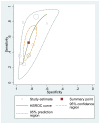
This figure shows the pooled sensitivity, specificity, and hierarchical summary receiver operating characteristic (HSROC) curve for diagnosis of asthma when fractional exhaled nitric oxide (FeNO) cutoff is between 30 and 40 ppb. The x-axis shows specificity. The y-axis shows sensitivity. Each circle represents a study. The size of each circle is proportional to the weight of a study contributed to the pooled estimates. The solid line shows the HSROC curve. The square mark on the HSROC curve represents the pooled sensitivity and specificity. The area delimited by the dashed line is the 95% confidence interval (CI) for the pooled sensitivity and specificity. The area delimited by the dotted line represents the 95% prediction interval of the pooled sensitivity and specificity.

Figure D.3

Pooled sensitivity, specificity and HSROC curve for diagnosis of asthma when FeNO cutoff between 30 and 40 ppb.
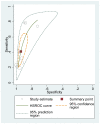
This figure shows the pooled sensitivity, specificity, and hierarchical summary receiver operating characteristic (HSROC) curve for diagnosis of asthma when fractional exhaled nitric oxide (FeNO) cutoff is larger than 40 ppb. The x-axis shows specificity. The y-axis shows sensitivity. Each circle represents a study. The size of each circle is proportional to the weight of a study contributed to the pooled estimates. The solid line shows the HSROC curve. The square mark on the HSROC curve represents the pooled sensitivity and specificity. The area delimited by the dashed line is the 95% confidence interval (CI) for the pooled sensitivity and specificity. The area delimited by the dotted line represents the 95% prediction interval of the pooled sensitivity and specificity.

Figure D.4

Pooled sensitivity, specificity and HSROC curve for diagnosis of asthma when FeNO cutoff larger than 40 ppb.

This figure is a forest plot comparing FeNO to other tests in guiding asthma treatments in children and adults. The pooled effect from 6 studies shows FeNO based treatment strategies were not significantly different from other strategies on Asthma Control Test results in children, adults, or overall.

Figure D.5

Asthma Control Test score – FeNO versus other tests in guiding asthma treatments in children and adults. Some estimates were extracted from 2 Cochrane systematic reviews because data were not reported in published trial reports.

This figure is a forest plot comparing FeNO to other tests in guiding asthma treatments in children and adults. The pooled effect from 11 studies shows FeNO based treatment strategies were not significantly different from other strategies on FEV1% findings in children, adults, or overall.

Figure D.6

FEV1% - FeNO versus other tests in guiding asthma treatments in children and adults. Some estimates were extracted from 2 Cochrane systematic reviews because data were not reported in published trial reports.

This figure is a forest plot comparing FeNO to other tests in guiding asthma treatments in children and adults. The pooled effect from 9 studies shows FeNO based treatment strategies were not significantly different from other strategies on number of hospitalizations in children, adults, or overall.

Figure D.7

Hospitalizations - FeNO versus other tests in guiding asthma treatments in children and adults. Some estimates were extracted from 2 Cochrane systematic reviews because data were not reported in published trial reports.

This figure is a forest plot comparing FeNO to other tests in guiding asthma treatments in children and adults. 2 studies reported quality of life in pediatric patients based on the Pediatric Asthma Caregiver’s Quality of Life Questionnaire (PACQLQ). 3 studies reported quality of life in adult patients based on the Asthma Quality of Life Questionnaire (AQLQ). The pooled result shows no significant difference between FeNO based treatment strategies and other strategies in children and adults.

Figure D.8

Quality of life - FeNO versus other tests in guiding asthma treatments in children and adults. AQLQ: Asthma Quality of Life Questionnaire; PACQLQS: Pediatric Asthma Caregiver Quality of Life Questionnaire with Standardized activities. Some estimates were (more...)

This figure is a forest plot comparing FeNO to other tests in guiding asthma treatments in children and adults. The pooled result shows no significant difference between FeNO based treatment strategies and other strategies in children or adults on the number of exacerbations requiring steroids. However, when we combine adults and children, FeNO based treatment strategies were associated with a significant reduction of exacerbations requiring steroids.

Figure D.9

Exacerbations requiring steroids - FeNO versus other tests in guiding asthma treatments in children and adults. Some estimates were extracted from 2 Cochrane systematic reviews because data were not reported in published trial reports.

This figure is a funnel plot for the diagnostic performance of FeNO testing with cutoffs less than 20 ppb. The figure shows asymmetry of the funnel plot and indicates potential publication bias.

Figure D.10

Funnel plot for FeNO cutoffs <20 ppb.

This figure is a funnel plot for the diagnostic performance of FeNO testing with cutoffs between 20 and 30 ppb. The figure shows symmetry of the funnel plot and indicates no potential publication bias.

Figure D.11

Funnel plot for FeNO cutoffs 20–30 ppb.

Views

  • PubReader
  • Print View
  • Cite this Page
  • PDF version of this title (5.2M)

Recent Activity

Your browsing activity is empty.

Activity recording is turned off.

Turn recording back on

See more...