Abstract
Background:
To meet the World Health Organization’s hepatitis C virus (HCV) elimination targets, countries must efficiently use resources to prevent and treat HCV infections, which requires data about who to target for treatment. This study estimates the prevention gains of treatment strategies across different countries, in terms of infections averted (IA).
Methods:
A dynamic, deterministic HCV transmission model was used, incorporating age, population growth and HCV progression, to simulate country-level HCV epidemics. UN datasets and country-specific data from systematic reviews were used to calibrate the model to each country’s HCV epidemic. The impact of treating 1000 infected individuals in 2017, either selected randomly (treat-all), or among people who inject drugs (PWID), people aged ≥30, or those with cirrhosis, was evaluated. The number of infections from 2017 to 2037 compared to if no treatment had occurred was estimated. Linear regression was used to identify associations between IA per treatment and demographic factors.
Results:
Eighty-three countries comprising 84% of the global population were included. The model estimates that globally there would be 0.57 (interquartile range [IQR]: 0.46–0.7) IA per randomly allocated treatment from 2017 to 2037, varying by region. Similar results are achieved treating those aged ≥30, and slightly less through treating people with cirrhosis. Globally, treating PWID is the most effective strategy, with 1.19 (IQR: 0.93–1.45) IA per treatment. This is reversed in countries with a high chronic HCV prevalence (>60%) among PWID. The IA per randomly allocated treatment is positively associated with a country’s growth rate, negatively associated with the population-attributable fraction of HCV transmission due to injecting drug use (IDU), and HCV prevalence among PWID.
Conclusion:
The largest number of HCV IA per randomly allocated treatment is likely in settings with high population growth, and where IDU contributes less to HCV transmission. Settings where the HCV epidemic is mostly PWID driven require high treatment rates to avert infection.
Research in context
Evidence before this study
A search for published original articles in PubMed was performed, unrestricted by date, with the terms “HCV”, “treatment”, “infections averted”. Previous modelling analyses have considered the prevention benefits of HCV treatment among people who inject drugs (PWID), men who have sex with men, those in prisons and the general population. Analyses of PWID HCV epidemics by Martin et al. in 2016 suggested that less prevention benefit would be achieved in settings with higher HCV prevalence in PWID. The analysis estimating the infections averted per treatment among PWID found that treatment strategies targeting disease stage had less prevention benefit.
Added value of this study
This study is the first to consider the prevention benefit of various treatment allocation strategies across different country settings. It is also the first to produce a global estimate for the infections averted per treatment, and the first showing which country-level factors affect the impact achieved. While other studies have compared treatment strategies among PWID, no study has undertaken similar analyses for general population epidemics, and so our analysis is a novel contribution to the literature.
Implications of all the available evidence
This study agrees with the previous evidence that more infections are averted through treatment strategies that are not restricted by disease stage, and also found that the most effective strategy, in terms of infections averted, was treating PWID. However, this depends on the chronic HCV prevalence among PWID in a setting, due to high reinfection rates. High population growth and epidemics less driven by injecting drug use are estimated to be where the greatest number of infections can be averted per treatment.
Introduction
Hepatitis C virus (HCV) is a bloodborne infection transmitted through injecting drug use (IDU), unsafe medical procedures and other community exposures (1). Globally, over 70 million people are infected with HCV (2), with close to 400 000 people dying annually due to HCV-related conditions (1).
New direct-acting antivirals (DAAs) treatments have made HCV an easily curable infection (3). Because of this, the World Health Organization (WHO) recently published a Global Health Strategy to eliminate HCV as a public health threat by 2030 (4), setting targets to reduce the incidence of new infections by 90%, and HCV-related mortality by 65%. Meeting these targets requires governments to decide how to efficiently allocate their resources for treating HCV infection, especially in countries where the price of DAAs is high or resources are low. To make these decisions, policy-makers require country-specific information on which groups of infected individuals to target for treatment to optimally use their finite budgets. Although analyses have considered who should be targeted to achieve most benefits in terms of morbidity gains (5), few countries understand which groups should be targeted to achieve the greatest prevention benefit.
The characteristics and burden of HCV epidemics vary widely between countries, with most of the HCV burden in high-income countries being due to injecting drug use (IDU) (6, 7), while medical and community risk factors are more important in many low- and middle-income countries (LMICs) (8, 9). These differences are likely to affect the prevention benefits of different treatment strategies. This study uses recent systematic review data on the prevalence of HCV among people who inject drugs (PWID) (10) and the general population (2) to model the different country-level epidemics of HCV across the world. These models are used to make country-specific estimations of the number of infections prevented from a single treatment episode, taking into account the potential for infected individuals to infect others. The number of infections prevented from treating specific groups of infected individuals are compared with randomly allocating treatment to any infected individual, specifically PWID, individuals with cirrhosis and those aged over 30 years.
Methods
Model description
A deterministic HCV transmission model was used to simulate the country-level HCV epidemic among the general population and PWID, incorporating population growth, age demographics and HCV progression. Three age groups were included: 0–19, 20–29, and ≥30 year olds, with newborns entering the youngest group and then ageing through the age classes. The population was stratified into individuals who had never injected drugs, current PWID and ex-injectors for the 20–29 and ≥30 years age groups, but not for the 0–19 years age group (supplementary ). Only young adults (20–29 year olds) are assumed to initiate injecting, with active PWID ceasing to inject at a fixed rate (from the 20–29 and ≥30 years age classes) to become ex-PWID. The same model structure was used for each country but was calibrated separately using country-specific data (described later).
All individuals enter the model susceptible to infection, with HCV transmission either occurring due to IDU among current PWID, generally at a high rate, or due to other medical and community risk factors among all individuals at a lower rate. Once infected, individuals either spontaneously clear their infection, and return to the susceptible class, or develop lifelong chronic infection. Chronically infected individuals gradually progress through different HCV-related disease stages (chronic, compensated and decompensated cirrhosis) with individuals in the cirrhotic and decompensated stages having increased HCV-related mortality. Individuals can also die at age-specific death rates or from drug-related mortality (among current PWID).
HCV treatment occurs at rates dependent on the stage of infection, age and whether a PWID or not. Following successful treatment (sustained virological response [SVR] or effective cure), no further disease progression occurs in the chronic infection state, but slower progression continues among those with compensated cirrhosis (supplementary ). Individuals who achieve SVR can be reinfected, whereas those that do not achieve SVR transition back to chronic infection.
The model is described further, including model equations, in the supplementary materials.
Model parameterization
The model was parameterized and calibrated using data from recent systematic reviews and United Nations (UN) datasets. Information on country-specific population sizes, age distributions and mortality rates came from UN datasets (11). Estimates for the prevalence of IDU (among adults) in each country and prevalence of HCV among PWID came from a recent systematic review (10), with data from other reviews being used when necessary (12–15). Similarly, data on the prevalence of HCV in the general population was taken from two recent systematic reviews (2, 16), and other reviews (13, 17). Only Egypt, France and the USA have “two robust surveys”(2), which were used to model the dynamics of their HCV epidemics in more detail (see the supplementary materials). For country-level HCV prevalence estimates (PWID and general population), the antibody prevalence for each country was taken from the reviews, which was then adjusted to give the prevalence of chronic infection. Data on the current duration of injecting was compiled for the systematic review by Degenhardt (2017), with regional estimates being used if country-level data were not available (10). These data were used to estimate the overall duration of injecting until cessation, with broad uncertainty bounds being applied (from half to double the main estimate) to account for uncertainty in how the current duration of injecting relates to the duration of injecting until cessation. lists country-level data used in the model. Other parameter estimates used in the model are given in supplementary , including further information about all data estimates. Importantly, all key parameters had uncertainty distributions associated with them, with their bounds generally obtained directly from studies. Where uncertainty bounds were not available for demographic inputs, such as population size, a ±10% uncertainty bound was applied.
Table 1Country-level sampled ranges for antibody prevalence of HCV among the general population and people who inject drugs (PWID), as well as the prevalence of injecting drug use and their duration of injecting drug use. Prevalence ranges are taken from the literature, and where not available ranges of ±25% are used. Ranges for injecting duration are taken as 50% and 200% of the estimate. The source of the data is listed below the table
View in own window
| Country | Prevalence | Duration of injecting drug use in years7 |
|---|
| Anti-HCV among general population (%) | Anti-HCV among PWID (%) | % of adults that are injecting drug users |
|---|
| Afghanistan | 1.1 (0.4, 1.9)1 | 35.3 (24.3, 47.2)7 | 0.4 (0.14, 0.78)7 | 6.4 (3.2, 12.8) |
| Albania | 1.5 (1.1, 1.9)2 | 34 (27.4, 40.6)7 | 0.42 (0.38, 0.46)9 | 12.4 (6.2, 24.8) |
| Argentina | 1.5 (0.3, 2)1 | 54.6 (41, 68.3)7 | 0.29 (0.289, 0.3)7 | 10.5 (5.25, 21) |
| Armenia | 4 (3, 5)2 | 40.6 (25.9, 56.2)7 | 0.62 (0.41, 1.35)7 | 12.7 (6.35, 25.4) |
| Australia | 1.3 (1.2, 1.9)1 | 53.5 (52.5, 54.5)7 | 0.6 (0.43, 0.76)7 | 16.2 (8.1, 32.4) |
| Austria | 0.5 (0.1, 0.7)1 | 60.3 (53.7, 66.8)7 | 0.32 (0.22, 0.42)7 | 12.4 (6.2, 24.8) |
| Azerbaijan | 3.7 (2.8, 4.6)1 | 64.4 (49.3, 78.2)7 | 0.5 (0.05, 1.31)7 | 12.7 (6.35, 25.4) |
| Bangladesh | 1.3 (0.2, 2.2)3 | 29.4 (18.2, 41.9)7 | 0.07 (0.06, 0.071)7 | 5.5 (2.75, 11) |
| Belarus | 1.3 (0.9, 2.9)3 | 55.7 (40.3, 70.6)7 | 0.59 (0.22, 0.96)7 | 10.9 (5.45, 21.8) |
| Belgium | 0.9 (0.12, 1.1)1 | 59.3 (47.1, 70.9)7 | 0.35 (0.24, 0.49)7 | 12.4 (6.2, 24.8) |
| Bosnia and Herzegovina | 1.5 (1.1, 1.9)2 | 39.4 (27.9, 51.4)7 | 0.17 (0.13, 0.22)9 | 12.7 (6.35, 25.4) |
| Brazil | 1.4 (1.1, 1.6)1 | 63.9 (47.9, 79.9)7 | 0.67 (0.5, 0.84)7 | 10.5 (5.25, 21) |
| Bulgaria | 1.5 (0.7, 2.4)1 | 68.8 (64.5, 72.9)7 | 0.38 (0.3, 0.45)7 | 12.7 (6.35, 25.4) |
| Canada | 1 (0.6, 1.3)1 | 65.5 (60.5, 70.5)7 | 1.22 (1.04, 1.4)7 | 14 (7, 28) |
| China | 1.2 (0.9, 1.5)1 | 63.2 (62.8, 63.6)7 | 0.25 (0.19, 0.31)7 | 7.2 (3.6, 14.4) |
| Croatia | 0.9 (0.5, 1.4)1 | 33.3 (27.8, 39.1)7 | 0.04 (0.03, 0.06)7 | 7.3 (3.65, 14.6) |
| Cyprus | 0.9 (0.5, 1.9)3 | 49.7 (44.5, 55)7 | 0.11 (0.03, 0.25)7 | 9 (4.5, 18) |
| Czech Republic | 0.6 (0.2, 0.7)1 | 19 (15, 23.4)7 | 0.64 (0.61, 0.67)7 | 12.7 (6.35, 25.4) |
| Denmark | 0.6 (0.5, 0.7)1 | 43 (36, 49)7 | 0.45 (0.35, 0.52)7 | 18 (9, 36) |
| Egypt | 10 (9.5, 10.5)4 | 49.4 (35.8, 63)7 | 0.17 (0.15, 0.19)10 | 7.8 (3.9, 15.6) |
| Estonia | 2 (1.5, 2)1 | 85.5 (62.1, 99.4)7 | 0.94 (0.69, 1.73)7 | 9.5 (4.75, 19) |
| Finland | 0.5 (0.4, 0.6)1 | 73.7 (70.1, 77.3)7 | 0.46 (0.41, 0.67)7 | 14 (7, 28) |
| France | 0.8 (0.7, 1.1)5 | 62.2 (59.5, 64.9)7 | 0.32 (0.29, 0.35)11 | 14 (7, 28) |
| Georgia | 7.5 (5.6, 9.4)1 | 69.1 (57, 80)7 | 4.19 (0.48, 7.9)7 | 16.2 (8.1, 32.4) |
| Germany | 0.6 (0.3, 0.9)1 | 62.5 (55.7, 69)7 | 0.27 (0.08, 0.55)7 | 13.5 (6.75, 27) |
| Ghana | 2.1 (1.2, 5.5)1 | 40.1 (30.1, 60.1)7 | 0.05 (0.04, 0.06)12 | 10 (5, 20) |
| Greece | 1.8 (0.5, 2.6)1 | 65.5 (60.5, 70.4)7 | 0.07 (0.06, 0.09)7 | 11.7 (5.85, 23.4) |
| Hungary | 0.7 (0.4, 2.7)1 | 46.3 (30.7, 62.3)7 | 0.06 (0.03, 0.08)7 | 10 (5, 20) |
| Iceland | 0.4 (0.3, 0.5)1 | 63 (47.3, 78.8)7 | 0.24 (0.18, 0.3)9 | 10 (5, 20) |
| India | 0.8 (0.5, 1.5)1 | 39.5 (34.9, 44.2)7 | 0.02 (0.01, 0.03)7 | 6.5 (3.25, 13) |
| Indonesia | 0.8 (0.1, 1.7)1 | 89.2 (85.8, 92.6)7 | 0.11 (0.09, 0.13)7 | 6.5 (3.25, 13) |
| Iran (Islamic Republic of) | 0.5 (0.2, 1)1 | 43.8 (28.1, 60.1)7 | 0.28 (0.19, 0.37)7 | 8.3 (4.15, 16.6) |
| Ireland | 0.7 (0.7, 1.6)1 | 74.6 (72.3, 76.9)7 | 0.27 (0.2, 0.33)7 | 12.4 (6.2, 24.8) |
| Israel | 2 (0.9, 2.1)1 | 42 (31.9, 52)7 | 0.41 (0.31, 0.52)9 | 7.8 (3.9, 15.6) |
| Italy | 2.4 (1.6, 7.3)1 | 58 (52.8, 63.2)7 | 0.83 (0.62, 1.04)7 | 12.4 (6.2, 24.8) |
| Japan | 1 (0.5, 2.2)1 | 64.8 (55, 74.5)7 | 0.47 (0.35, 0.59)7 | 7.9 (3.95, 15.8) |
| Kazakhstan | 3.2 (1.3, 4)1 | 58.8 (44.1, 73.5)7 | 0.96 (0.72, 1.2)7 | 5 (2.5, 10) |
| Kenya | 0.8 (0.2, 1)1 | 16.4 (10.5, 22.3)7 | 0.19 (0.05, 0.42)7 | 5.3 (2.65, 10.6) |
| Kyrgyzstan | 2.5 (1.9, 3.1)3 | 45.6 (42.4, 48.9)7 | 0.74 (0.555, 0.925)7 | 8.2 (4.1, 16.4) |
| Latvia | 2.4 (1.7, 3.3)1 | 74.6 (67.5, 81.1)7 | 0.92 (0.73, 1.17)7 | 9.1 (4.55, 18.2) |
| Libya | 1.2 (1.1, 1.3)1 | 94.2 (90.8, 96.7)7 | 0.05 (0.04, 0.06)7 | 7.8 (3.9, 15.6) |
| Lithuania | 2 (1.2, 2.7)1 | 52.5 (0, 100)7 | 0.22 (0.165, 0.275)7 | 10 (5, 20) |
| Luxembourg | 1.3 (1, 1.7)1 | 81.3 (71.4, 91.2)7 | 0.57 (0.45, 0.69)7 | 12.4 (6.2, 24.8) |
| Malaysia | 1.9 (0.3, 7.7)1 | 67.1 (63.1, 71.1)7 | 1.33 (1.11, 1.56)7 | 12.6 (6.3, 25.2) |
| Maldives | 1 (0.8, 1.3)2 | 0.9 (0.1, 2.4)7 | 0.6 (0.03, 1.68)7 | 6.4 (3.2, 12.8) |
| Malta | 0.4 (0.3, 0.6)1 | 24.4 (12.4, 38.7)7 | 0.26 (0.2, 0.33)9 | 12.4 (6.2, 24.8) |
| Mauritius | 2.1 (1.6, 2.6)2 | 96.6 (95, 97.9)7 | 0.78 (0.39, 1.54)7 | 17 (8.5, 34) |
| Mexico | 1.4 (1.1, 1.6)1 | 97.4 (92.8, 99.9)7 | 0.18 (0.12, 0.25)7 | 14 (7, 28) |
| Montenegro | 1.5 (1.1, 1.9)2 | 41 (18.6, 65.3)7 | 0.4 (0.3, 0.5)9 | 12.4 (6.2, 24.8) |
| Morocco | 1.2 (1.1, 1.9)1 | 57.8 (33, 80.9)7 | 0.17 (0.04, 0.36)7 | 8.5 (4.25, 17) |
| Mozambique | 3.2 (2.4, 4)2 | 69.9 (53.5, 84.2)7 | 0.15 (0.04, 0.33)7 | 7.8 (3.9, 15.6) |
| Myanmar | 1.7 (1, 2.7)3 | 34.6 (12.1, 60.8)7 | 0.48 (0.32, 0.65)7 | 4.5 (2.25, 9) |
| Nepal | 0.6 (0.5, 0.8)2 | 43.8 (30.7, 57.4)7 | 0.2 (0.19, 0.21)7 | 5.6 (2.8, 11.2) |
| Netherlands | 0.2 (0.1, 0.4)1 | 58.7 (54.5, 63)7 | 0.03 (0.02, 0.04)7 | 16 (8, 32) |
| New Zealand | 1.4 (0.8, 2.2)1 | 72.1 (63.2, 80.2)7 | 0.73 (0.49, 0.97)7 | 16.2 (8.1, 32.4) |
| Nigeria | 2.2 (2.1, 2.5)1 | 7.7 (3.5, 12.7)7 | 0.35 (0.26, 0.44)12 | 8 (4, 16) |
| Norway | 0.6 (0.5, 0.7)1 | 64.7 (60.2, 69)7 | 0.24 (0.21, 0.29)7 | 14.1 (7.05, 28.2) |
| Pakistan | 4.8 (4.7, 5.1)1 | 35.9 (0, 100)7 | 0.37 (0.32, 0.42)7 | 6.4 (3.2, 12.8) |
| Philippines | 0.9 (0.3, 2)1 | 28.3 (0, 75.1)7 | 0.04 (0.03, 0.05)7 | 7.9 (3.95, 15.8) |
| Poland | 0.9 (0.6, 1.1)1 | 58.7 (49, 69)7 | 0.27 (0.2, 0.34)9 | 12.7 (6.35, 25.4) |
| Portugal | 1.5 (0.5, 2.9)1 | 88.5 (80.5, 94.7)7 | 0.22 (0.19, 0.25)7 | 12.4 (6.2, 24.8) |
| Republic of Moldova | 4.5 (2.3, 4.5)3 | 50 (33.9, 66)7 | 0.22 (0, 0.94)7 | 12.7 (6.35, 25.4) |
| Romania | 3.2 (2.9, 3.6)1 | 83.5 (80.1, 86.6)7 | 0.62 (0.46, 0.84)7 | 9.4 (4.7, 18.8) |
| Russian Federation | 4.1 (1.2, 5.6)1 | 70.1 (60.1, 79.3)7 | 1.78 (1.34, 2.23)7 | 7.7 (3.85, 15.4) |
| Senegal | 3 (2.3, 3.8)2 | 39.3 (31.2, 47.4)7 | 0.08 (0.06, 0.1)12 | 7.8 (3.9, 15.6) |
| Serbia | 0.5 (0.4, 0.6)2 | 18.2 (6.2, 34.1)7 | 0.49 (0.41, 0.58)7 | 12.4 (6.2, 24.8) |
| Seychelles | 0.3 (0.3, 0.4)2 | 53.5 (42.9, 64.1)7 | 2.3 (1.54, 3.43)7 | 7.8 (3.9, 15.6) |
| Slovakia | 1.4 (0.9, 2)1 | 60 (14.6, 97.7)7 | 0.49 (0.35, 0.89)7 | 12.7 (6.35, 25.4) |
| Slovenia | 0.4 (0.3, 0.5)1 | 30.7 (26.7, 34.9)7 | 0.42 (0.3, 0.55)7 | 12.4 (6.2, 24.8) |
| Spain | 1.5 (0.4, 2.6)1 | 72.6 (71.2, 74.1)7 | 0.03 (0.02, 0.04)7 | 11.2 (5.6, 22.4) |
| Sweden | 0.6 (0.5, 0.7)1 | 81.7 (79.6, 83.6)7 | 0.13 (0.03, 0.62)7 | 18.5 (9.25, 37) |
| Switzerland | 1.6 (0.8, 1.8)1 | 75 (70.1, 79.9)7 | 0.24 (0.19, 0.29)7 | 12.4 (6.2, 24.8) |
| Tajikistan | 3.1 (1.1, 6.7)3 | 61.3 (57, 65.6)7 | 0.45 (0.34, 0.56)7 | 4.6 (2.3, 9.2) |
| United Republic of Tanzania | 3.2 (2.4, 4)2 | 27.7 (22.4, 33.5)7 | 1.28 (0.83, 1.83)7 | 6.4 (3.2, 12.8) |
| Thailand | 0.9 (0.7, 1.2)1 | 88.5 (83.6, 93.4)7 | 0.12 (0.05, 0.21)7 | 7.9 (3.95, 15.8) |
| Turkey | 1 (0.6, 2.1)1 | 28.9 (21.7, 36.1)8 | 0.42 (0.31, 0.52)9 | 7.8 (3.9, 15.6) |
| Turkmenistan | 4 (3, 5)2 | 44.4 (41.2, 47.3)7 | 0.4 (0.3, 0.5)9 | 6.8 (3.4, 13.6) |
| Ukraine | 3.6 (0.9, 4.5)3 | 55.9 (54.9, 56.9)7 | 0.67 (0.32, 1.4)7 | 12.7 (6.35, 25.4) |
| United Kingdom | 0.5 (0.4, 0.8)1 | 50.5 (41.4, 50.6)8 | 0.39 (0.38, 0.42)11 | 12.4 (6.2, 24.8) |
| Uruguay | 1 (0.8, 1.3)2 | 21.9 (16.4, 27.4)7 | 0.3 (0.1, 0.87)7 | 10.5 (5.25, 21) |
| USA | 1.3 (1.2, 1.5)6 | 52.5 (36, 68.7)7 | 1.04 (0.57, 1.88)7 | 16.4 (8.2, 32.8) |
| Uzbekistan | 13.1 (6.4, 31.1)1 | 51.7 (38.8, 64.6)7 | 0.47 (0.35, 0.59)7 | 6.8 (3.4, 13.6) |
| Viet Nam | 1.5 (1.2, 2)1 | 58.9 (44.7, 72.4)7 | 0.25 (0.19, 0.31)7 | 6.4 (3.2, 12.8) |
- 1
Blach (Polaris HCV). Global prevalence and genotype distribution of hepatitis C virus infection in 2015: a modelling study. 2017.
- 2
Lavanchy. Evolving epidemiology of hepatitis C virus. 2011.
- 3
Gower et al. Global epidemiology and genotype distribution of the hepatitis C virus infection. 2014.
- 4
Kandeel. The prevalence of hepatitis C virus infection in Egypt 2015.
- 5
Meffre et al. Prevalence of hepatitis B and hepatitis C virus infections in France in 2004.
- 6
Denniston et al. Chronic hepatitis C virus infection in the United States, National Health and Nutrition Examination Survey 2003 to 2010.
- 7
Degenhardt et al. Global prevalence and genotype distribution of hepatitis C virus infection in 2015: a modelling study. 2017.
- 8
Nelson et al. Global epidemiology of hepatitis B and hepatitis C in people who inject drugs: results of systematic reviews. 2011.
- 9
Hope et al. Prevalence and estimation of hepatitis B and C infections in the WHO European Region: a review of data focusing on the countries outside the European Union and the European Free Trade Association. 2014.
- 10
Joint United Nations Programme on HIV/AIDS (UNAIDS) and AIDS Project Management Group. Recommendation for interventions addressing IDU and related HIV infections in Egypt. 2007.
- 11
Mathers et al. Global epidemiology of injecting drug use and HIV among people who inject drugs: a systematic review. 2008.
- 12
Reid. Injection drug use, unsafe medical injections, and HIV in Africa: a systematic review. 2009.
Model calibration
The model was calibrated to 83 countries where data were available on the number of PWID, and HCV prevalence among PWID and the general population. A four-step calibration method, using different submodels, was used to calibrate the overall model for each country, from 1985 onwards. For each step, we randomly sampled various required model parameters and the calibration data from their uncertainty bounds, and then estimated other unknown model parameters through fitting the submodel to the calibration data using the Matlab ODE45 algorithm. Samples were generated until 50 full model fits were produced for each country. However, because it was not always possible to fit the submodel to the sampled calibration data with the sampled parameters, some runs were rejected. In brief, the calibration process firstly fit a population growth submodel to calculate country-specific population growth rates. This model was then adapted to include age demographics to estimate age-specific death rates. Injecting drug use was then added to the model to estimate initiation rates into IDU. Lastly, these fitted parameters were then used in the full model to estimate HCV transmission rates for PWID and the general population to fit to available prevalence data for these groups for a particular time point. However, due to uncertainty in the temporal dynamics of the HCV epidemic in each country (except France, Egypt and the USA where multiple surveys have been undertaken), the seeded HCV prevalence in the general population and among PWID in 1985 was varied between 50% and 150% of its level in the survey year, similar to the yearly change observed in the USA between their two surveys.
Further methodological detail on the calibration methods, including the model equations for each submodel, are given in the supplementary materials.
Model analyses
To investigate the number of HCV infections averted (IA) per treatment over 13 and 20 years from 2017, the full model fits for each country were first run through to 2037 with no treatments – the counterfactual projection, to estimate the number of new infections that occur from 2017 to 2037. The same model fits for each country were then run with 1000 individuals being treated in 2017, and the number of new infections over the same time period was compared to the counterfactual projections to estimate the IA and IA per treatment by dividing by 1000. Scenarios assumed the 1000 treated individuals were either selected randomly from all the infected population, or selected from just the infected PWID population, the cirrhotic infected population, or the infected population over 30 years of age. For each scenario, regional and global estimates of the IA per treatment were produced by weighting the country-level estimates by that country’s relative burden of HCV in comparison to the regional and global burdens.
Multivariable regression models were used to investigate which country-level characteristics (predicted population growth from 2015 to 2040, the population-attributable fraction (PAF) of IDU to HCV transmission, prevalence of IDU among adults in the country, average duration of IDU, HCV prevalence among PWID and the general population) are associated with the number of IA per randomly allocated treatment and per treatment for infected PWID. The PAF of IDU to HCV transmission was estimated as the percentage of new HCV infections that would be prevented from 2017 to 2037 if the transmission risk due to IDU was set to zero over this time period.
To estimate the effect of the temporal dynamics of the HCV epidemic on the number of IA per treatment, a second multivariable regression model was used analysing each of the 20 runs per country and treating country as a random effect. The same variables were included as above, as well as the yearly percentage change in the HCV prevalence in the general population between 2037 and the year when there was a general population HCV prevalence estimate.
Results
For 82/83 countries, the model ran successfully; Seychelles was the exception as the estimated burden of HCV among the general population was lower than the prevalence burden due to current PWID. The modelling covered countries making up 84% of the worldwide population, see supplementary . The model predicts that 74.4 million people will become chronically infected with HCV from 2017 to 2037. Supplementary presents some example model runs.
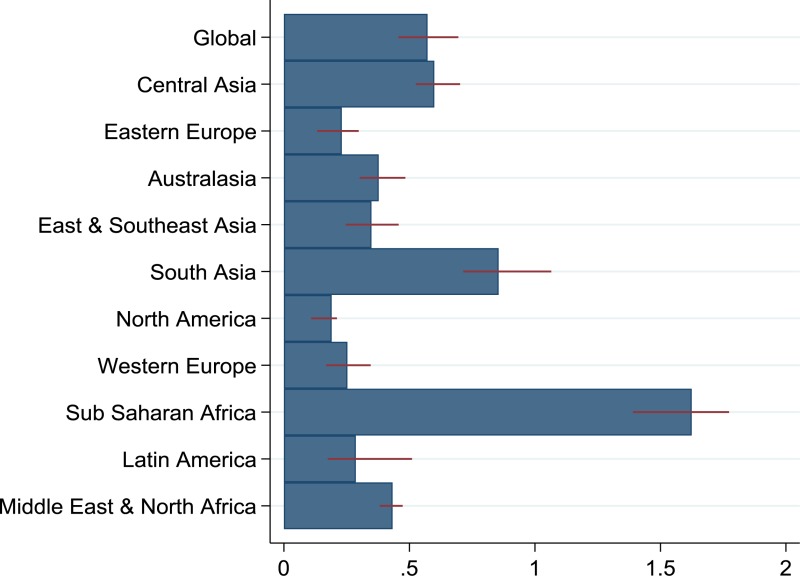
Globally, the model estimates 0.57 (interquartile range [IQR]: 0.46, 0.7) IA per treatment over the next 20 years from treating people randomly, although this number varies widely across regions (). The region with the lowest IA per randomly allocated treatment is North America with 0.19 (IQR: 0.11, 0.21), while sub-Saharan Africa has the highest, with 1.62 (IQR: 1.39, 1.77). There is substantial variation between countries, even within regions, as shown in . The average IA per randomly allocated treatment over the next 20 years is 0.22 (IQR: 0.14, 0.28) for World Bank high-income countries, and 0.62 (IQR: 0.50, 0.75) for LMICs.
Table 2The number of chronic hepatitis C virus infections averted per treatment over 20 years (2017–2037) for the different treatment allocation scenarios, for each country, region and globally, with interquartile ranges
View in own window
| Country | Chronic hepatitis C virus infections averted per treatment for different allocation strategies |
|---|
| Random allocation | Just PWID* | Just cirrhotic individuals | Just individuals aged ≥30 years |
|---|
| Global | 0.57 (0.46, 0.7) | 1.19 (0.93, 1.45) | 0.44 (0.35, 0.55) | 0.56 (0.45, 0.68) |
| Central Asia | 0.6 (0.53, 0.7) | 1.06 (0.88, 1.21) | 0.46 (0.4, 0.55) | 0.57 (0.5, 0.67) |
| Kazakhstan | 0.25 (0.18, 0.36) | 0.61 (0.51, 0.79) | 0.18 (0.12, 0.25) | 0.23 (0.15, 0.32) |
| Kyrgyzstan | 0.58 (0.55, 0.72) | 1.58 (1.43, 1.69) | 0.43 (0.39, 0.52) | 0.53 (0.49, 0.64) |
| Tajikistan | 0.82 (0.7, 0.98) | 1.24 (1.07, 1.4) | 0.64 (0.52, 0.76) | 0.75 (0.64, 0.92) |
| Turkmenistan | 0.85 (0.68, 0.99) | 1.94 (1.84, 2.12) | 0.65 (0.5, 0.77) | 0.81 (0.63, 0.94) |
| Uzbekistan | 0.62 (0.56, 0.72) | 1.05 (0.84, 1.19) | 0.48 (0.42, 0.57) | 0.6 (0.53, 0.7) |
| Eastern Europe | 0.23 (0.13, 0.3) | −0.02 (−0.11, 0.12) | 0.19 (0.11, 0.24) | 0.24 (0.14, 0.3) |
| Armenia | 0.38 (0.31, 0.44) | 0.77 (0.58, 1.15) | 0.28 (0.22, 0.33) | 0.36 (0.29, 0.42) |
| Azerbaijan | 0.65 (0.55, 0.89) | 0.29 (0.1, 0.42) | 0.52 (0.43, 0.69) | 0.64 (0.55, 0.89) |
| Belarus | 0.33 (0.28, 0.42) | 0.3 (0.14, 0.39) | 0.25 (0.22, 0.32) | 0.32 (0.27, 0.41) |
| Bosnia and Herzegovina | 0.29 (0.17, 0.39) | 0.42 (0.29, 0.58) | 0.21 (0.13, 0.29) | 0.28 (0.16, 0.38) |
| Bulgaria | 0.16 (0.08, 0.25) | −0.18 (−0.3, −0.11) | 0.15 (0.08, 0.21) | 0.18 (0.1, 0.25) |
| Czech Republic | 0.49 (0.4, 0.63) | 1.03 (0.79, 1.45) | 0.29 (0.25, 0.39) | 0.44 (0.37, 0.56) |
| Estonia | −0.09 (−0.15, −0.02) | −0.31 (−0.39, −0.23) | −0.05 (−0.1, −0.01) | −0.05 (−0.11, 0) |
| Georgia | 0.16 (0.13, 0.21) | −0.02 (−0.16, 0.08) | 0.13 (0.11, 0.18) | 0.16 (0.14, 0.21) |
| Hungary | 0.37 (0.29, 0.51) | 0.8 (0.57, 0.97) | 0.29 (0.23, 0.42) | 0.37 (0.28, 0.49) |
| Latvia | 0.14 (0.06, 0.18) | −0.26 (−0.31, −0.19) | 0.11 (0.06, 0.16) | 0.15 (0.08, 0.2) |
| Lithuania | 0.22 (0.17, 0.29) | 0.25 (0.02, 0.51) | 0.17 (0.13, 0.22) | 0.21 (0.17, 0.28) |
| Poland | 0.22 (0.17, 0.33) | −0.31 (−0.37, −0.23) | 0.19 (0.15, 0.27) | 0.24 (0.19, 0.35) |
| Republic of Moldova | 0.47 (0.36, 0.55) | 0.63 (0.47, 1.01) | 0.36 (0.28, 0.44) | 0.45 (0.34, 0.53) |
| Romania | 0.17 (0.13, 0.3) | −0.29 (−0.34, −0.22) | 0.15 (0.11, 0.26) | 0.19 (0.14, 0.32) |
| Russian Federation | 0.19 (0.06, 0.24) | −0.12 (−0.17, 0.02) | 0.17 (0.05, 0.19) | 0.21 (0.06, 0.25) |
| Slovakia | 0.24 (0.17, 0.37) | −0.14 (−0.33, 0.06) | 0.2 (0.15, 0.29) | 0.27 (0.18, 0.37) |
| Ukraine | 0.26 (0.24, 0.34) | 0.17 (0.03, 0.36) | 0.21 (0.19, 0.26) | 0.26 (0.24, 0.33) |
| Australasia | 0.38 (0.3, 0.48) | 0.71 (0.64, 0.75) | 0.28 (0.22, 0.36) | 0.36 (0.29, 0.47) |
| Australia | 0.4 (0.32, 0.51) | 0.81 (0.74, 0.84) | 0.29 (0.23, 0.37) | 0.37 (0.3, 0.49) |
| New Zealand | 0.29 (0.22, 0.37) | 0.22 (0.13, 0.33) | 0.22 (0.16, 0.29) | 0.28 (0.21, 0.37) |
| East & South East Asia | 0.35 (0.25, 0.46) | 0.52 (0.39, 0.63) | 0.27 (0.19, 0.35) | 0.34 (0.24, 0.44) |
| China | 0.3 (0.2, 0.41) | 0.41 (0.34, 0.49) | 0.24 (0.16, 0.31) | 0.3 (0.19, 0.39) |
| Indonesia | 0.45 (0.31, 0.59) | −0.13 (−0.21, −0.02) | 0.35 (0.26, 0.49) | 0.46 (0.32, 0.59) |
| Japan | 0.06 (0.04, 0.13) | 0.14 (0.07, 0.22) | 0.05 (0.02, 0.1) | 0.06 (0.03, 0.13) |
| Malaysia | 0.51 (0.37, 0.65) | 0.45 (0.33, 0.61) | 0.39 (0.29, 0.5) | 0.5 (0.36, 0.63) |
| Myanmar | 0.57 (0.48, 0.76) | 2.31 (1.76, 2.57) | 0.41 (0.34, 0.58) | 0.53 (0.45, 0.74) |
| Philippines | 0.78 (0.57, 0.95) | 2.56 (1.98, 3.1) | 0.59 (0.45, 0.74) | 0.75 (0.55, 0.93) |
| Thailand | 0.3 (0.25, 0.38) | −0.15 (−0.22, −0.08) | 0.24 (0.2, 0.3) | 0.31 (0.25, 0.38) |
| Viet Nam | 0.51 (0.42, 0.6) | 0.91 (0.5, 1.05) | 0.39 (0.31, 0.48) | 0.49 (0.4, 0.57) |
| South Asia | 0.86 (0.71, 1.07) | 2.13 (1.58, 2.65) | 0.66 (0.56, 0.84) | 0.83 (0.69, 1.04) |
| Afghanistan | 1.35 (1.18, 1.43) | 3.52 (2.99, 3.74) | 1 (0.87, 1.13) | 1.33 (1.16, 1.45) |
| Bangladesh | 0.75 (0.58, 0.92) | 2.87 (2.4, 3.46) | 0.57 (0.46, 0.73) | 0.72 (0.56, 0.89) |
| India | 0.74 (0.66, 1) | 2.3 (2.02, 2.66) | 0.59 (0.53, 0.78) | 0.72 (0.65, 0.97) |
| Iran (Islamic Republic of) | 0.47 (0.39, 0.68) | 1.08 (0.81, 1.23) | 0.3 (0.24, 0.5) | 0.44 (0.33, 0.65) |
| Maldives | 0.7 (0.62, 0.83) | 0.02 (0.02, 0.03) | 0.34 (0.3, 0.41) | 0.62 (0.55, 0.72) |
| Nepal | 0.69 (0.47, 0.83) | 1.66 (1.27, 2.13) | 0.51 (0.33, 0.59) | 0.65 (0.44, 0.77) |
| Pakistan | 1.02 (0.81, 1.19) | 1.74 (0.85, 2.47) | 0.78 (0.62, 0.96) | 0.98 (0.78, 1.17) |
| North America | 0.19 (0.11, 0.21) | 0.54 (0.35, 0.62) | 0.1 (0.06, 0.12) | 0.15 (0.09, 0.18) |
| Canada | 0.08 (0.05, 0.1) | 0.13 (0.07, 0.19) | 0.05 (0.02, 0.06) | 0.08 (0.04, 0.09) |
| USA | 0.2 (0.11, 0.22) | 0.57 (0.38, 0.65) | 0.1 (0.06, 0.13) | 0.16 (0.09, 0.19) |
| Western Europe | 0.25 (0.17, 0.35) | 0.36 (0.27, 0.44) | 0.19 (0.12, 0.26) | 0.24 (0.16, 0.33) |
| Albania | 0.36 (0.27, 0.45) | 1.21 (1.1, 1.27) | 0.25 (0.18, 0.34) | 0.34 (0.25, 0.43) |
| Austria | 0.12 (0.07, 0.24) | 0.27 (0.19, 0.41) | 0.07 (0.03, 0.17) | 0.1 (0.06, 0.23) |
| Belgium | 0.11 (0.05, 0.18) | 0.22 (0.08, 0.53) | 0.06 (0.02, 0.12) | 0.1 (0.04, 0.17) |
| Croatia | 0.34 (0.29, 0.48) | 1.09 (0.79, 1.23) | 0.24 (0.21, 0.36) | 0.33 (0.27, 0.46) |
| Cyprus | 0.58 (0.47, 0.68) | 1.02 (0.9, 1.22) | 0.38 (0.32, 0.46) | 0.54 (0.44, 0.63) |
| Denmark | 0.35 (0.26, 0.45) | 0.8 (0.72, 1.01) | 0.23 (0.15, 0.31) | 0.33 (0.23, 0.42) |
| Finland | −0.03 (−0.05, −0.01) | −0.07 (−0.1, −0.04) | −0.03 (−0.04, −0.02) | −0.03 (−0.04, −0.01) |
| France | 0.06 (0.03, 0.08) | 0.23 (0.16, 0.29) | 0.02 (0.01, 0.05) | 0.05 (0.02, 0.07) |
| Germany | 0.17 (0.07, 0.23) | 0.27 (0.19, 0.36) | 0.13 (0.04, 0.17) | 0.16 (0.05, 0.22) |
| Greece | 0.42 (0.31, 0.52) | 0.49 (0.41, 0.61) | 0.32 (0.23, 0.4) | 0.41 (0.3, 0.51) |
| Iceland | 0.21 (0.15, 0.3) | 0.58 (0.51, 0.63) | 0.04 (0.03, 0.07) | 0.14 (0.09, 0.21) |
| Ireland | 0.26 (0.13, 0.36) | 0.13 (0.02, 0.22) | 0.19 (0.11, 0.27) | 0.25 (0.14, 0.35) |
| Italy | 0.23 (0.16, 0.32) | 0.39 (0.28, 0.41) | 0.18 (0.12, 0.24) | 0.22 (0.15, 0.32) |
| Luxembourg | 0.17 (0.08, 0.26) | 0.21 (0.16, 0.33) | 0.09 (0.04, 0.14) | 0.16 (0.07, 0.24) |
| Malta | 0.29 (0.26, 0.39) | 0.43 (0.3, 0.49) | 0.1 (0.07, 0.13) | 0.24 (0.22, 0.32) |
| Montenegro | 0.39 (0.27, 0.45) | 0.83 (0.8, 0.96) | 0.25 (0.16, 0.29) | 0.36 (0.25, 0.42) |
| Netherlands | 0.43 (0.35, 0.48) | 0.78 (0.65, 0.87) | 0.32 (0.24, 0.37) | 0.41 (0.33, 0.46) |
| Norway | 0.18 (0.14, 0.35) | 0.33 (0.28, 0.46) | 0.13 (0.09, 0.24) | 0.17 (0.14, 0.33) |
| Portugal | 0.14 (0.04, 0.31) | −0.31 (−0.43, −0.23) | 0.12 (0.05, 0.25) | 0.16 (0.06, 0.33) |
| Serbia | 0.4 (0.33, 0.49) | 1.61 (1.38, 1.92) | 0.25 (0.16, 0.31) | 0.35 (0.26, 0.45) |
| Slovenia | 0.31 (0.28, 0.41) | 0.97 (0.85, 1.12) | 0.16 (0.12, 0.19) | 0.28 (0.23, 0.34) |
| Spain | 0.48 (0.33, 0.58) | 0.34 (0.27, 0.43) | 0.37 (0.26, 0.46) | 0.46 (0.33, 0.57) |
| Sweden | 0.16 (0.05, 0.3) | −0.06 (−0.14, 0.06) | 0.13 (0.05, 0.23) | 0.17 (0.06, 0.3) |
| Switzerland | 0.37 (0.18, 0.64) | 0.2 (0.1, 0.35) | 0.28 (0.13, 0.5) | 0.36 (0.17, 0.63) |
| United Kingdom | 0.27 (0.2, 0.35) | 0.67 (0.62, 0.79) | 0.17 (0.13, 0.25) | 0.25 (0.18, 0.33) |
| sub-Saharan Africa | 1.62 (1.39, 1.77) | 3.69 (3.22, 4.35) | 1.28 (1.1, 1.42) | 1.62 (1.41, 1.8) |
| Ghana | 1.4 (1.23, 1.61) | 2.86 (2.5, 3.21) | 1.09 (0.97, 1.32) | 1.38 (1.18, 1.61) |
| Kenya | 1.58 (1.35, 1.77) | 4.57 (2.98, 5.82) | 1.2 (1.03, 1.3) | 1.52 (1.32, 1.76) |
| Mauritius | 0.08 (0.03, 0.15) | −0.4 (−0.43, −0.37) | 0.08 (0.04, 0.13) | 0.11 (0.07, 0.17) |
| Mozambique | 1.48 (1.22, 1.81) | 1.37 (0.95, 1.69) | 1.16 (0.95, 1.42) | 1.52 (1.23, 1.81) |
| Nigeria | 1.72 (1.49, 1.79) | 4.27 (3.78, 5.1) | 1.38 (1.23, 1.46) | 1.75 (1.55, 1.86) |
| Senegal | 1.4 (1.24, 1.62) | 2.59 (2.33, 2.97) | 1.13 (0.95, 1.26) | 1.35 (1.2, 1.52) |
| United Republic of Tanzania | 1.65 (1.38, 1.85) | 3.99 (3.66, 4.5) | 1.24 (1.02, 1.45) | 1.56 (1.35, 1.83) |
| Latin America | 0.29 (0.17, 0.51) | 0.09 (−0.01, 0.26) | 0.23 (0.14, 0.41) | 0.28 (0.17, 0.5) |
| Argentina | 0.39 (0.33, 0.54) | 0.75 (0.55, 0.91) | 0.3 (0.24, 0.41) | 0.36 (0.31, 0.52) |
| Brazil | 0.22 (0.11, 0.39) | 0.23 (0.12, 0.39) | 0.17 (0.08, 0.31) | 0.22 (0.11, 0.39) |
| Mexico | 0.35 (0.21, 0.69) | −0.4 (−0.45, −0.23) | 0.3 (0.19, 0.58) | 0.36 (0.22, 0.68) |
| Uruguay | 0.51 (0.42, 0.63) | 1.68 (1.55, 2.01) | 0.36 (0.28, 0.44) | 0.48 (0.39, 0.58) |
| Middle East & North Africa | 0.43 (0.38, 0.47) | 1.21 (1.09, 1.38) | 0.33 (0.28, 0.36) | 0.42 (0.37, 0.46) |
| Egypt | 0.4 (0.36, 0.43) | 1.14 (1.03, 1.3) | 0.3 (0.27, 0.33) | 0.39 (0.35, 0.42) |
| Israel | 0.79 (0.63, 0.91) | 1.92 (1.72, 2.03) | 0.57 (0.46, 0.66) | 0.74 (0.59, 0.87) |
| Libya | 0.53 (0.43, 0.65) | −0.01 (−0.09, 0.05) | 0.42 (0.35, 0.49) | 0.52 (0.43, 0.64) |
| Morocco | 0.64 (0.53, 0.72) | 1.08 (0.78, 1.23) | 0.48 (0.4, 0.55) | 0.62 (0.51, 0.69) |
| Turkey | 0.64 (0.55, 0.71) | 2.14 (1.98, 2.48) | 0.45 (0.38, 0.51) | 0.62 (0.5, 0.68) |
- *
PWID: people who inject drugs
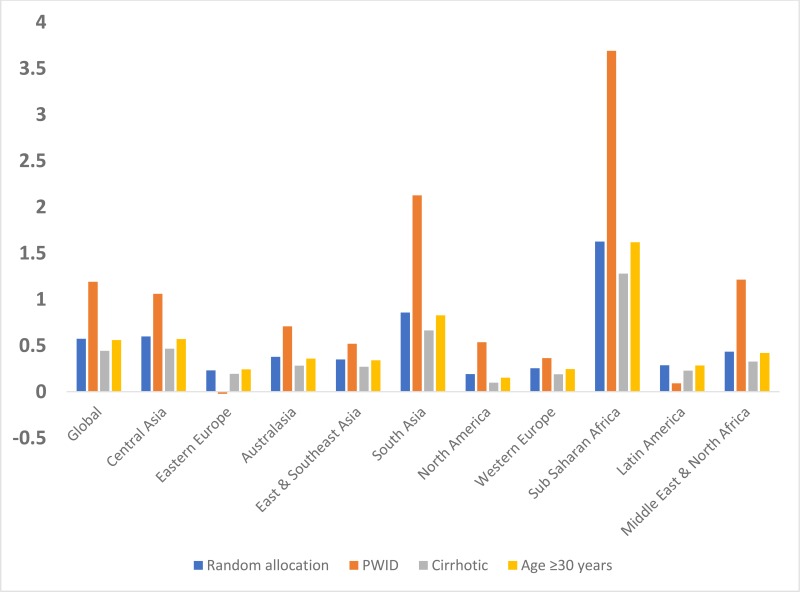
and show the prevention benefit of targeting treatment to different groups of infected individuals. Overall, treating infected PWID is the most effective strategy globally with 1.19 (IQR: 0.93, 1.45) IA per treatment. However, the number of IA from targeting PWID is highly variable, ranging from negative in Mauritius −0.4 [IQR: −0.43, −0.37]) and Mexico (−0.4 [IQR: −0.45, −0.23]), up to 4.57 (IQR: 2.98, 5.82) in Kenya. The IA per treatment for those aged over 30 years was similar (0.56 [IQR: 0.45, 0.68]) to what was achieved from randomly allocating treatment, while targeting those with cirrhosis consistently averted fewer infections (0.44 [IQR: 0.35, 0.55]) across all regions.
Determinants of the country-level impact of treatment
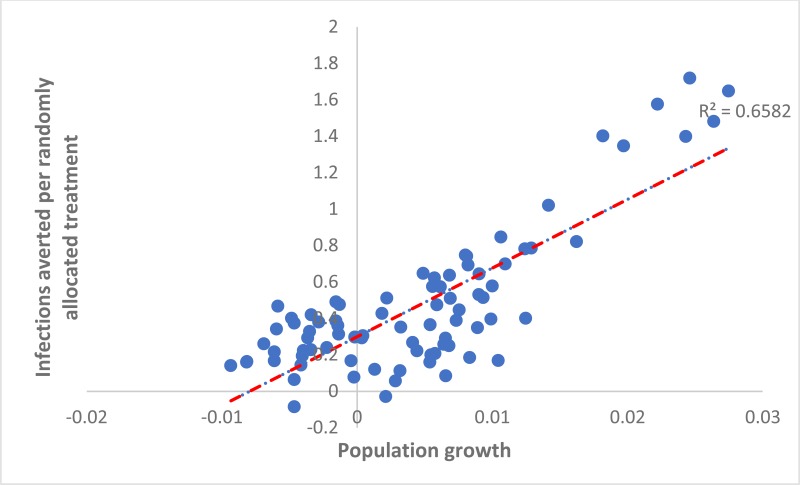
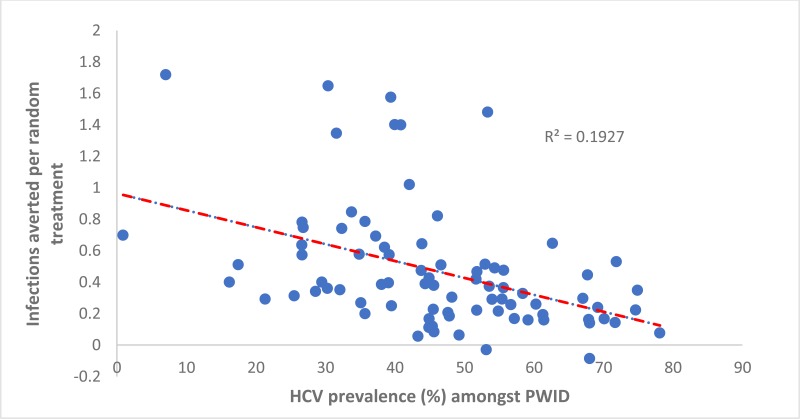
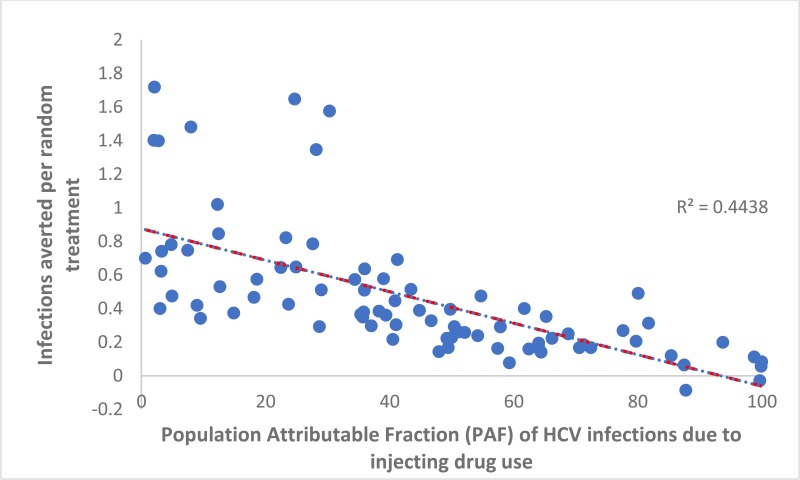
When considering the country-level variation in the number of IA per treatment over 20 years due to randomly allocating treatment or targeting treatment to PWID, some associations were found across countries. The number of HCV IA per randomly allocated treatment was positively associated with a country’s population growth rate (adjusted coefficient 0.28 (95% confidence interval [CI]: 0.23, 0.32) per percentage point increase in a country’s growth rate, see
for a plot of the univariable association). Conversely, the IA per randomly allocated treatment was negatively associated with the prevalence of PWID in a country (−0.004 [95% CI: – 0.006, 0.002] per percentage point increase in HCV prevalence, see
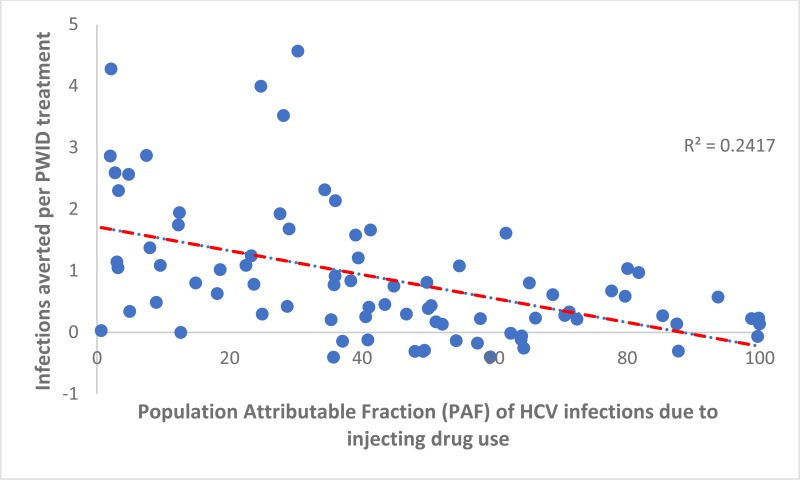
) and the PAF of IDU to HCV transmission (−0.006 [95% CI: −0.007, −0.004] per percentage point increase in the PAF, see
), and positively associated with the prevalence of HCV among PWID (0.09 [95% CI: 0.01, 0.17]). The general population HCV prevalence, the prevalence of IDU among adults, and duration of injecting until cessation were not associated with IA per randomly assigned treatment. The R2 value for this multivariable regression model was 0.86, indicating that these variables explain the vast majority of the variation in IA between countries.
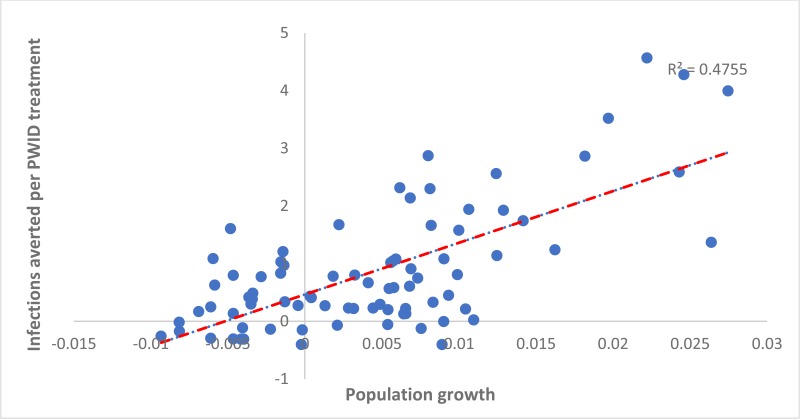
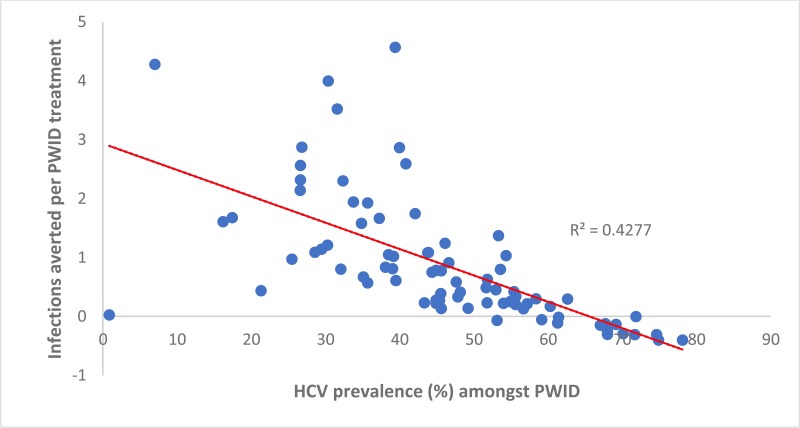
Similarly, the number of IA per treatment allocated to PWID was positively associated with a country’s population growth (0.61 [95% CI: 0.45, 0.76] per percentage point increase in a country’s yearly growth rate, ). Otherwise, the number of IA per treatment allocated to PWID was negatively associated with the prevalence of HCV among PWID in a country (−0.03 [95% CI −0.03, −0.02] per percentage point increase in prevalence, see
). Indeed, negative IA occurred in countries where the antibody HCV prevalence among PWID was high (>60%). This shows that randomly allocating treatment is more effective in many countries (15), whereas two or more infections are averted per treatment in numerous countries (11) where the HCV antibody prevalence in PWID is less than 30%. The number of IA per treatment given to PWID was not associated with the PAF of IDU to the HCV epidemic (see
), or the general population HCV prevalence, the prevalence of IDU among adults, or the duration of injecting until cessation. The R2 value for this model was 0.79, once again indicating that these variables explain most of the variation between countries in IA.
In the analysis that compared the different runs within each country, the yearly percentage change in the general population HCV epidemic was found to be positively associated with the IA per random allocated treatment (0.23 [95% CI: 0.20, 0.25] per 0.1% increase in prevalence per year) and the IA per treatment allocated to PWID (0.08 [95% CI: 0.01, 0.15]; supplementary Fig. 5 shows examples of these associations).
Discussion
Main findings
The findings from the analysis suggest that over 20 years just over one infection will be prevented for every two randomly allocated DAA treatments undertaken globally. This will vary by region and country, with over five treatments being needed to prevent one infection in Eastern Europe but less than one in sub-Saharan Africa. Targeting treatment to those aged over 30 years is likely to produce similar prevention benefits, while targeting those with cirrhosis may produce slightly less impact. Targeting PWID could produce a greater impact, with over one infection on average being prevented for each PWID treated. However, this varies considerably by region, with negative infections averted in 15 of 82 countries modelled, but up to 3.7 infections prevented per PWID treated in sub-Saharan Africa. Importantly, in 68% of the countries modelled, treating PWID will prevent more infections than randomly allocating treatment, whereas in the remainder the opposite will be true.
The results suggest that country-level differences in the prevention impact achieved from either treating PWID or randomly allocating treatment are strongly related to the country’s population growth rate, with more infections being prevented in settings with greater population growth, such as Pakistan and Afghanistan. Conversely, fewer infections will be prevented in settings with considerable HCV epidemics among PWID, with the country’s HCV prevalence among PWID being a strong negative predictor of impact. The importance of IDU in driving HCV transmission also has an effect when treatment is randomly allocated, with less impact being achieved in settings where IDU is the main contributor to transmission.
Strengths and limitations
The strength of this modelling is the simulation of a wide range of country-level HCV epidemics covering most of the world’s population (84%). In these countries, the differing role of PWID to each HCV epidemic is accounted for, as well as differences in the population demographics and growth. However, due to data limitations, over half of the world’s countries are not represented, overwhelmingly LMICs, which could affect our regional and global results.
The modelling of so many countries necessitated the use of a generalizable model structure and standardized algorithm for fitting the model to each country’s epidemic. The fitting of this model to each country’s population age structure was problematic in some cases, possibly due to our model not including population migration; on which there were inadequate data to parameterize our model. In some cases, migration could be a significant source of new incoming HCV infections for a country (although studies have found it to be less significant than expected (18)), which could affect the prevention benefits of treatment because it is unlikely to affect this source of new infections. Also, as detailed modelling was not undertaken for each country, the country-level projections should be viewed cautiously because a detailed examination of the epidemic in a specific country may unearth additional data that could affect the resulting impact projections. However, this should not affect the general insights gathered on the prevention benefits of treatment, and its variability, which gives impetus to undertaking more detailed country-specific modelling.
The biggest limitation with the modelling was the lack of high-quality data on the prevalence of PWID in most countries, the prevalence of HCV in the general population, and the prevalence of HCV among PWID. All countries with at least one estimate for each of these parameters from existing systematic reviews were included in this analysis; however, some data were old, used ambiguous methods, or had dubious findings, such as an estimated HCV prevalence of 0.9% among PWID in the Maldives. Additionally, there was very little information on the evolving HCV epidemic for most countries, with only three countries (Egypt, France, the USA) having “robust” data on how HCV prevalence has changed over time (2). Due to the lack of data on the temporal dynamics of country-level HCV epidemics, we incorporated uncertainty in the dynamics of the epidemics across different model runs. Our analyses highlighted the importance of improving country-level information on the ongoing trajectory of HCV epidemics to get a better idea of the likely impact of scaling up treatment.
Comparison with other literature
This is the first study to consider the prevention benefit of different HCV treatment allocation strategies across country settings, the first to produce a global estimate for the infections averted per treatment, and the first to evaluate which country-level factors affect the impact achieved. Other modelling analyses have considered the prevention benefits of HCV treatment among PWID, men who have sex with men and the general population (5, 19–26). Some of these analyses of PWID HCV epidemics have also suggested that less prevention benefit will be achieved in settings with higher or increasing HCV prevalence in PWID (5, 25, 27), with one also estimating the IA per treatment among PWID; giving similar results to our modelling (25). However, no study has undertaken similar analyses for generalized epidemic settings, so this analysis is a novel contribution to the literature.
Implications and conclusions
The analyses show that globally, a moderate prevention impact (one infection prevented per two treatments) can be achieved with a treat-all strategy, although this varies, depending on country-level factors. These findings are useful for policy-makers, as they provide a better understanding of the prevention benefits of widespread treatment when planning for the WHO 2030 HCV elimination targets (4). They show that LMICs will generally achieve greater prevention benefits (larger number of IA per treatment) than high-income countries, due to growing populations and generalized epidemics, emphasizing that the scale up of treatment could be more cost effective in these settings. However, many LMICs would lack the resources to treat HCV, or screening may present a barrier to treatment scale up due to the generalized nature of their HCV epidemics (6). This issue would be particularly pertinent for countries that have high burdens of other infectious diseases, such as HIV, tuberculosis or malaria, where policy-makers need to focus their resources on other more acute diseases (28) before focusing on HCV. Only with substantial donor support, or considerable reductions in the costs of HCV drugs and diagnostic tests will such countries be able scale up treatment for HCV.
Importantly, our analyses emphasized the prevention benefits of targeting PWID, with this being the most effective treatment strategy globally, and in many countries. This is due to their higher chance of transmitting HCV to others than of other subgroups (7). However, PWID harbour only a fraction of the overall HCV burden, so any elimination strategy would also need to target other groups. Also, if the prevalence of HCV is high among PWID (chronic HCV prevalence exceeds 50%) then no infections are averted from moderate levels of treatment among PWID, due to their having a very high chance of reinfection. In such settings, treatment rates among PWID have to be high to overcome this issue, or other HCV prevention interventions for PWID (needle and syringe programmes or opioid substitution therapy) need to be scaled up to sufficiently reduce the chance of reinfection. Together, these findings emphasize the need to always allocate resources to treating PWID, either due to the greater prevention benefits achieved and/or to gain control of the epidemic among PWID, which will be crucial for achieving elimination.
For preventing infection, the findings support a change in the WHO guidelines towards a treat-all strategy, with special emphasis also being placed on treating PWID (22). Such a strategy would reduce practical obstacles to treatment, such as screening to identify individuals with advanced disease and could be considered more equitable by allowing all those who seek treatment to access it. There are obviously other issues to consider, mainly surrounding the costs of testing and treatment, and thereby prioritization due to limited resources, but if these can be overcome then our analyses suggest that a widespread treat-all strategy will achieve considerable prevention benefits in most settings and so should be advocated.

