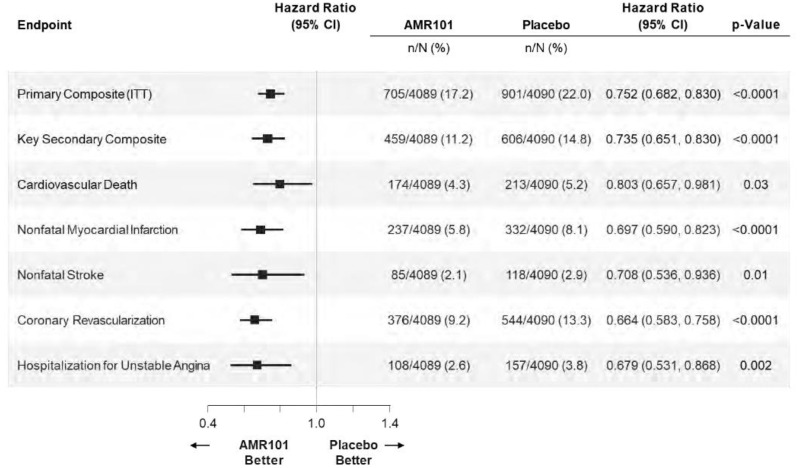
Appendix 3Detailed Outcome Data
Table 16Stratified Analysis of Time to the Primary Composite End Point From Date of Randomization: Sensitivity Analyses֪ — ITT Population
View in own window
| End point, n (%) | Icosapent ethyl N = 4,089 | Placebo N = 4,090 | HR (95% CI) | P value |
|---|
| Primary composite – excluding undetermined death | 673 (16.5) | 878 (21.5) | 0.737 (0.667 to 0.815) | < 0.0001 |
| Primary censored at drug discontinuation | 577 (14.1) | 732 (17.9) | 0.739 (0.662 to 0.824) | < 0.0001 |
| Primary censored at drug discontinuation + 30 days | 596 (14.6) | 776 (19.0) | 0.721 (0.648 to 0.802) | < 0.0001 |
| Primary with silent MI censored at last normal | 705 (17.2) | 901 (22.0) | 0.752 (0.682 to 0.830) | < 0.0001 |
| Primary with silent MI censored at mid-point | 705 (17.2) | 901 (22.0) | 0.752 (0.682 to 0.830) | < 0.0001 |
CI = confidence interval; HR = hazard ratio; MI = myocardial infarction.
Table 17Subgroup Analysis Hazard Ratios (95% CI) for Primary Composite End Point by Subgroups — ITT Population
View in own window
| Icosapent ethyl, n/N (%) | Placebo n/N (%) | HR (95% CI) | Interaction P value |
|---|
| Primary composite (ITT) | 705/4,089 (17.2) | 901/4,090 (22.0) | 0.752 (0.682 to 0.830) | |
|---|
| Risk Category | | | | 0.1388 |
|---|
| Established CVD (secondary prevention) | 559/2,892 (19.3) | 738/2,893 (25.5) | 0.726 (0.650 to 0.810) | |
|---|
| At high risk for CVD (primary prevention) | 146/1,197 (12.2) | 163/1,197 (13.6) | 0.876 (0.700 to 1.095) | |
|---|
| Baseline diabetes | | | | 0.5598 |
|---|
| Diabetes | 433/2,394 (18.1) | 536/2,393 (22.4) | 0.769 (0.678 to 0.873) | |
|---|
| No diabetes | 272/1,695 (18.0) | 365/1,694 (21.5) | 0.726 (0.620 to 0.849) | |
|---|
CI = confidence interval; CVD = cardiovascular disease; HR = hazard ratio; ITT = intention-to-treat.
