From: Simulation of Human Erythrocyte Metabolism

NCBI Bookshelf. A service of the National Library of Medicine, National Institutes of Health.

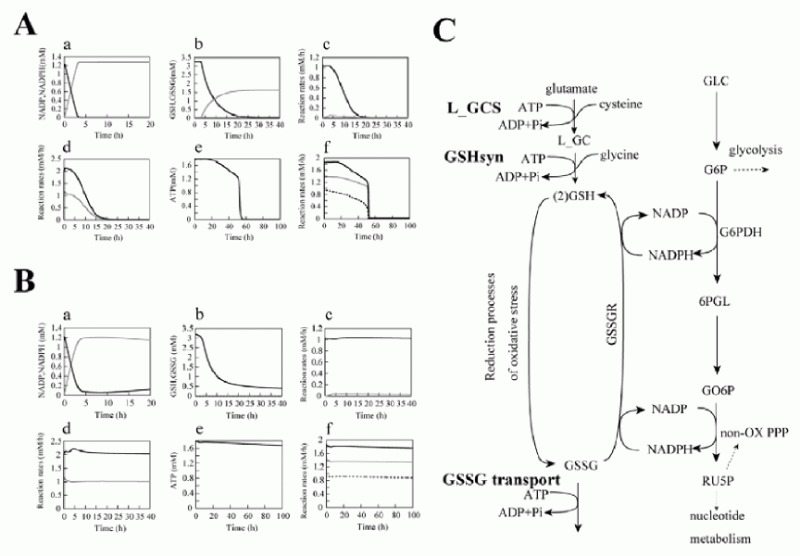
Simulation results of G6PDH deficiency. Simulation results of before (A) and after (B) expansion of the pathway of glutathione metabolism. Each panel shows the time-course in concentration of a) NADPH (black line), NADP (gray line), b) GSH (black line), GSH (gray line), and e) ATP and in reaction rate of c) HK (black line), G6PDH (gray line), d) PK (black line), PFK (gray line), f) GAPDH (black line), PGK (gray line), ALD (black-broken line), respectively. C) Schematic representation of the glutathione metabolism pathway including the de novo synthesis of glutathione catalyzed by L_GCS and GSHsyn and the transport of GSSG.
From: Simulation of Human Erythrocyte Metabolism

NCBI Bookshelf. A service of the National Library of Medicine, National Institutes of Health.