NCBI Bookshelf. A service of the National Library of Medicine, National Institutes of Health.
Bruening W, Launders J, Pinkney N, et al. Effectiveness of Noninvasive Diagnostic Tests for Breast Abnormalities [Internet]. Rockville (MD): Agency for Healthcare Research and Quality (US); 2006 Feb. (Comparative Effectiveness Reviews, No. 2.)
This publication is provided for historical reference only and the information may be out of date.

Effectiveness of Noninvasive Diagnostic Tests for Breast Abnormalities [Internet].
Show detailsQuality Assessment Tool for Diagnostic Studies
- 1.
Were the patients enrolled consecutively?
- 2.
Were the patient inclusion/exclusion criteria applied consistently to all patients?
- 3.
Was the study prospective?
- 4.
Did the study avoid a case-control design?
- 5.
Was the funding for this study derived from a source that does not have a financial interest in its results?
- 6.
Did the study compare the diagnostic of interest to a valid reference standard?
- 7.
Was the reference standard an accepted “gold standard”?
- 8.
Did the study account for inter-scorer/reader differences?
- 9.
Were readers of the diagnostic test of interest blinded to the results of the reference standard?
- 10.
Were readers of the reference standard blinded to the results of the diagnostic test of interest?
- 11.
Were the readers of the diagnostic test of interest blinded to all other clinical information?
- 12.
Were the readers of the reference standard blinded to all other clinical information?
- 13.
Were patients assessed by the reference standard regardless of the test's results?
- 14.
If the study reported data for a single diagnostic threshold, was the threshold chosen a priori?
- 15.
Were the study results unaffected by intervening treatments or disease progression/regression?
- 16.
Were at least 85% of enrolled patients accounted for? Were the authors conclusions, as stated in the abstract or the article's discussion section, supported by the data presented in the article's results section?
- 17.
Was the report of the study free from unresolvable internal discrepancies?
Strength and Stability of Evidence Algorithm
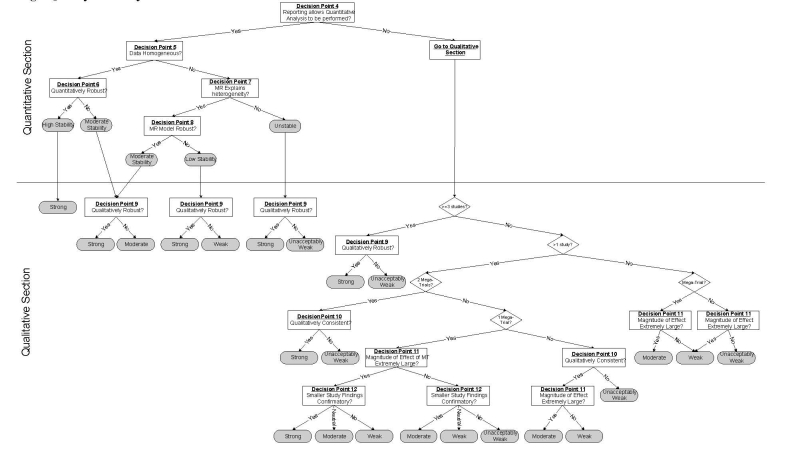
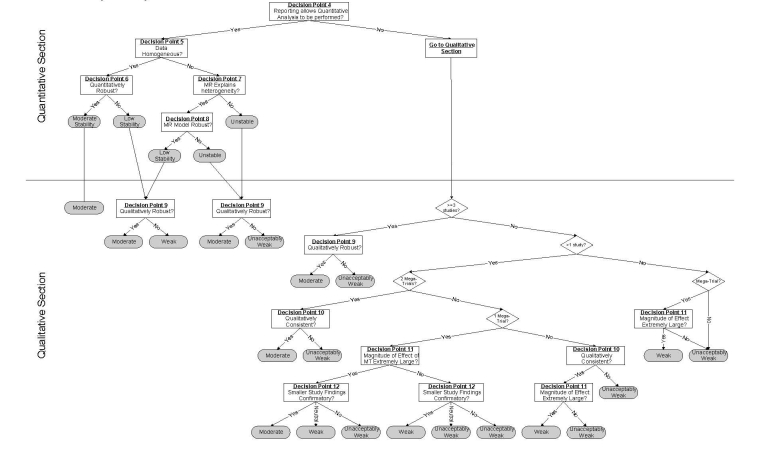
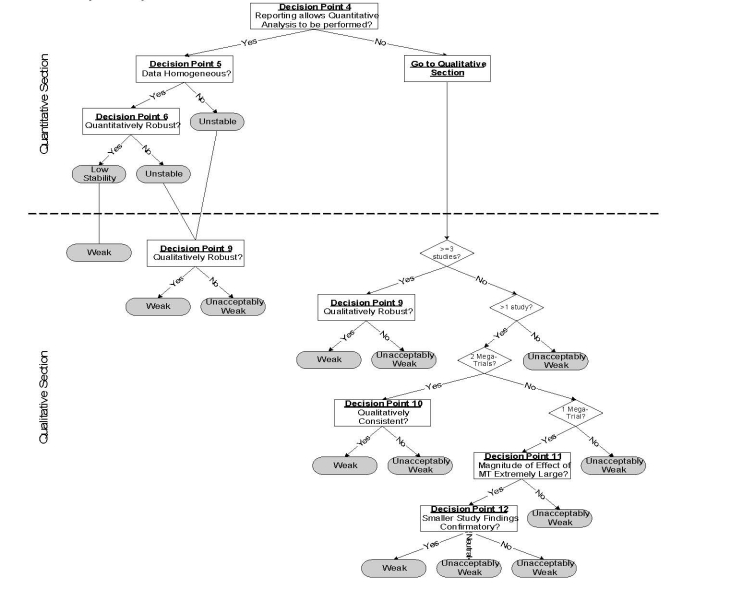
The algorithm developed by ECRI is shown in Figure 23 and briefly described below.

Figure
Figure 23. Strength and Stability of Evidence Algorithm.
The algorithm begins with a “General Section” that serves three purposes; (1) to exclude studies of very low quality, (2) to determine whether an evidence base is potentially conclusive by determining whether the aggregate evidence has sufficient statistical power, and (3) to direct the user to either a high, moderate or low quality arm of the algorithm, based on the aggregate quality of the evidence base.
The pathway for high quality evidence bases (see next page of the figure) illustrates the division of the algorithm into a top part that addresses quantitative questions (How well does it work?) and a bottom part that addresses qualitative questions (Does it work?). When an evidence base is comprised of only a small number of studies, the user is routed directly into the qualitative part of the algorithm because quantitative conclusions are not possible. Special rules apply to these small evidence bases, and these rules account for whether a mega-trial is among the available studies and whether the size of the observed effect is extremely large.
The quantitative section takes into account statistical heterogeneity, robustness (sensitivity analysis and cumulative meta-analysis) and meta-regression to produce a rating of the stability of the estimate. When there is heterogeneity or lack of robustness of the summary estimate, the user is directed through the quantitative section and to the qualitative section. In the quantitative section, there is another test of robustness. This latter robustness test is one of determining whether all (or a certain percentage) of results lead to the same conclusion. To illustrate the difference between quantitative and qualitative robustness, consider a hypothetical meta-analysis that contains k studies, all of which find very large and statistically significant odds ratios. Now assume that there is statistically significant heterogeneity among these results that cannot be explained by meta-regression. Hence, no summary estimate is possible, so the user is directed to the qualitative part of the algorithm. Because all of the studies in the meta-analysis found the technology to be effective, a qualitative conclusion (i.e., “It works”) is still possible. The algorithm produces a final rating of the strength of evidence for the qualititative conclusion.
Two other points are worth mentioning. First, it is not possible to obtain a highly stable estimate when meta-regression is used to explain heterogeneity. This is because meta-regression is hypothesis generating, not hypothesis testing. Second, the moderate and low quality algorithm pathways are analogous to the high quality pathway except that the stability and strength of evidence is reduced.
- Study Quality and Strength of Evidence Evaluation - Effectiveness of Noninvasive...Study Quality and Strength of Evidence Evaluation - Effectiveness of Noninvasive Diagnostic Tests for Breast Abnormalities
- Preface - Effectiveness of Noninvasive Diagnostic Tests for Breast AbnormalitiesPreface - Effectiveness of Noninvasive Diagnostic Tests for Breast Abnormalities
- Homo sapiens golgin B1 (GOLGB1), transcript variant 5, mRNAHomo sapiens golgin B1 (GOLGB1), transcript variant 5, mRNAgi|1677556728|ref|NM_001366282.2|Nucleotide
- Trichophyton mentagrophytes culture NCCPF:800023 squalene epoxidase gene, comple...Trichophyton mentagrophytes culture NCCPF:800023 squalene epoxidase gene, complete cdsgi|1601129148|gb|KX906452.2|Nucleotide
- Homo sapiens cDNA FLJ77762 complete cds, highly similar to Homo sapiens cullin-a...Homo sapiens cDNA FLJ77762 complete cds, highly similar to Homo sapiens cullin-associated and neddylation-dissociated 1 (CAND1), mRNAgi|158258343|dbj|AK292456.1|Nucleotide
Your browsing activity is empty.
Activity recording is turned off.
See more...
