NCBI Bookshelf. A service of the National Library of Medicine, National Institutes of Health.
Levine CB, Fahrbach KR, Siderowf AD, et al. Diagnosis and Treatment of Parkinson's Disease: A Systematic Review of the Literature. Rockville (MD): Agency for Healthcare Research and Quality (US); 2003 Jun. (Evidence Reports/Technology Assessments, No. 57.)
This publication is provided for historical reference only and the information may be out of date.

Diagnosis and Treatment of Parkinson's Disease: A Systematic Review of the Literature.
Show detailsInterpretation of Standardized Mean Differences
Standardized mean differences (δs) are used to represent the difference between two groups when the groups are measured on differently scaled measures across many studies. For instance, in the pharmacological studies, patients are evaluated on as many as seven different measures. A standardized mean difference between groups is simply the mean difference re-scaled so that all measures have the same variance and standard deviation in scores. If we make the assumption that these scales or subscales measure roughly the same construct (past validity studies make this a safe assumption for the scales in question),1 meta-analysis of standardized mean differences (also commonly referred to as “effect sizes” in this report) becomes both possible and theoretically meaningful.
The value of the standardized mean difference might be best considered as the degree of overlap between the distributions of treatment and control group scores. Because delta (δ) is the standardized score of the treatment group mean in the control group distribution, we can calculate approximately what proportion of the control group scores are less than the average score in the treatment group.2 The table below summarizes percentages for a range of effect sizes.
| Effect Size | 0.10 | 0.20 | 0.30 | 0.40 | 0.50 | 0.60 | 0.70 | 0.80 | 1.00 | 1.20 | 1.50 |
|---|---|---|---|---|---|---|---|---|---|---|---|
| % of treatment group with scores better than the average person in the control group | 54% | 58% | 62% | 66% | 69% | 73% | 76% | 79% | 84% | 88% | 93% |
Thus, someone undergoing a treatment (e.g., bromocriptine) that has an expected effect size of .50 would expect that his symptoms afterwards would be better than 70 percent of those who underwent the “control” procedure (e.g., L-dopa alone).
Even small effects can be important, depending on the importance of the outcome. In past medical studies, small but statistically significant effect sizes have been deemed important enough to prematurely end double-blinding: the 1987 study of the effect of aspirin on reducing the risk of heart attacks found an effect size for aspirin over placebo equivalent to a standardized mean difference of .07.3
Calculation of Change Score Standard Deviations
While many studies reported both baseline and outcome data (from which change score means can be calculated), only a few studies (most from the Parkinson's Study Group) reported change score standard deviations. Because controlling for pre-test differences was desired, and the “change score” standardized mean difference was desirable as a meta-analytic outcome, we estimated change score standard deviations when the data was not directly available.
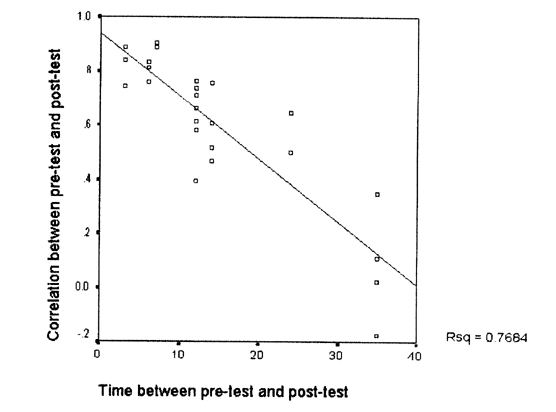
This estimation was possible due to the studies that reported pre-test means and standard deviations, post-test means and standard deviations, and change score means and standard deviations. This data was available for 25 treatment arms, and it allowed for the calculation of 25 pre/post-test correlations. Figure 1 demonstrates that the time between pre-test and post-test scores was strongly related to the correlation between pre-test and post-test scores. In fact, the relationship was strong enough (R2=.77) to make imputation of the pre/post-test correlation possible. The method used gave slightly more conservative (i.e., lower) correlations than those implied by the figure. For studies with a treatment duration of 10 months or less, a correlation of .8 was used to estimate the change-score standard deviation; .6 was used for those between 10.1 months and 20 months; .4 for those between 20.1 months and 30 months; .2 for those between 30.1 months and 40 months; and .1 for those studies of longer duration. The formula used was

Figure 1. Time of evaluation versus pre-test post-test correlation

Appendix F References
- 1.
- Martinez-Martin P, Fontan C, Frades Payo B. et al. Parkinson's disease: Quantification of disability based on the Unified Parkinson's Disease Rating Scale. Neurologia. 2000;15:382–7. [PubMed: 11195144]
- 2.
- Hedges L V, Olkin I. Statistical Methods for Meta-Analysis. San Diego: Academic Press. 1985
- 3.
- Steering Committee of the Physician's Health Study Research Group. Preliminary report: Findings from the aspirin component of the ongoing physician's health study. N Engl J Med. 1988;318:262–4. [PubMed: 3275899]
- Appendix F. Statistical Reference - Diagnosis and Treatment of Parkinson's Disea...Appendix F. Statistical Reference - Diagnosis and Treatment of Parkinson's Disease
- Acknowledgments - Diagnosis and Treatment of Acute Bacterial RhinosinusitisAcknowledgments - Diagnosis and Treatment of Acute Bacterial Rhinosinusitis
- Appendix 2. Search Strings - Rehabilitation for Traumatic Brain InjuryAppendix 2. Search Strings - Rehabilitation for Traumatic Brain Injury
- Bibliography - Rehabilitation for Traumatic Brain InjuryBibliography - Rehabilitation for Traumatic Brain Injury
- WD repeat-containing protein 27 isoform X16 [Homo sapiens]WD repeat-containing protein 27 isoform X16 [Homo sapiens]gi|2217360864|ref|XP_047274545.1|Protein
Your browsing activity is empty.
Activity recording is turned off.
See more...