NCBI Bookshelf. A service of the National Library of Medicine, National Institutes of Health.
ECRI Health Technology Assessment Group. Diagnosis and Treatment of Swallowing Disorders (Dysphagia) in Acute-Care Stroke Patients. Rockville (MD): Agency for Health Care Policy and Research (US); 1999 Jul. (Evidence Reports/Technology Assessments, No. 8.)
This publication is provided for historical reference only and the information may be out of date.
Diagnosis and Treatment of Swallowing Disorders (Dysphagia) in Acute-Care Stroke Patients.
Show detailsCost-Effectiveness Analysis of a Dysphagia Diagnosis and Treatment Program
Introduction
In this supplemental analysis, we conduct an analysis to determine whether dysphagia diagnosis and treatment programs are a cost-effective means to prevent aspiration pneumonia. As in our main analysis, we focused on stroke patients, because they are the largest group of elderly adults experiencing dysphagia. The clinical measure of effectiveness for this supplemental analysis is prevention of aspiration pneumonia, because it is the major cause of serious morbidity, mortality, and expense for patients with dysphagia. Also, as discussed in the main assessment, we were unable to find adequate literature to estimate the effect of dysphagia diagnosis and treatment on the other important patient outcomes of malnutrition, dehydration, and quality of life (QOL). Finally, we focused on the acute-care setting because patients are at greatest risk for aspiration pneumonia during this time, because the greatest efforts of dysphagia programs are at these times, and because most of the data required for cost-effectiveness analysis was for the acute-care setting. However, we also discuss the implications of our results for nursing home patients.
We performed this analysis by constructing a decision tree that specifically addresses the question of whether a typical program to diagnose and treat dysphagia is effective enough in preventing pneumonia to justify the cost of diagnosis and treatment. We first addressed the question for a dysphagia program that uses a preliminary bedside exam (BSE) followed by a full BSE for patients judged to have dysphagia by the preliminary exam. We next examined the cost-effectiveness of a program that uses a preliminary exam to refer dysphagia patients to a videofluoroscopic swallowing study (VFSS). To answer each question, we set up the decision tree that mimics a hypothetical randomized controlled trial of a cohort of acute stroke patients.
There are two primary arms of this decision tree. One arm models the historical situation of a typical acute-care hospital with no special dysphagia program. In this arm, the swallowing competence and needs of stroke patients are assessed informally by attending physicians, nurses, and dieticians without special training in diagnosis and treatment of dysphagia, and without the services of speech-language pathologists (SLPs) who are specially trained to diagnose and treat dysphagia. In this situation, a major involvement of physicians is in placing enteral tubes in patients judged to have a swallowing problem that could make it difficult for them to maintain hydration and nutrition or that could lead to aspiration of food and liquids. Patients judged less severely impaired may be provided with pureed food and possibly a soft mechanical diet including thickened liquids. The historical proportion of stroke patients who acquire aspiration pneumonia is used as the effectiveness measure of this arm. There is a branch for the proportion of patients who get aspiration pneumonia during a typical acute-care stay of 2 weeks. The tree counts the number of patients who get pneumonia and the number who remain free of pneumonia by setting the effectiveness payoff for the former patients at 0 and the effectiveness payoff for the latter patients at 1. Thus, the measure of effectiveness in this analysis is number of pneumonia cases prevented. The cost of pneumonia is calculated as the Medicare reimbursement rate for pneumonia. The expected value for this entire arm is calculated as the pneumonia treatment costs to Medicare per stroke patient.
Using Medicare reimbursements instead of true provider costs allows us to estimate Medicare's net costs for dysphagia diagnosis-treatment minus pneumonia costs. We could find no recent literature sources for comprehensive provider costs of dysphagia diagnosis-treatment and pneumonia, whereas Medicare reimbursement rates are known. If Medicare reimbursements underestimate the provider costs of treating pneumonia to a greater extent than dysphagia diagnosis-treatment costs, then any cost savings found by our analysis will be even greater for providers than for Medicare. Thus, our estimates will be conservative and for the minimum savings.
The second primary arm of the tree models a typical dysphagia program in the same setting as above. For the BSE program, clinicians, typically nurses, carry out a preliminary swallowing evaluation as described by Odderson et al. (Odderson, Keaton, and McKenna, 1995) (described in the main evidence report in the Results section under Question 1) and refer stroke patients suspected of dysphagia to SLPs specially trained to diagnose and treat dysphagia. These dysphagia specialists carry out a formal BSE. Treatment of these patients may include (alone or in combination) enteral intubation, positional maneuvers, strengthening exercises, and diet modifications such as the restriction of certain consistencies and the addition of thickening agents to certain consistencies. Patients also receive 15 minutes a day of therapy for 6 days to reinforce and maintain these measures. We took the incidence of aspiration pneumonia observed in recent studies of BSE dysphagia programs as the effectiveness of this arm. For the cost of this arm, we used the Medicare reimbursement rate for diagnosis and treatment of dysphagia and the reimbursement rate of treating pneumonia. Therefore, the costs associated with this arm are the net costs for dysphagia diagnosis-treatment and pneumonia per stroke patient. The decrease in the number of PEG tubes is also considered in the costs. However, rather than adding PEG costs to both arms, we merely subtracted the decrease from the dysphagia program arm.
The simple cost-effectiveness of each arm is calculated as the costs divided by the proportion of pneumonia-free patients. However, this is not a particularly useful measure, because we are interested in the costs for all patients. Of primary interest is the overall difference in cost-effectiveness between the two arms, called the marginal or incremental cost-effectiveness. This tells the cost-effectiveness of adding the dysphagia program to the routine care of stroke patients. The marginal cost-effectiveness between the two arms is calculated as the difference in total costs for each arm divided by the difference in effectiveness for each arm. This gives the cost (or savings) per pneumonia case prevented. These are the net direct medical costs (or savings) of preventing pneumonia.
It is important to place these medical costs in perspective, which can only be accomplished by adjusting the cost of pneumonia by some measure of QOL and the threat of death from pneumonia. Meaningful pneumonia-related QOL data are not currently available, so it is necessary for individual users of this analysis to employ their own data and judgment for this evaluation. Also, it is necessary to realize that because we were limited by published data to calculating only the pneumonia cost-effectiveness, one is forced to take pneumonia as representative of the other important patient outcomes such as dysphagia-related malnutrition, dehydration, and QOL. Dysphagia diagnosis and treatment costs relating to these have unavoidably been included here in our pneumonia analysis, while the costs of these additional patient outcomes and the savings for their prevention have not. Thus, the additional savings (monetary or QOL) from preventing or ameliorating these must be considered, although we were unable to explicitly calculate these.
Methods
We used the results and evidence tables of the main analysis as the probabilities and costs in the decision tree. The methods for searching the literature and for extracting and analyzing the data are described in detail in the Methods section of the main analysis. Briefly, the peer-reviewed literature was searched for publications containing information on the epidemiology, burden of disease, diagnosis, treatment and costs of stroke, aspiration pneumonia, and dysphagia in the elderly population. The titles and abstracts in the search results were examined independently by two analysts, and publications that appeared to have relevant data were ordered. The set of ordered publications was manually examined independently by two analysts to extract data, and bibliographies were examined for additional publications that were not in the searches. The only exclusion criteria were that the studies contain 10 or more patients and be conducted in the United States. In some cases where no appropriate data was available meeting those requirements, smaller studies and studies outside the United States were included, with appropriate indication of these exceptions.
The variables used in the decision trees are shown in S-1 and S-2. These same data, along with additional data provided for comparison purposes, are presented in the evidence tables at the end of the supplemental analysis.
The decision tree(s) were constructed, calculated, and illustrated using DATATM decision analysis software (version 3.0.18: TreeÂge Software, Cambridge, MA).
Cost-Effectiveness of a BSE Dysphagia Program Compared with No Program
Tree Construction
No-program arm
As described above, the no program arm of the tree was analogous to a historical control group composed of patients in a typical acute-care hospital that has no special dysphagia program. The probabilities and costs used in this comparison arm are presented in Table S-1. These data, along with additional data provided for comparison purposes, are presented in the evidence tables at the end of the supplemental analysis. The proportion of stroke patients who acquire aspiration pneumonia without a dysphagia program is 0.082, which is the N-weighted mean for Haerer and Smith, 1974; Young and Durant-Jones, 1990; Odderson, Keaton and McKenna, 1995; and Barker and Mullooly, 1997. These are the historical control data adjusted for time of followup that were discussed in the main body under Question 1, and are described in more detail in Appendix D. We assumed the cost of treating a case of aspiration pneumonia in a stroke patient is $2,164, which is the 1997 Medicare reimbursement difference between stroke (DRG17) and stroke with comorbid condition (DRG16). Under the current prospective payment plan, this is meant to cover all provider costs in this situation. As noted above, this may underestimate the true provider costs for pneumonia. The rationale for using Medicare reimbursement rates was explained above.
BSE dysphagia program arm
All the probabilities and costs used in the arm of the decision tree that represents a BSE dysphagia program, along with names of the appropriate variables, are presented in Table S-2. The BSE dysphagia program in this arm is modeled after Odderson, Keaton and McKenna, 1995. In such a program nurses give a preliminary bedside assessment. In that study 39 percent of acute stroke patients failed the preliminary assessment, and these were referred for a full BSE (1.5 billable hours) by an SLP. Those patients are also given followup of 15 minutes SLP therapy daily for 6 days. In addition, Odderson et al. (Odderson, Keaton, and McKenna, 1995) reported that the placement of percutaneous endoscopic gastrostomy (PEG) tubes went from 8.3 percent of stroke patients in the year prior to their BSE program to 7.3 percent during their program. This is a difference of 1 percent. Therefore, we subtracted 1 percent of the cost of PEG tube placement from the costs of the BSE program arm. In the tree, the variable Etube represents these effects of the program on tube placement rates.
The effect of the dysphagia program on aspiration pneumonia is calculated in the tree as the reduction in relative risk (RRR) subtracted from 1 and multiplied times the probability of pneumonia with no-program. This method of calculating the pneumonia probability for the dysphagia program allows us to carry out sensitivity analyses in which either or both the RRR or the no-program pneumonia probabilities are changed. RRR is taken as 0.84. The Odderson et al. program had an RRR of 100 percent. We considered it unrealistic to assume that all dysphagia programs would have this perfect result. Therefore, we averaged this with results reported in the only other two reports we found of dysphagia programs for consecutive acute stroke patients, Nilsson et al., 1998, and Daniels et al., 1998 (Evidence Table S-4). The latter study used VFSS on all patients; however, it reported a result intermediate between the Odderson and the Daniels studies. Thus, we felt it could be averaged with the others. We did not weight this mean, because it is not clear that the differences in RRR among these studies is due only to random variation attributable to study size. At the same time, we were forced to accept this mean RRR for the three studies (84 percent) as the best available estimate of RRR for dysphagia programs, because it is unlikely that any of these studies were large enough to resolve the real differences in RRR that might result from the different methods used in the dysphagia programs.
The costs of a full BSE, SLP therapy, and PEG tube placement are shown in Table S-2 and are detailed along with comparison costs in Evidence Table S-6. Aspiration pneumonia costs are the same as described above in the no-program arm. The rationale for using Medicare reimbursement rates as costs was explained above in the introduction.
The decision tree comparing a no-program arm with a BSE program arm is shown in Figure S-1. Each branch of the tree is described above the branch, and the probability of entering each branch appears below the branch using the tree variable names given in Tables S-1 and S-2. A pound sign (#) in the probability place indicates that the probability is automatically calculated by subtracting the probability of the complementary branch from one. Figure S-2 depicts the same tree with all of the variables and their values shown under the root branch and the formulas used to calculate the costs and effectiveness payoffs at each terminal node. Each pneumonia-free branch provides an effectiveness payoff of 1; each aspiration pneumonia branch provides an effectiveness payoff of 0. There are no pneumonia costs associated with the aspiration pneumonia-free branches; and the cost of aspiration pneumonia is assigned to each aspiration pneumonia branch. In addition, all branches in the dysphagia program arm are assigned the cost of a full BSE and the cost of SLP therapy, all multiplied by the proportion of patients referred by the preliminary assessment to SLP BSE and therapy (Evidence Table S-2).
Results
Figure S-3 presents the tree with the expected costs calculated. Expected costs are the average costs for each arm. Figure S-4 presents the tree with expected pneumonia rate calculated. The expected values in this tree represent the proportion of pneumonia-free patients in each arm. Results are shown in text form in Table S-3. The dysphagia program arm has an expected cost of $174 per stroke patient, and an effectiveness of 98.7 percent pneumonia-free patients. The no-program arm has an expected cost of $177, and an effectiveness of 91.8 percent pneumonia-free patients. Thus, the BSE dysphagia program arm is both more effective and less expensive than no-program. In cost-effectiveness analysis, this is termed dominance.
The difference in cost between the two arms is $4, in favor of the BSE program. The difference in effectiveness is 6.9 percent, in favor of the BSE program. In other words, the BSE program saved $4 per stroke patient and prevented 6.9 percent of the stroke patients from getting aspiration pneumonia.
This effectiveness is not a new finding calculated by the tree but strictly reflects the 84 percent RRR fed into the tree combined with the no-program pneumonia risk of 8.2 percent fed into the tree: 0.84 RRR X 8.2 percent pneumonia = 6.9 percent of stroke patients prevented from getting pneumonia. A tree is not required to obtain that result, rather it is a given derived from the analysis in the main body of the assessment, and with certain caveats presented there. The tree takes this given effect and calculates the net cost of obtaining this effect. In this case, there was a negative net cost, or a savings.
Sensitivity Analysis
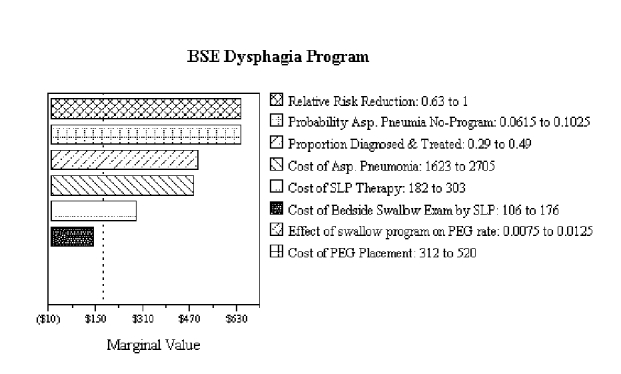
We carried out sensitivity and threshold analyses to determine how the results of the tree were sensitive to changes in the variables in the tree. To determine the relative sensitivity of the marginal cost-effectiveness to changes in the variables, we varied each variable by a fixed ratio of plus or minus 25 percent, a method called tornado diagram analysis. The tornado diagram is shown in Figure S-5 and the text results of the sensitivity analysis are shown in Table S-4.
Variations in the base risk of pneumonia in patients who do and do not undergo a dysphagia program has the largest impact on incremental cost-effectiveness. A 25 percent reduction from the base risk causes the incremental cost-effectiveness of the dysphagia program to increase to a net cost of $1,228 per pneumonia case. The amount of pneumonia risk reduction for the dysphagia program has a similar impact on the incremental cost-effectiveness. The proportion of patients being treated for dysphagia has somewhat less influence on incremental cost-effectiveness, and costs of specific procedures have even less influence.
The results of the tornado analysis show two things. First, the numbers of pneumonia cases, with and without the dysphagia program, most strongly influence the incremental cost-effectiveness of a dysphagia program. Costs of dysphagia diagnosis and therapy have less influence. Efforts to determine more precisely the precise values of these variables should focus on pneumonia risk without a dysphagia program and the amount of reduction of that risk provided by a program. Second, even if a more expensive diagnostic procedure were used (for example, VFSS), moderate changes in this cost do not lead to large values for the incremental cost-effectiveness of the dysphagia program (this possibility is analyzed further below in a tree modeling a VFSS dysphagia program). Over all variables, the results are favorable enough that it seems unlikely that moderate changes in input variables will result in the dysphagia program's having an unacceptable cost-effectiveness. As noted in the introduction to this supplemental analysis, this should be true because we used conservative cost assumptions.
Threshold Analysis
We also calculated the threshold value for each variable. A threshold is that point at which a change in any of the variables causes a change in the conclusions derived from the tree. In this case, the threshold is between a dominance situation, where the diagnosis and treatment of dysphagia would lower costs and improve outcomes, and a situation in which diagnosis and treatment of dysphagia would increase costs while still improving outcomes. In the latter situation, the individual making a decision on whether a dysphagia program is worthwhile must make his or her own judgment about what is a reasonable price to pay to avoid one case of aspiration pneumonia.
Table S-5 shows the threshold value for each variable, beyond which the BSE program arm becomes more costly than the no-program arm (the probabilities entered into the tree do not allow for the BSE program arm to be less effective than no-program).
These thresholds are of interest, because they demonstrate how much the probabilities and costs we used in the tree would have to change in order to reverse the conclusion that a dysphagia program saves money. However, it should be understood that considering the threshold to be where dominance ends (that is, where the dysphagia program begins to cost money rather than save) is not the most realistic way to carry out threshold analysis. Most consumers and policymakers would not require that a program save money to be a success, but would be willing to spend some practical amount to prevent pneumonia. In that case one should choose the cost of pneumonia prevention that is considered the practical limit and let that be the threshold. However, that practical limit may vary for different readers, and we have no basis for choosing such a limit; therefore, we confine ourselves to the dominance threshold. Because most readers would be willing to pay some amount to prevent pneumonia, using the dominance threshold means we are underestimating the amount these variables would have to change to reach any practical threshold. In other words, this is necessarily a very conservative threshold analysis.
The variable closest to a threshold is the probability of aspiration pneumonia for the no-program arm. When pneumonia without a program is less than the threshold of 7.5 percent, there will be so few cases of aspiration pneumonia compared with the number of dysphagia patients diagnosed and treated, that the savings from prevented pneumonia will not completely offset the costs of dysphagia diagnosis and treatment, and the program will begin to cost a small amount of money to prevent pneumonia. This has implications for care settings with a lower frequency of pneumonia than that found in stroke patients within the first 2 weeks of acute care. Rehabilitation centers and nursing homes are likely to have lower pneumonia frequencies than acute-care facilities. However, these latter facilities may not need to diagnose and treat the same proportion of patients as an acute-care facility (39 percent in our base case).
Another variable that is of interest is the cost of SLP therapy. This would need to increase by only 18 to begin to increase costs of a dysphagia program over those of not having such a program. This may be of little concern, because the increase would not be steep, and there may be important quality-of-life benefits for patients that would be worth a small increase in cost. This is further discussed below, in the section on two-way sensitivity analysis.
Two-Way Sensitivity Analysis
While a threshold analysis is useful for determining which variables may possibly affect the cost-effectiveness of a swallowing program, it only tests one variable at a time. Two-way sensitivity analysis allows testing of simultaneous changes in two variables.
The DATA software used to create the decision trees and perform one-way sensitivity analysis is not capable of two-way sensitivity analysis of incremental cost-effectiveness. Therefore, separate two-way analyses of cost and effectiveness were performed, with the results exported into text files. The text files were imported into a Microsoft Excel spreadsheet (Office 97 SR-1: Microsoft Corp., Redmond WA) developed by us. The spreadsheet calculates incremental cost and incremental effectiveness for each pair of values, then calculates incremental cost-effectiveness, and draws a three-dimensional graph of the results.
The first two-way analysis examined the effects of variations in aspiration pneumonia rate in patients not undergoing the dysphagia program, and variations in risk reduction brought about by the program. These are the variables that determine pneumonia rates in the two groups. Figure S-6 and Table S-6 show the results of this analysis for the BSE dysphagia program tree. This analysis demonstrates why two-way analysis is valuable. Only when both of these variables are relatively unfavorable (back corner of graph) does the dysphagia program greatly increase net costs. If one variable is favorable and the other unfavorable (front edge of graph and right edge of graph), net cost is decreased by the dysphagia program. In other words, the dysphagia program is dominant over most of the range considered. Even at the least favorable combination considered (base pneumonia rate: 7.4 percent, risk reduction with dysphagia program 70 percent), the dysphagia program costs only $639 per pneumonia case prevented.
The next two-way sensitivity analysis was performed on the most important cost variables: the cost of the BSE and the cost of swallow therapy performed by the SLP. Results are shown in Figure S-7 and Table S-7. They show that the net cost per pneumonia case prevented increases greatly if the cost of swallow therapy is increased. But therapy by an SLP may cost little more than $200. The peak incremental cost-effectiveness is about $6,000 per pneumonia case prevented when the exam costs about $400 and therapy costs about $1000.
The final two-dimensional analysis is useful for assessing the tradeoff between cost and effectiveness of the diagnostic test. The variables in the analysis are the cost of the BSE and pneumonia risk reduction (effect size) of the total dysphagia program. With this analysis, one can determine the incremental cost-effectiveness of a dysphagia program with a different test just by substituting the appropriate cost and pneumonia reduction values into Figure S-8 and Table S-8. The figures show that variations in both cost and risk reduction have a substantial effect on cost-effectiveness. The maximum incremental cost-effectiveness over the variable ranges included in the analysis (exam cost $400, effectiveness 70 percent RRR) is just over $2,000 per pneumonia case prevented.
Cost-Effectiveness of a VFSS Dysphagia Program Compared with No Program
Tree Construction
Next we altered the cost-effectiveness decision tree to model a program that used a VFSS (modified barium swallow) rather than a BSE for the SLP evaluation of patients suspected of dysphagia at a preliminary exam. In the main evidence report we found no reliable data on the extent of improvement in aspiration pneumonia reduction that might occur with the use of VFSS compared with BSE. Thus, for the base-case tree for a VFSS program, we were forced to use the same effectiveness probability as for the BSE program above; however, in the sensitivity analysis for this tree we examined various levels of improvement in pneumonia prevention for the VFSS compared to the BSE. We changed the cost of the exam to reflect the 1997 Medicare reimbursement for an SLP administered VFSS ($218: 74230, cinema X-ray throat/esophagus; 92525, oral function evaluation; 1.5 SLP billable hours). For this tree, the variables in the no-program arm are the same as above. In addition, all the variables in the VFSS dysphagia program arm are also the same as above, except for the cost of exam. Therefore, the structure of the trees is the same as those for the BSE dysphagia program (see Figures S-1 through S-4).
Results
Table S-9 shows the results of the cost-effectiveness analysis for a VFSS dysphagia program. If the VSS program were no more effective in reducing aspiration pneumonia frequency than a BSE program, the VFSS program would cost an additional $26 per stroke patient (net), or $380 per case of aspiration pneumonia prevented. Furthermore, because of the known ability of VFSS to detect more cases of aspiration than a BSE, there is the potential to offset some of this additional cost by preventing more cases of aspiration pneumonia. Because of a lack of data we do not know how much more aspiration pneumonia would be prevented by VFSS; however, with threshold analysis we can estimate how much improvement in prevention would be required to offset the additional cost.
Also, as in the above discussion on BSE threshold analysis, placing the threshold where dominance ends is an extremely conservative way to perform a threshold analysis. A well-designed clinical trial to determine the comparative effectiveness of the two dysphagia programs would be required to determine exactly how much improvement VFSS might provide in terms of pneumonia prevention.
Table S-10 shows the results of the sensitivity analysis of the VFSS program tree and Figure S-9 shows the tornado diagram. The tree is most sensitive to the risk of pneumonia in the no-program arm and the amount of RRR in the VFSS dysphagia program arm. The next most sensitive variable is the proportion of patients referred for VFSS diagnosis and treatment. The tree is only moderately sensitive to any of the costs.
Table S-11 shows the thresholds for the variables in the VFSS program tree. The base-case reduction in relative risk for aspiration pneumonia used in the tree was 84 percent. The threshold analysis indicated that this would need to increase to 91 percent to make the VFSS program dominant in cost-effectiveness (both more effective and less expensive than no program). This would be an 8.3 percent proportional increase in effect in pneumonia prevention. Considering that some cases of aspiration are missed by a BSE and are detected by VFSS, it seems possible that a VFSS program could achieve this much improvement over a BSE dysphagia program.
Two-Way Sensitivity Analysis
Our first two-way analysis examined the effects of aspiration pneumonia rate in patients not undergoing the dysphagia program and risk reduction brought about by the program. These are the variables that determine pneumonia rates in the two groups. Figure-S-10and Table S-12show this analysis for the BSE tree. Only when both of these variables are relatively unfavorable (back corner of graph) does the dysphagia program increase costs. If one is favorable and the other unfavorable (front edge of graph and right edge of graph), net cost is decreased by the dysphagia program. In other words, the dysphagia program is dominant over most of the range considered. At the least favorable combination considered (base pneumonia rate 7.4 percent, risk reduction with dysphagia program 70 percent), the dysphagia program costs $1,219 per pneumonia case prevented.
The next two-way sensitivity analysis was performed on the most important cost variables: the cost of the VFSS and the cost of swallow therapy performed by the SLP. Results are shown in Figure S-11and Table S-13. They show that net cost per pneumonia case prevented increases greatly if the cost of swallow therapy is increased. But therapy by an SLP may cost little more than $200. The peak incremental cost-effectiveness is about $6,000 per pneumonia case prevented when the cost of the exam is around $500 and the cost of therapy is around $1,000.
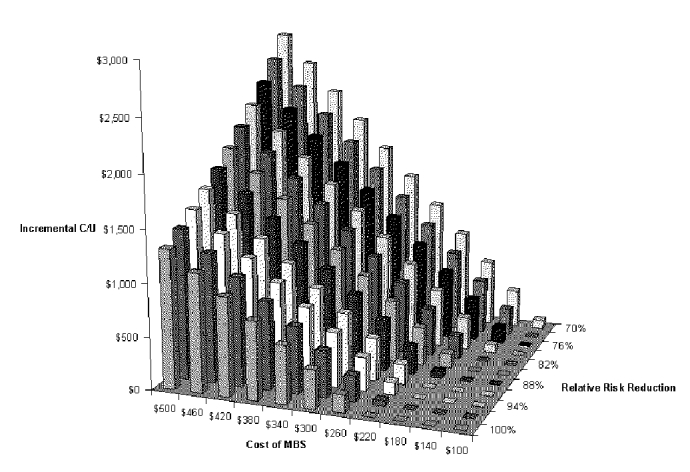
Our final two-way analysis is useful for assessing the tradeoff between cost and effectiveness of the diagnostic test. The variables in the analysis are cost of the VFSS and pneumonia risk reduction (effect size) of the total dysphagia program. With this analysis, one can determine the incremental cost-effectiveness of a dysphagia program with a different test just by substituting the appropriate cost and pneumonia reduction values into Figure S-12 and Table S-14. The figure shows that both cost and effect size have a substantial effect on cost-effectiveness. The maximum incremental cost-effectiveness is just under $3,000 per pneumonia case prevented, if the cost of the exam is around $500 and the reduction in relative risk is around 70 percent.
Supplemental Analysis Conclusions
The conclusions derived from this decision tree and cost-effectiveness analysis should be viewed as our best guess, given the available data. Many of the assumptions included in this model come from evidence of only moderate reliability. For example, the effectiveness data comes from historically controlled case series that could be confounded by changes in stroke patient management other than dysphagia management. There is extensive discussion of the reliability of these data in the main analysis. Nevertheless, taking these historically controlled case series results as crude estimates of the effectiveness of a BSE dysphagia program, and taking the present Medicare reimbursements as the costs, our cost-effectiveness analysis indicates that there would likely be little or no change in the net cost of managing stroke patients in an acute-care setting if a dysphagia program is implemented to reduce aspiration pneumonia. The costs of dysphagia diagnosis and treatment would be approximately balanced by the savings in aspiration pneumonia treatment. Because of limitations in available data, this limited outcome of pneumonia prevention must be taken as representative of the other important patient outcomes of dysphagia-related malnutrition, dehydration, and QOL that we were unable to include in the analysis. Dysphagia diagnosis and therapy costs relating to these have unavoidably been included here in our pneumonia analysis, while the monetary and QOL costs of these conditions and the savings for their prevention have not. Thus, the additional savings (monetary or QOL) from preventing or ameliorating these must be considered in addition to the savings from pneumonia prevention, even though we were unable to calculate this.
Our sensitivity and threshold analyses give some idea of how much our cost and effectiveness estimates would have to be changed to invalidate this result. If certain single variables were changed by about 10 percent, then a BSE dysphagia program would begin to increase per-patient costs, unless another variable changed to offset that cost (e.g., if fewer patients were referred for SLP BSE evaluation and therapy). Such a change in this latter variable would in fact be likely if the aspiration pneumonia frequency decreased because the patient population had less severe neurologic disease.
Assuming no improvement in pneumonia prevention, a VFSS dysphagia program would cost more than a BSE program because of the additional expense of the exam. All other variables being equal to the BSE program, a VFSS program would not be dominant over the no-program scenario, but would instead cost an additional $26 per stroke patient, or $380 per case of aspiration pneumonia prevented. However, the VFSS program would only have to improve aspiration pneumonia prevention by 8 percent proportionally over a BSE program to become dominant (less expensive and more effective) over a no-program situation. In light of the expected increase in detection of aspiration by VFSS, such a small improvement in pneumonia prevention is possible. VFSS is preferred by many clinicians, not only because of the improvement in aspiration detection, but also because of the additional information on structural and functional aspects of dysphagia that aid in the planning and management of diet and therapy. Our cost-effectiveness analysis indicates that these additional advantages would be provided by VFSS with little or no increase in costs likely.
[Supplemental Analysis Tables]
Table S-1. Probabilities and Costs for the No-program Arm
| Item | Tree variable name | Probability or cost | Source |
|---|---|---|---|
| Proportion of stroke patients acquiring aspiration pneumonia | pAPNoProg | 0.082 | N-Weighted mean for Haerer and Smith, 1974; Young and Durant-Jones, 1990; Odderson, Keaton and McKenna, 1995; Barker and Mullooly, 1997 |
| Cost of aspiration pneumonia as comorbidity for stroke patient | CostAspPneum | $2,164 | 1997 Medicare reimbursement: difference between stroke (DRG17) and stroke with comorbid condition (DRG16) |
Table S-2. Probabilities and Costs for the BSE Dysphagia Program Arm
| Item | Tree variable name | Probability or cost | Source |
|---|---|---|---|
| Reduction in relative risk | RRR | 0.84 | Nilsson, Ekberg, Olsson et al., 1998 evaluable patients; Odderson, Keaton, and McKenna, 1995 2nd year of program; Daniels, Brailey, Priestly et al., 1998: unweighted mean adjusted for 2 week LOS |
| Proportion of stroke patients who fail preliminary test and are referred to SLP for BSE and therapy | PDiag_Treat | 0.39 | Odderson, Keaton, and McKenna, 1995 |
| Cost of SLP BSE | CostBSE | $141 | 1997 Medicare reimbursement |
| Cost of SLP therapy | CostSLPTherapy | $242 | 1997 Medicare reimbursement for 15 min. sessions with SLP on 6 days: 6 X $28.96 92526 Oral function therapy+ 0.25X$45.23 15 min. of SLP billable hours |
| Cost of PEG tube placement | CostPEG | $416 | 1997 Medicare reimbursement: $339 43246 Place gastrostomy tube + $77 74230 Cinema Xray throat/esophagus |
| Decrease in proportion of stroke patients who receive a PEG tube, if dysphagia program is implemented | Etube | 0.01 | Odderson, Keaton, and McKenna, 1995 |
| Cost of case of aspiration pneumonia | CostAspPneum | $2,164 | 1997 Medicare reimbursement -- difference between stroke DRG17 and stroke with comorbid condition DRG16 |
Table S-3. Results of the Comparison of a No-program Arm with a BSE Program Arm
| No-program | BSE program | |
|---|---|---|
| Effectiveness | 91.8% aspiration pneumonia-free patients | 98.7% aspiration pneumonia-free patients |
| Marginal Effectiveness | 6.9% of stroke patients had aspiration pneumonia prevented | |
| Cost | $177 per stroke patient | $174 per stroke patient |
| Marginal Cost | $4 per stroke patient | |
| Marginal Cost-effectiveness | Dominated by BSE program | $4 saved per stroke patient, 6.9% of stroke patients had aspiration pneumonia prevented |
Table S-4. Results of Sensitivity Analysis - BSE
| Variable | Base case | Lower limit (-25%) | Upper limit (+25%) | Maximum incremental CE |
|---|---|---|---|---|
| Base pneumonia risk | 8.2% | 6.15% | 10.25% | $647 |
| Risk reduction with swallow program | 84% | 63% | 100% 1 | $647 |
| Proportion diagnosed and treated | 39% | 29% | 49% | $500 |
| Cost of pneumonia | $2,164 | $1,623 | $2,705 | $485 |
| Cost of swallow therapy | $242 | $182 | $303 | $290 |
| Cost of BSE | $141 | $106 | $177 | $142 |
| Effect of swallow program on need for PEG tube | -1% | -0.75% | -1.25% | 2 |
| Cost of PEG tube | $416 | $312 | $520 | 2 |
|
1
Increased by less than 25%. 2 Dysphagia program dominated no program at all tested values of the variable. | ||||
Table S-5. Thresholds for Variables in BSE Program versus No Program
| Variable | Threshold | Values used in tree | Proportional change in tree value required to pass threshold |
|---|---|---|---|
| Reduction in relative risk | <0.74 | 0.84 | -12% |
| Probability of aspiration pneumonia for no-program | <0.075 | 0.082 | -11% |
| Proportion of stroke patients who fail preliminary test and are referred to SLP for BSE and therapy | >0.435 | 0.39 | +12% |
| Cost of case of aspiration pneumonia | <$1,935 | $2,164 | -11% |
| Cost of SLP therapy | >$286 | $242 | +18% |
| Cost of SLP BSE | >$185 | $141 | +31% |
| PEG tube placement absolute decrease | 1 | 1% | |
| Cost of PEG tube placement | 1 | $416 | |
| 1 No threshold found |
Table S-6. Two-way Sensitivity Analysis for Base neumonia Rate and Risk reduction with BSE Dysphagia Program
| Incremental Cost-Effectiveness | ||||||||||||
|---|---|---|---|---|---|---|---|---|---|---|---|---|
| P(AP) | ||||||||||||
| RRR | 7.4% | 7.8% | 8.1% | 8.5% | 8.8% | 9.2% | 9.6% | 9.9% | 10.3% | 10.6% | 11.0% | |
| 100% | dominates | dominates | dominates | dominates | dominates | dominates | dominates | dominates | dominates | dominates | dominates | |
| 97% | dominates | dominates | dominates | dominates | dominates | dominates | dominates | dominates | dominates | dominates | dominates | |
| 94% | dominates | dominates | dominates | dominates | dominates | dominates | dominates | dominates | dominates | dominates | dominates | |
| 91% | dominates | dominates | dominates | dominates | dominates | dominates | dominates | dominates | dominates | dominates | dominates | |
| 88% | $66 | dominates | dominates | dominates | dominates | dominates | dominates | dominates | dominates | dominates | dominates | |
| 85% | $145 | $37 | dominates | dominates | dominates | dominates | dominates | dominates | dominates | dominates | dominates | |
| 82% | $229 | $118 | $17 | dominates | dominates | dominates | dominates | dominates | dominates | dominates | dominates | |
| 79% | $320 | $205 | $100 | $4 | dominates | dominates | dominates | dominates | dominates | dominates | dominates | |
| 76% | $418 | $298 | $189 | $89 | dominates | dominates | dominates | dominates | dominates | dominates | dominates | |
| 73% | $524 | $399 | $286 | $182 | $86 | dominates | dominates | dominates | dominates | dominates | dominates | |
| 70% | $639 | $509 | $391 | $282 | $183 | $91 | $6 | dominates | dominates | dominates | dominates | |
Table S-7. Two-way Sensitivity Analysis for Cost of Diagnostic Test and Cost of Swallow Therapy with BSE Dysphagia Program
| Incremental Cost-Effectiveness | |||||||||||
|---|---|---|---|---|---|---|---|---|---|---|---|
| C(BSE) | |||||||||||
| C(therapy) | $50 | $85 | $120 | $155 | $190 | $225 | $260 | $295 | $330 | $365 | $400 |
| $1,000 | $3,721 | $3,919 | $4,117 | $4,315 | $4,513 | $4,712 | $4,910 | $5,108 | $5,306 | $5,504 | $5,702 |
| $910 | $3,211 | $3,409 | $3,607 | $3,806 | $4,004 | $4,202 | $4,400 | $4,598 | $4,797 | $4,995 | $5,193 |
| $829 | $2,702 | $2,900 | $3,098 | $3,296 | $3,494 | $3,692 | $3,891 | $4,089 | $4,287 | $4,485 | $4,683 |
| $730 | $2,192 | $2,390 | $2,588 | $2,786 | $2,985 | $3,183 | $3,381 | $3,579 | $3,777 | $3,976 | $4,174 |
| $640 | $1,682 | $1,881 | $2,079 | $2,277 | $2,475 | $2,673 | $2,871 | $3,070 | $3,268 | $3,466 | $3,664 |
| $550 | $1,173 | $1,371 | $1,569 | $1,767 | $1,966 | $2,164 | $2,362 | $2,560 | $2,758 | $2,956 | $3,155 |
| $460 | $663 | $861 | $1,060 | $1,258 | $1,456 | $1,654 | $1,852 | $2,050 | $2,249 | $2,447 | $2,645 |
| $370 | $154 | $352 | $550 | $748 | $946 | $1,145 | $1,343 | $1,541 | $1,739 | $1,937 | $2,135 |
| $280 | dominates | dominates | $40 | $239 | $437 | $635 | $833 | $1,031 | $1,229 | $1,428 | $1,626 |
| $190 | dominates | dominates | dominates | dominates | dominates | $125 | $324 | $522 | $720 | $918 | $1,116 |
| $100 | dominates | dominates | dominates | dominates | dominates | dominates | dominates | $12 | $210 | $408 | $607 |
Table S-8. Two-way Sensitivity Analysis for Cost of Diagnostic Test and Risk Reduction with BSE Dysphagia Program
| Incremental Cost-Effectiveness Ratio | |||||||||||
|---|---|---|---|---|---|---|---|---|---|---|---|
| Cost of Bedside Swallow Exam | |||||||||||
| RRR | $50 | $85 | $120 | $155 | $190 | $225 | $260 | $295 | $330 | $365 | $400 |
| 100% | dominates | dominates | dominates | dominates | dominates | $6 | $173 | $339 | $506 | $672 | $839 |
| 97% | dominates | dominates | dominates | dominates | dominates | $73 | $245 | $417 | $588 | $760 | $932 |
| 94% | dominates | dominates | dominates | dominates | dominates | $145 | $322 | $499 | $676 | $853 | $1,030 |
| 91% | dominates | dominates | dominates | dominates | $38 | $221 | $404 | $587 | $770 | $953 | $1,136 |
| 88% | dominates | dominates | dominates | dominates | $113 | $302 | $491 | $681 | $870 | $1,059 | $1,248 |
| 85% | dominates | dominates | dominates | dominates | $194 | $389 | $585 | $781 | $977 | $1,173 | $1,369 |
| 82% | dominates | dominates | dominates | $77 | $280 | $483 | $686 | $889 | $1,092 | $1,295 | $1,498 |
| 79% | dominates | dominates | dominates | $162 | $373 | $583 | $794 | $1,005 | $1,215 | $1,568 | $1,787 |
| 76% | dominates | dominates | $35 | $254 | $473 | $692 | $911 | $1,130 | $1,349 | $1,568 | $1,787 |
| 73% | dominates | dominates | $125 | $353 | $581 | $809 | $1,037 | $1,265 | $1,493 | $1,721 | $1,949 |
| 70% | dominates | dominates | $223 | $461 | $669 | $937 | $1,174 | $1,412 | $1,650 | $1,888 | $2,126 |
Table S-9. Results of the Comparison of a VFSS Program with a No-program Arm
| No-program | VFSS program | |
|---|---|---|
| Effectiveness | 91.8% aspiration pneumonia-free patients | 98.7% aspiration pneumonia-free patients |
| Marginal effectiveness | 6.9% of stroke patients had aspiration pneumonia prevented | |
| Cost | $177 per stroke patient | $204 per stroke patient |
| Marginal cost | $26 per stroke patient | |
| Marginal cost-effectiveness | $380 per case of aspiration pneumonia prevented |
Table S-10. Results of Sensitivity Analysis
| Variable | Base case | Lower limit(-25%) | Upper limit(+25%) | Maximum incremental CE |
|---|---|---|---|---|
| Base pneumonia risk | 8.2% | 6.15% | 10.25% | $1,228 |
| Risk reduction with swallow program | 84% | 63% | 100% 1 | $1,228 |
| Proportion diagnosed and treated | 39% | 29% | 49% | $1,048 |
| Cost of pneumonia | $2,164 | $1,623 | $2,705 | $921 |
| Cost of swallow therapy | $242 | $182 | $303 | $726 |
| Cost of MBS | $218 | $164 | $273 | $692 |
| Effect of swallow program on need for PEG tube | -1% | -0.75% | -1.25% | $395 |
| Cost of PEG tube | $416 | $312 | $520 | $395 |
| 1 Increased by less than 25% |
Table S-11. Thresholds for Variables in VFSS Program versus No Program
| Variable | Threshold | Values used in tree | Proportional change in tree value required to pass threshold |
|---|---|---|---|
| RRR | <0.91 | 0.84 | + 8% |
| Probability of aspiration pneumonia for no program | <0.088 | 0.082 | + 7% |
| Proportion of stroke patients who fail preliminary test and are referred to SLP for BSE and therapy | >0.36 | 0.39 | - 7% |
| Cost of case of aspiration pneumonia | <$2,335 | $2,164 | + 8% |
| Cost of SLP therapy | >$209 | $242 | -14% |
| Cost of SLP BSE | >$185 | $218 | -15% |
| PEG tube placement absolute decrease | 1 | 1% | |
| Cost of PEG tube placement | 1 | $416 | |
| 1 No threshold found |
Table S-12. Two-way Sensitivity Analysis for Base Pneumonia Rate and Risk Reduction with VFSS Dysphagia Program
| Incremental Cost-Effectiveness Ratio | |||||||||||
|---|---|---|---|---|---|---|---|---|---|---|---|
| P(AP) | |||||||||||
| RRR | 7.4% | 7.8% | 8.1% | 8.5% | 8.8% | 9.2% | 9.6% | 9.9% | 10.3% | 10.6% | 11.0% |
| 100% | $204 | $94 | dominates | dominates | dominates | dominates | dominates | dominates | dominates | dominates | dominates |
| 97% | $277 | $164 | $61 | dominates | dominates | dominates | dominates | dominates | dominates | dominates | dominates |
| 94% | $355 | $238 | $132 | $34 | dominates | dominates | dominates | dominates | dominates | dominates | dominates |
| 91% | $438 | $318 | $208 | $107 | $14 | dominates | dominates | dominates | dominates | dominates | dominates |
| 88% | $527 | $402 | $288 | $184 | $89 | $1 | dominates | dominates | dominates | dominates | dominates |
| 85% | $622 | $493 | $375 | $267 | $168 | $77 | dominates | dominates | dominates | dominates | dominates |
| 82% | $724 | $590 | $468 | $356 | $254 | $159 | $71 | dominates | dominates | dominates | dominates |
| 79% | $834 | $695 | $568 | $452 | $345 | $247 | $156 | $72 | dominates | dominates | dominates |
| 76% | $952 | $807 | $676 | $555 | $444 | $342 | $248 | $160 | $79 | $3 | dominates |
| 73% | $1,080 | $929 | $792 | $667 | $552 | $445 | $347 | $256 | $171 | $92 | $18 |
| 70% | $1,219 | $1,062 | $919 | $788 | $668 | $557 | $455 | $360 | $271 | $189 | $112 |
Table S-13. Two-way Sensitivity Analysis for Cost of Diagnostic Test and Cost of Swallow Therapy with VFSS Dysphagia Program
| Incremental Cost-Effectiveness Ratio | |||||||||||
|---|---|---|---|---|---|---|---|---|---|---|---|
| C(MBS) | |||||||||||
| C(therapy) | $100 | $140 | $180 | $220 | $260 | $300 | $340 | $380 | $420 | $460 | $500 |
| $1,000 | $4,004 | $4,230 | $4,457 | $4,683 | $4,910 | $5,136 | $5,363 | $5,589 | $5,816 | $6,042 | $6,269 |
| $910 | $3,494 | $3,721 | $3,947 | $4,174 | $4,400 | $4,627 | $4,853 | $5,080 | $5,306 | $5,533 | $5,759 |
| $820 | $2,985 | $3,211 | $3,438 | $3,664 | $3,891 | $4,117 | $4,344 | $4,570 | $4,797 | $5,023 | $5,249 |
| $730 | $2,475 | $2,702 | $2,928 | $3,155 | $3,381 | $3,607 | $3,834 | $4,060 | $4,287 | $4,513 | $4,740 |
| $640 | $1,966 | $2,192 | $2,418 | $2,645 | $2,871 | $3,098 | $3,324 | $3,551 | $3,777 | $4,004 | $4,230 |
| $550 | $1,456 | $1,682 | $1,909 | $2,135 | $2,362 | $2,588 | $2,815 | $3,041 | $3,268 | $3,494 | $3,721 |
| $460 | $946 | $1,173 | $1,399 | $1,626 | $1,852 | $2,079 | $2,305 | $2,532 | $2,758 | $2,985 | $3,211 |
| $370 | $437 | $663 | $890 | $1,116 | $1,343 | $1,569 | $1,796 | $2,022 | $2,249 | $2,475 | $2,702 |
| $280 | dominates | $154 | $380 | $607 | $833 | $1,060 | $1,286 | $1,513 | $1,739 | $1,966 | $2,192 |
| $190 | dominates | dominates | dominates | $97 | $324 | $550 | $776 | $1,003 | $1,229 | $1,456 | $1,682 |
| $100 | dominates | dominates | dominates | dominates | dominates | $40 | $267 | $493 | $720 | $946 | $1,173 |
Table S-14. Two-way Sensitivity Analysis for Cost of Diagnostic Test and Risk Reduction with VFSS Dysphagia Program
| Incremental Cost-Effectiveness Ratio | |||||||||||
|---|---|---|---|---|---|---|---|---|---|---|---|
| Cost of MBS | |||||||||||
| RRR | $100 | $140 | $180 | $220 | $260 | $300 | $340 | $380 | $420 | $460 | $500 |
| 100% | dominates | dominates | dominates | dominates | $173 | $363 | $553 | $744 | $934 | $1,124 | $1,314 |
| 97% | dominates | dominates | dominates | $49 | $245 | $441 | $637 | $833 | $1,030 | $1,226 | $1,422 |
| 94% | dominates | dominates | dominates | $120 | $322 | $524 | $727 | $929 | $1,132 | $1,334 | $1,536 |
| 91% | dominates | dominates | dominates | $195 | $404 | $613 | $822 | $1,031 | $1,240 | $1,449 | $1,658 |
| 88% | dominates | dominates | $59 | $275 | $491 | $708 | $924 | $1,140 | $1,356 | $1,572 | $1,789 |
| 85% | dominates | dominates | $138 | $361 | $585 | $809 | $1,033 | $1,257 | $1,480 | $1,704 | $1,928 |
| 82% | dominates | dominates | $222 | $454 | $686 | $918 | $1,150 | $1,382 | $1,614 | $1,846 | $2,078 |
| 79% | dominates | $72 | $312 | $553 | $794 | $1,035 | $1,276 | $1,516 | $1,757 | $1,998 | $2,239 |
| 76% | dominates | $160 | $410 | $660 | $911 | $1,161 | $1,411 | $1,662 | $1,912 | $2,162 | $2,413 |
| 73% | dominates | $255 | $516 | $777 | $1,037 | $1,298 | $1,558 | $1,819 | $2,080 | $2,340 | $2,601 |
| 70% | $87 | $359 | $631 | $903 | $1,174 | $1,446 | $1,718 | $1,990 | $2,261 | $2,533 | $2,805 |
[Supplemental Analysis Figures]
Figure S-1. Cost-effectiveness Decision Tree for BSE
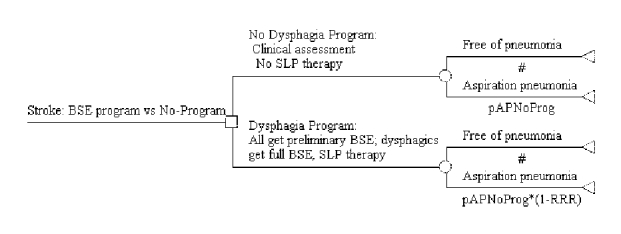
Figure S-2. Cost-effectiveness Decision Tree for BSE Program Showing Variable Base-case Values and Terminal Node Payoffs

Figure S-3. Cost-effectiveness Decision Tree for BSE Program Showing Expected Costs

Figure S-4. Cost-effectiveness Decision Tree for BSE Program Showing Expected Pneumonia Cases

Figure S-5. Tornado Diagram for BSE Dysphagia Program
 No bars are shown for effect of swallow program on PEG rate or for cost of PEG placement because the dysphagia program is dominant and no cost-effectiveness ratio can be calculated for these variables.
Figure S-6. Two-way Sensitivity Analysis for Base Pneumonia Rate and Risk Reduction with BSE Dysphagia Program
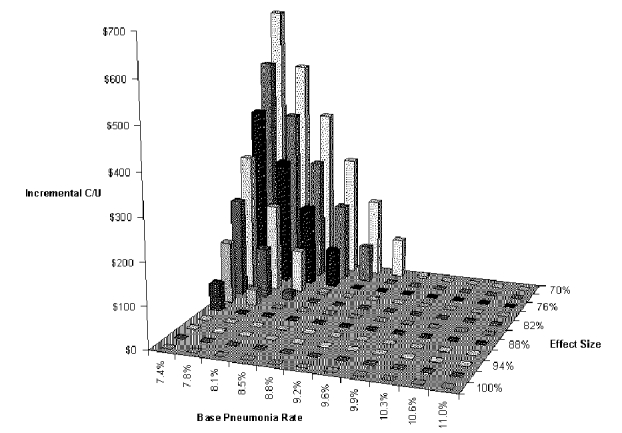
Figure S-7. Two-way Sensitivity Analysis for Cost of Diagnostic Test and Cost of Swallow Therapy with BSE Dysphagia Program
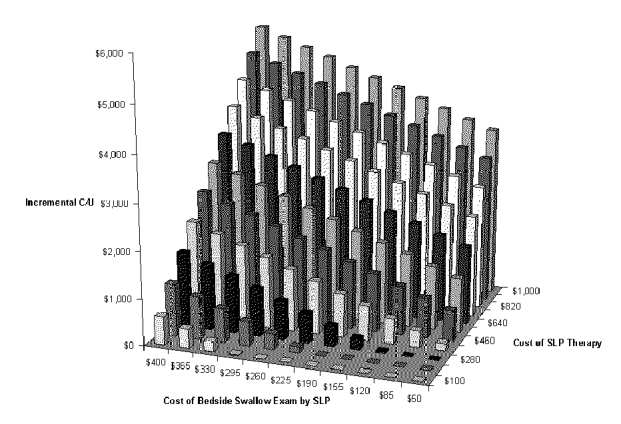
Figure S-8. Two-way Sensitivity Analysis for Cost of Diagnostic Test and Risk Reduction with BSE Dysphagia Program
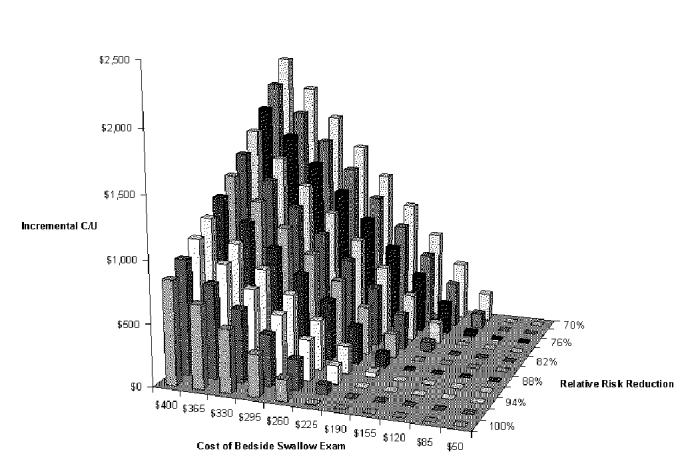
Figure S-9. Tornado Diagram for Dysphagia Program
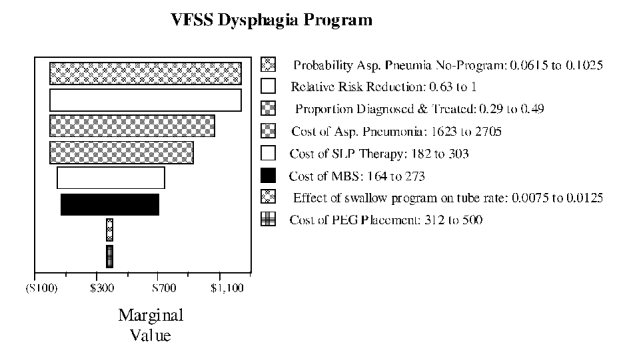
Figure S-10. Two-way Sensitivity Analysis for Base Pneumonia Rate and Risk Reduction with VFSS Dysphagia Program
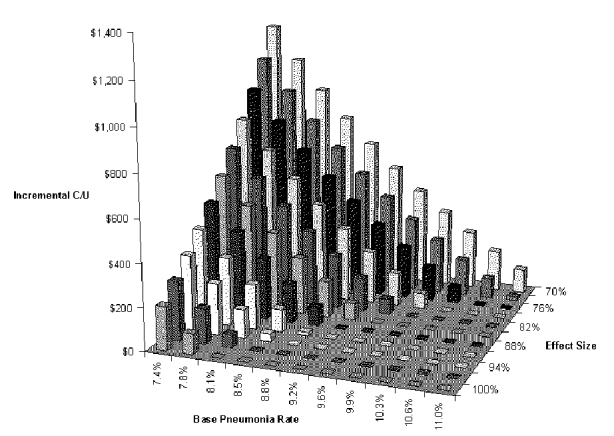
Figure S-11. Two-way Sensitivity Analysis for Cost of Diagnostic Test and Risk Reduction with VFSS Dysphagia Program
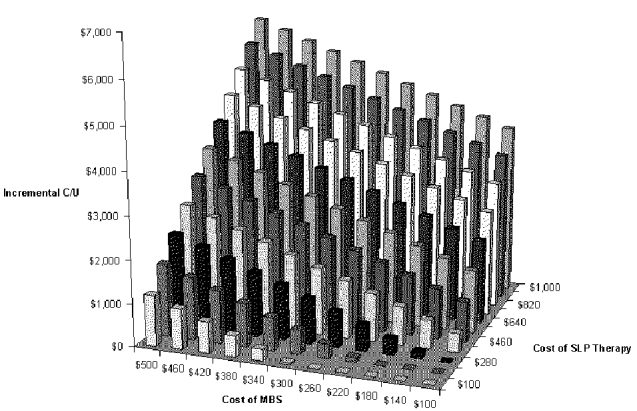
Figure S-12. Two-way Sensitivity Analysis for Cost of Diagnostic Test and Risk Reduction with VFSS Dysphagia Program
- Supplemental Analysis - Diagnosis and Treatment of Swallowing Disorders (Dysphag...Supplemental Analysis - Diagnosis and Treatment of Swallowing Disorders (Dysphagia) in Acute-Care Stroke Patients
- Caenorhabditis elegans Homeobox domain-containing protein (F45D3.2), mRNACaenorhabditis elegans Homeobox domain-containing protein (F45D3.2), mRNAgi|1831517892|ref|NM_001276944.3|Nucleotide
Your browsing activity is empty.
Activity recording is turned off.
See more...