NCBI Bookshelf. A service of the National Library of Medicine, National Institutes of Health.
ECRI Health Technology Assessment Group. Diagnosis and Treatment of Swallowing Disorders (Dysphagia) in Acute-Care Stroke Patients. Rockville (MD): Agency for Health Care Policy and Research (US); 1999 Jul. (Evidence Reports/Technology Assessments, No. 8.)
This publication is provided for historical reference only and the information may be out of date.

Diagnosis and Treatment of Swallowing Disorders (Dysphagia) in Acute-Care Stroke Patients.
Show detailsIn the Future Research section of this evidence report, we described a multicenter, multiarm, randomized trial that would examine the impact of two to four different dysphagia diagnosis and treatment strategies on patient outcomes. The four diagnostic methods of interest were a noninstrumented test alone (the control group), and three groups of noninstrumented followed by a single instrumented exam. We also suggested that the primary intergroup comparison be on the incidence rate of aspiration pneumonia after treatment, and noted that this trial (or any practical trial) might not have the statistical power to detect certain differences. Therefore, we suggested that a simulated trial be conducted on the basis of the results of the suggested clinical trial. Such a simulation involves decision analysis. Another advantage of incorporating the suggested trial's results into a decision analysis is that we can use the same model to determine the incremental cost-effectiveness of the various diagnostic strategies. When these latter types of analyses are performed, small between-group outcome differences can sometimes be seen to result in substantial cost-effectiveness differences.
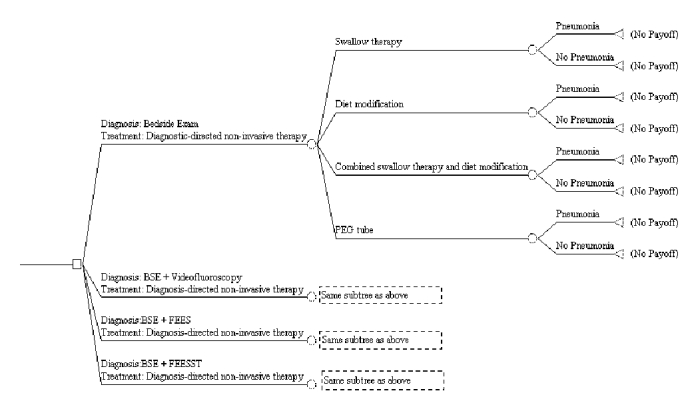
Figure F-1displays a possible structure of such a decision analysis. The instrumented tests shown are used simply as examples and should not be taken as suggestion of which instrumented tests to include in the proposed trial; we leave this up to the investigators. The beginning of the management pathway is at the leftmost side of the tree, and, depending on how patients were randomized in the clinical trial, they pass through the branches of the tree representing each diagnosis and treatment combination until they experience their ultimate outcome - aspiration pneumonia or no pneumonia - at the terminal nodes on the right side of the tree. Aspiration pneumonia is shown because the purpose of the figure is only to illustrate how decision analysis can be used to analyze results. Other outcomes, such as death, malnutrition, or need for a feeding tube, could be substituted for pneumonia or, better yet, also included in this decision tree.
The figure also illustrates one way the results of the clinical trial can be extended by a decision analysis. Thus, what is shown is how data from the trial can be used to determine whether certain patients given certain treatments fare better than those given others. In other words, one can determine whether patients given diet modification fare as well as, say, patients given diet modification plus speech-language therapy.
We suggest that this decision tree also be used to perform a cost-effectiveness analysis. In this case, costs would be stored at the terminal node at the end of each branch on the right side of the tree and would consist of all medical costs incurred during diagnosis and treatment, including any costs for complications that occur as a result of the dysphagia.1 For example, even if the outcome of interest were pneumonia, costs for a temporary feeding tube should be included, in addition to the costs of treating the pneumonia. The cost stored in the tree, then, would be the average cost incurred by each patient in the clinical trial undergoing that particular diagnosis-treatment strategy. Distributions of the incurred costs could also be incorporated into the tree (this would be done for a Monte Carlo analysis; see below for further discussion of these analyses). Cost-effectiveness would then be measured as the incremental cost-effectiveness of a given strategy and/or treatment.
To closer approximate cost-effectiveness from the societal perspective, the decision tree could include additional costs that society would ultimately pay, such as any costs that family members might incur as a result of transporting a patient to a hospital or other care facility. This would provide information at the highest level of evidence in the hierarchy we describe in the Methods section of this evidence report. We note, however, that such analyses are not often conducted because of their difficulty. More practical might be to incorporate information about the prevalence of disease (such as that contained in the Burden of Illness section of this report) to extend the analysis to estimate the total national direct costs of the disease.
Other ways in which the results of the clinical trial can be extended are shown in Figure F-2 Thus, Figure F-2a shows how it is possible use a decision tree to compare the outcomes of those who do and do not experience morbidity. Separate branches can be constructed for each morbidity to determine which is most likely to result in death, and/or which is most costly. Figure F-2b illustrates how the outcomes of patients with different clinical courses can be compared. Thus, in this hypothetical decision tree, patients are followed on the basis of their weight status; feeding tube usage is the short-term outcome of interest. Then the proportion of patients needing feeding tubes and who experience morbidity are compared with the proportion of such patients who do not experience morbidity. This particular analysis, for example, could be conducted to determine: (a) whether patients who lose weight but do not receive a feeding tube fare better or worse than those who do receive a feeding tube, (b) whether such patients fare better than those who maintain or gain weight but who do not get a feeding tube, or (c) whether it is cost-effective to place patients who lose weight on a feeding tube.
It is prudent to consider analyzing the results of any decision tree that results from the suggested clinical trial as a Monte Carlo simulation. In effect, such simulations allow one to model what would happen to a much larger group of patients than one could attain in a clinical trial setting. Further, the results of Monte Carlo simulations are expressed in ways not unlike the results of analyses of clinical trials. Thus, such simulations result in a mean value, standard deviations, and so on. This enables one to ask questions such as: Given that the model suggests that treating silent aspiration improves patient outcomes, what percentage of individuals in the simulated population can be expected to benefit?
The data for a Monte Carlo analysis will be available from the results of the proposed clinical trial. Thus, one will know not only the probability of each outcome, but also the distribution of each outcome. This includes even distributions for dichotomous variables expressed in terms of a proportion (e.g., the proportion of patients who developed pneumonia). This is because from this proportion and the 95 percent confidence intervals (C.I.s) (or any other measure of dispersion) that can surround it, one can calculate the shape of the binomial distribution from which the proportion was drawn. Thus, this tree can be run as a second-order Monte Carlo analysis in which each probability and each cost entered into the tree has an accompanying distribution. In this way the decision tree will include all of the relevant trial data, which will make it a simulated clinical trial that is as similar as possible to an actual clinical trial.
Figure F-1. Suggested Design for Decision Analysis of Diagnosis and Treatment of Dysphagia
 Note: Instrumented exams included in this figure are examples only, and not meant as recommendations for trial inclusion.
Figure F-2. Examples of Other Extensions of Suggested Clinical Trial
F-2a. Morbidity and Mortality Resulting from Each Diagnostic Method
F-2b. Comparing Patients with Different Clinical Courses
Footnotes
- 1
In this section, we use the word cost and the term cost-effectiveness as they are commonly used in the medical literature. However, both are misnomers. What one typically includes in such models are billed charges, not costs.
- Appendix F. Extension and Cost-Effectiveness Analysis of Suggested Clinical Tria...Appendix F. Extension and Cost-Effectiveness Analysis of Suggested Clinical Trial - Diagnosis and Treatment of Swallowing Disorders (Dysphagia) in Acute-Care Stroke Patients
- Appendix A. Evidence Report Staff and Technical Expert Advisory Group - Diagnosi...Appendix A. Evidence Report Staff and Technical Expert Advisory Group - Diagnosis and Treatment of Acute Bacterial Rhinosinusitis
Your browsing activity is empty.
Activity recording is turned off.
See more...