Except where otherwise noted, this work is distributed under the terms of a Creative Commons Attribution-NonCommercial-NoDerivatives 4.0 International licence (CC BY-NC-ND), a copy of which is available at http://creativecommons.org/licenses/by-nc-nd/4.0/
NCBI Bookshelf. A service of the National Library of Medicine, National Institutes of Health.
Edoxaban (Lixiana) [Internet]. Ottawa (ON): Canadian Agency for Drugs and Technologies in Health; 2017 Apr.
The model structure and data inputs are appropriate; therefore, no reanalyses were required in this regard. Rather, unlike the manufacturer’s submission, the CADTH Common Drug Review (CDR) performed a full sequential comparison of all alternatives (warfarin, edoxaban, and other NOACs) on the basis of the submitted model but using relative effects from the manufacturer-submitted network meta-analysis (Table 4).
Table 3Risk Ratio of Event Compared with Edoxaban — Manufacturer-Sponsored NMA
| Warfarin | Rivaroxaban | Apixaban | Dabigatran 110mg | Dabigatran 150mg | |
|---|---|---|---|---|---|
| IS | ▬ | ▬ | ▬ | ▬ | ▬ |
| HS | ▬ | ▬ | ▬ | ▬ | ▬ |
| SEE | ▬ | ▬ | ▬ | ▬ | ▬ |
| MI | ▬ | ▬ | ▬ | ▬ | ▬ |
| Other ICH | ▬ | ▬ | ▬ | ▬ | ▬ |
| TIA | ▬ | ▬ | ▬ | ▬ | ▬ |
| Non-ICH major bleed | ▬ | ▬ | ▬ | ▬ | ▬ |
| CRNMB | ▬ | ▬ | ▬ | ▬ | ▬ |
CRNMB = clinically relevant non-major bleed; HS = hemorrhagic stroke; ICH = intracranial hemorrhage; IS = ischemic stroke; MI = myocardial infarction; NMA = network meta-analysis; SEE = systemic embolic event; TIA = transient ischemic attack.
Table 4
Sequential Cost-Effectiveness — CADTH Reanalysis.
The results of the sequential analysis illustrate that apixaban is cost-effective versus warfarin assuming a willingness to pay of greater than $8,184 per QALY; edoxaban and the other NOACs are dominated by apixaban (i.e., they are less effective and more costly). Other than apixaban, only dabigatran 150 mg was more effective in terms of total QALYs than edoxaban; the incremental cost per QALY gained for dabigatran 150 mg versus edoxaban is $4,182. Similar to the manufacturer’s base-case analysis comparing edoxaban with rivaroxaban, rivaroxaban was dominated by edoxaban in CDR’s full sequential analysis.
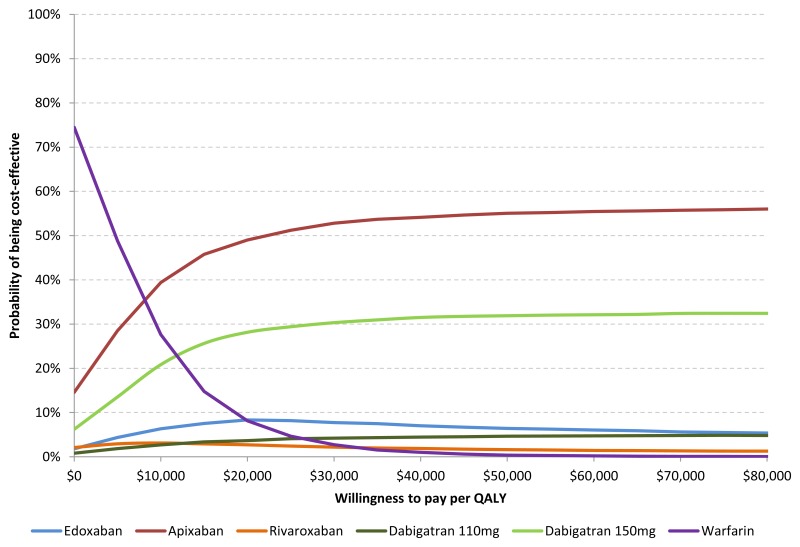
The cost-effectiveness acceptability curve illustrates that at a threshold of $50,000 per QALY, apixaban has the highest probability of being optimal (55.0%). The probability that edoxaban is optimal is 6.4% at a threshold of $50,000 and is between 8.9% and 4.3% for thresholds between $20,000 and $100,000.
Given the findings of the CDR reanalysis, a further analysis was conducted assessing the effect of various price reductions for edoxaban on the cost-effectiveness of edoxaban versus apixaban and dabigatran 150 mg (Table 5). Since the clinical benefits of apixaban and dabigatran 150 mg are greater than that of edoxaban, price reductions were considered for edoxaban to determine their effect on the incremental cost-effectiveness ratio for apixaban and dabigatran 150 mg versus edoxaban.
Table 5
Price Reduction Scenarios.
- CADTH COMMON DRUG REVIEW REANALYSES - Edoxaban (Lixiana)CADTH COMMON DRUG REVIEW REANALYSES - Edoxaban (Lixiana)
- vang-like protein 2 isoform X1 [Rattus norvegicus]vang-like protein 2 isoform X1 [Rattus norvegicus]gi|564381792|ref|XP_006250339.1|Protein
- Edoxaban (Lixiana)Edoxaban (Lixiana)
- Trinitrobenzenesulfonic AcidTrinitrobenzenesulfonic AcidA reagent that is used to neutralize peptide terminal amino groups.<br/>Year introduced: 1991(1975)MeSH
Your browsing activity is empty.
Activity recording is turned off.
See more...

