Included under terms of UK Non-commercial Government License.
NCBI Bookshelf. A service of the National Library of Medicine, National Institutes of Health.
Reeves BC, Scott LJ, Taylor J, et al. The Effectiveness, cost-effectiveness and acceptability of Community versus Hospital Eye Service follow-up for patients with neovascular age-related macular degeneration with quiescent disease (ECHoES): a virtual randomised balanced incomplete block trial. Southampton (UK): NIHR Journals Library; 2016 Oct. (Health Technology Assessment, No. 20.80.)
The Effectiveness, cost-effectiveness and acceptability of Community versus Hospital Eye Service follow-up for patients with neovascular age-related macular degeneration with quiescent disease (ECHoES): a virtual randomised balanced incomplete block trial.
Show detailsCopy of ECHoES Resource use and cost questionnaire for optometrists
Components of a typical monitoring review
TABLE 29
Components of a typical monitoring review and skills required
| Component | Description | Skills required |
|---|---|---|
| History | Discussion of patient-reported vision status in each eye and comparison with status at previous visit | Communication skills |
| Clinical examination: slit lamp biomicroscopy; anterior segment and macula | Clinical examination to ensure absence of VEGF-related adverse events and/or incidental other disease | Slit lamp and ophthalmoscopy skills |
| Visual acuity assessment | Visual acuity recorded as letters read on an ETDRS chart at 4 m (with/without mirrors) using previously recorded refraction. The results will then be recorded in the patient medical record | Test and interpret visual acuity |
| Administration of 1% tropicamide drops | Pupil dilatation. Drops will need to be administered 20 minutes before CF photography and spectral domain coherence tomography | Instillation of eye drops |
| CF photography (or equivalent CF image) | One good-quality photograph centred on the centre of the macula of each eye | Taking and interpreting retinal images |
| Spectral domain OCT | Cube scan of the posterior pole for each eye. Images will be acquired using a standardised protocol, which is pre-set on the OCT machine | Taking and interpreting OCT images |
| Final assessment | A retreatment decision will be made on the basis of the visual acuity data and interpretation of images obtained. The decision and rationale will need to be entered in the patient record | Ability to assess the need for retreatment and arrange necessary follow-up |
Resource use and costs associated with training
The cost of each of the three training activities was calculated by multiplying the time spent on each activity by the unit cost of optometrist time. The average cost per hour of optometrist time was £62.13 (SD £34.62) and its calculation was based on participants’ reports on salary and hours worked (through the health economics questionnaire). Given that our objective was to estimate the cost of optometrist training per monitoring review, each of the three components of costs in the table below was divided by the annual number of patients (after the changes in the practice would take place, as reported by each optometrist in reply to question Q7 in the health economics questionnaire), to obtain the cost of optometrist training per monitoring review, that is £0.89 (SD £1.080).
TABLE 30
Resource use and costs of training
| Training type | Optometrist’s time (minutes), mean (SD) | Optometrist’s cost (£), mean (SD) |
|---|---|---|
| Attending webinars | 120 (0) | 124 (69.26) |
| Revisiting webinars | 90 (68.74) | 96 (111.58) |
| Consulting other resources | 64 (76.21) | 66 (112.35) |
| Observations | 48 | 48 |
Sensitivity analysis 1: three ranibizumab injections and consultations instead of one
TABLE 31
Care cost pathways for sensitivity analysis 1
| Lesion status assessment | Observationsa (%) | Pathways cost (£),b mean (SD) | |
|---|---|---|---|
| Experts | Optometrists | ||
| Reactivated | Reactivated | 795 (39.43) | 2548.83 (67.90) |
| Reactivated | Suspicious | 142 (7.04) | 103.61 (18.51) |
| Reactivated | Quiescent | 57 (2.83) | 51.29 (9.08) |
| Suspicious | Reactivated | 10 (0.50) | 118.12 (16.39) |
| Suspicious | Suspicious | 11 (0.55) | 57.04 (9.10) |
| Suspicious | Quiescent | 14 (0.69) | 52.96 (9.37) |
| Quiescent | Reactivated | 105 (5.21) | 117.14 (32.61) |
| Quiescent | Suspicious | 234 (11.61) | 78.31 (11.53) |
| Quiescent | Quiescent | 648 (32.14) | 51.98 (8.23) |
| Experts | Ophthalmologists | ||
| Reactivated | Reactivated | 736 (36.51) | 2495.81 (70.01) |
| Reactivated | Suspicious | 196 (9.72) | 153.18 (92.25) |
| Reactivated | Quiescent | 62 (3.08) | 77.01 (45.49) |
| Suspicious | Reactivated | 1 (0.05) | 2452.74 (n/a) |
| Suspicious | Suspicious | 17 (0.84) | 68.84 (31.004) |
| Suspicious | Quiescent | 17 (0.84) | 60.57 (17.16) |
| Quiescent | Reactivated | 35 (1.73) | 2493.45 (65.87) |
| Quiescent | Suspicious | 146 (7.24) | 150.34 (95.19) |
| Quiescent | Quiescent | 806 (39.98) | 75.28 (44.72) |
n/a, not applicable.
- a
The number of observations (i.e. vignettes) is 4032, namely 2016 referring to optometrists and 2016 referring to ophthalmologists.
- b
Pathway cost includes the cost of a monitoring consultation and downstream costs (e.g. injections and follow-up visits).
TABLE 32
Impact on cost-effectiveness of sensitivity analysis 1
| Costs and effects | Optometrists (observations, n = 2016) | Ophthalmologists (observations, n = 2016) |
|---|---|---|
| Cost of a monitoring review (£), mean (SD) | 1047.03 (1213.05) | 1015.01 (1168.80) |
| Proportion of correct assessments (SD) | 0.844 (0.363) | 0.854 (0.353) |
| Incremental cost (£) (95% CI) | 32.02 (–60.87032 to 124.9) | |
| Incremental benefit, proportion of correct assessments (95% CI) | –0.0099 (–0.045 to 0.025) | |
| ICER, incremental cost per correct assessmenta | Dominated | |
- a
The 95% CI around the ICER could not be defined.
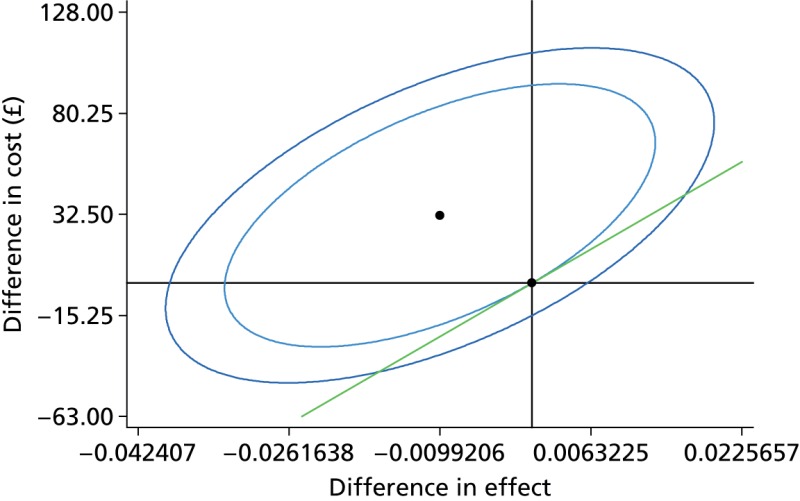
FIGURE 19
Cost-effectiveness plane for sensitivity analysis 1 (inner ellipse: 81%; outer ellipse: 95%).

FIGURE 20
Cost-effectiveness acceptability curve for sensitivity analysis 1.
Sensitivity analysis 2: one aflibercept injection instead of one ranibizumab
TABLE 33
Care cost pathways for sensitivity analysis 2
| Lesion status assessment | Observationsa (%) | Pathways cost (£),b mean (SD) | |
|---|---|---|---|
| Experts | Optometrists | ||
| Reactivated | Reactivated | 795 (39.43) | 1009.24 (45.50) |
| Reactivated | Suspicious | 142 (7.04) | 103.61 (18.51) |
| Reactivated | Quiescent | 57 (2.83) | 51.29 (9.08) |
| Suspicious | Reactivated | 10 (0.50) | 118.12 (16.39) |
| Suspicious | Suspicious | 11 (0.55) | 57.04 (9.10) |
| Suspicious | Quiescent | 14 (0.69) | 52.96 (9.37) |
| Quiescent | Reactivated | 105 (5.21) | 117.14 (32.61) |
| Quiescent | Suspicious | 234 (11.61) | 78.31 (11.53) |
| Quiescent | Quiescent | 648 (32.14) | 51.98 (8.23) |
| Experts | Ophthalmologists | ||
| Reactivated | Reactivated | 736 (36.51) | 956.50 (46.41) |
| Reactivated | Suspicious | 196 (9.72) | 153.18 (92.25) |
| Reactivated | Quiescent | 62 (3.08) | 77.01 (45.49) |
| Suspicious | Reactivated | 1 (0.05) | 2452.74 (n/a) |
| Suspicious | Suspicious | 17 (0.84) | 68.84 (31.004) |
| Suspicious | Quiescent | 17 (0.84) | 60.57 (17.16) |
| Quiescent | Reactivated | 35 (1.73) | 2493.45 (65.87) |
| Quiescent | Suspicious | 146 (7.24) | 150.34 (95.19) |
| Quiescent | Quiescent | 806 (39.98) | 75.28 (44.72) |
n/a, not applicable.
- a
The number of observations (i.e. vignettes) is 4032, namely 2016 referring to optometrists and 2016 referring to ophthalmologists.
- b
Pathway cost includes the cost of a monitoring consultation and downstream costs (e.g. injections and follow-up visits).
TABLE 34
Impact on cost-effectiveness of sensitivity analysis 2
| Costs and effects | Optometrists (n = 2016) | Ophthalmologists (n = 2016) |
|---|---|---|
| Cost of a monitoring review (£), mean SD | 439.90 (460.90) | 425.61 (422.93) |
| Proportion of correct assessments (SD) | 0.844 (0.363) | 0.854 (0.353) |
| Incremental cost (£) (95% CI) | 14.29 (–19.91 to 48.49) | |
| Incremental benefit, proportion of correct assessments (95% CI) | –0.0099 (–0.045 to 0.025) | |
| ICER, incremental cost per correct assessmenta | Dominated | |
- a
The 95% CI around the ICER could not be defined.
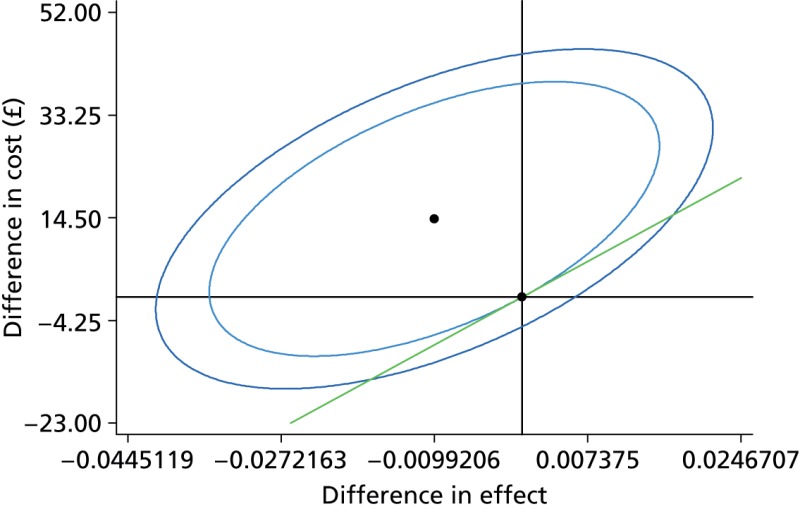
FIGURE 21
Cost-effectiveness plane for sensitivity analysis 2 (inner ellipse: 84%; outer ellipse: 95%).
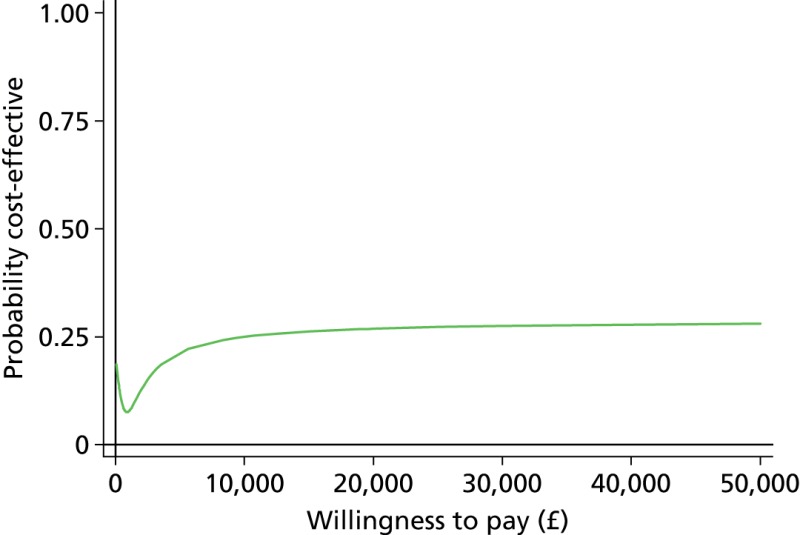
FIGURE 22
Cost-effectiveness acceptability curve for sensitivity analysis 2.
Sensitivity analysis 3: one bevacizumab injection instead of one ranibizumab
TABLE 35
Care cost pathways for sensitivity analysis 3
| Lesion status assessment | Observationsa (%) | Pathways cost (£),b mean (SD) | |
|---|---|---|---|
| Experts | Optometrists | ||
| Reactivated | Reactivated | 795 (39.43) | 242.23 (45.50) |
| Reactivated | Suspicious | 142 (7.04) | 103.61 (18.51) |
| Reactivated | Quiescent | 57 (2.83) | 51.29 (9.08) |
| Suspicious | Reactivated | 10 (0.50) | 118.12 (16.39) |
| Suspicious | Suspicious | 11 (0.55) | 57.04 (9.10) |
| Suspicious | Quiescent | 14 (0.69) | 52.96 (9.37) |
| Quiescent | Reactivated | 105 (5.21) | 117.14 (32.61) |
| Quiescent | Suspicious | 234 (11.61) | 78.31 (11.53) |
| Quiescent | Quiescent | 648 (32.14) | 51.98 (8.23) |
| Experts | Ophthalmologists | ||
| Reactivated | Reactivated | 736 (36.51) | 189.50 (46.41) |
| Reactivated | Suspicious | 196 (9.72) | 153.18 (92.25) |
| Reactivated | Quiescent | 62 (3.08) | 77.01 (45.49) |
| Suspicious | Reactivated | 1 (0.05) | 184.21 (n/a) |
| Suspicious | Suspicious | 17 (0.84) | 68.84 (31.004) |
| Suspicious | Quiescent | 17 (0.84) | 60.57 (17.16) |
| Quiescent | Reactivated | 35 (1.73) | 189.12 (38.002) |
| Quiescent | Suspicious | 146 (7.24) | 150.34 (95.19) |
| Quiescent | Quiescent | 806 (39.98) | 75.28 (44.72) |
n/a, not applicable.
- a
The number of observations (i.e. vignettes) is 4032, namely 2016 referring to optometrists and 2016 referring to ophthalmologists.
- b
Pathway cost includes the cost of a monitoring consultation and downstream costs (e.g. injections and follow-up visits).
TABLE 36
Impact on cost-effectiveness of sensitivity analysis 3
| Costs and effects | Optometrists | Ophthalmologists |
|---|---|---|
| Cost of a monitoring review (£), mean (SD) | 137.43 (91.78) | 131.89 (77.12) |
| Proportion of correct assessments (SD) | 0.844 (0.363) | 0.854 (0.353) |
| Incremental cost (£) (95% CI) | 5.54 (–0.834 to 11.916) | |
| Incremental benefit, proportion of correct assessments (95% CI) | –0.0099 (–0.045 to 0.025) | |
| ICER, incremental cost per correct assessmenta | Dominated | |
- a
The 95% CI around the ICER could not be defined.
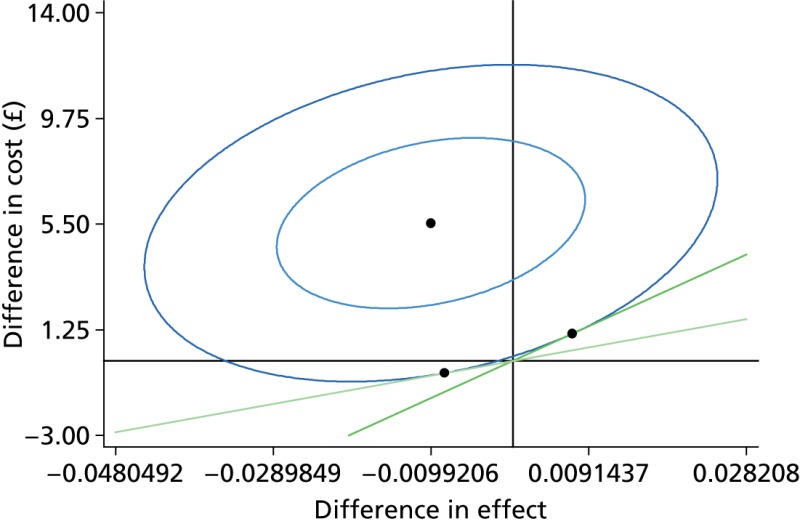
FIGURE 23
Cost-effectiveness plane for sensitivity analysis 3 (inner ellipse: 50%; outer ellipse: 95%).
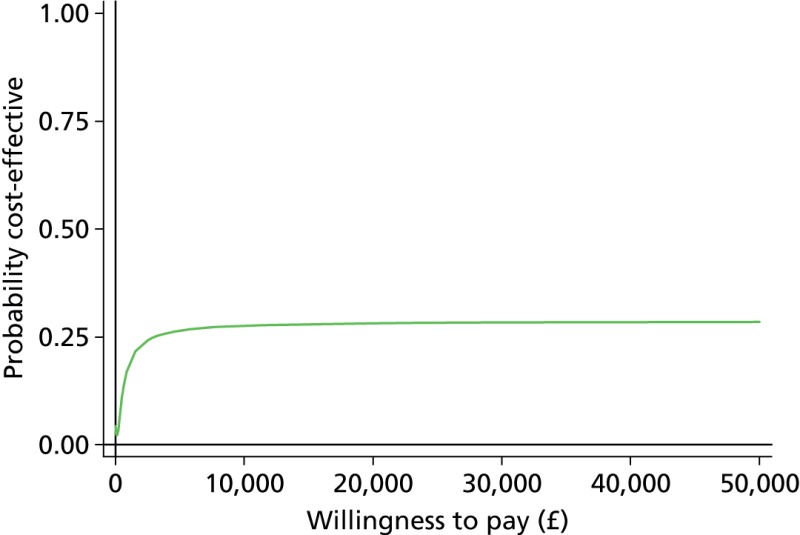
FIGURE 24
Cost-effectiveness acceptability curve for sensitivity analysis 3.
Sensitivity analysis 4: only monitoring review cost, no pathway cost
TABLE 37
Care cost pathways for sensitivity analysis 4
| Lesion status assessment | Observationsa (%) | Pathways cost (£),b mean (SD) | |
|---|---|---|---|
| Experts | Optometrists | ||
| Reactivated | Reactivated | 795 (39.43) | 51.79 (8.49) |
| Reactivated | Suspicious | 142 (7.04) | 51.81 (9.26) |
| Reactivated | Quiescent | 57 (2.83) | 51.29 (9.08) |
| Suspicious | Reactivated | 10 (0.50) | 50.64 (7.12) |
| Suspicious | Suspicious | 11 (0.55) | 57.04 (9.10) |
| Suspicious | Quiescent | 14 (0.69) | 52.96 (9.37) |
| Quiescent | Reactivated | 105 (5.21) | 51.49 (8.01) |
| Quiescent | Suspicious | 234 (11.61) | 52.21 (7.69) |
| Quiescent | Quiescent | 648 (32.14) | 51.98 (8.23) |
| Experts | Ophthalmologists | ||
| Reactivated | Reactivated | 736 (36.51) | 76.09 (43.66) |
| Reactivated | Suspicious | 196 (9.72) | 76.59 (46.13) |
| Reactivated | Quiescent | 62 (3.08) | 77.01 (45.49) |
| Suspicious | Reactivated | 1 (0.05) | 89.70 (n/a) |
| Suspicious | Suspicious | 17 (0.84) | 68.84 (31.004) |
| Suspicious | Quiescent | 17 (0.84) | 60.57 (17.16) |
| Quiescent | Reactivated | 35 (1.73) | 76.71 (38.22) |
| Quiescent | Suspicious | 146 (7.24) | 75.17 (47.59) |
| Quiescent | Quiescent | 806 (39.98) | 75.28 (44.72) |
n/a, not applicable.
- a
The number of observations (i.e. vignettes) is 4032, namely 2016 referring to optometrists and 2016 referring to ophthalmologists.
- b
Pathway cost includes the cost of a monitoring consultation and downstream costs (e.g. injections and follow-up visits).
TABLE 38
Impact on cost-effectiveness of sensitivity analysis 4
| Costs and effects | Optometrists (observations, n = 2016) | Ophthalmologists (observations, n = 2016) |
|---|---|---|
| Cost of a monitoring review (£), mean (SD) | 51.90 (8.36) | 75.60 (44.31) |
| Proportion of correct assessments (SD) | 0.844 (0.363) | 0.854 (0.353) |
| Incremental cost (£) (95% CI) | –23.70 (–26.09 to –21.31) | |
| Incremental benefit, proportion of correct assessments (95% CI) | –0.0099 (–0.045 to 0.025) | |
| ICER, incremental cost per correct assessment (95% CI) (£) Fieller’s methoda | 2389.07; lower limit: 535, upper limit: –943b | |
- a
We can be 95% confident that the way of performing a monitoring review with the larger point estimate for effect (i.e. monitoring review performed by ophthalmologists) represents bad value compared with the alternative.
- b
The lower confidence limit for the ICER is positive, and the upper limit is negative, because the ICER point estimate (see Figure 25) is in the south-west quadrant of the cost-effectiveness plane, hence positive, but the CI spans both the south-west (positive ICER) and south-east quadrants (negative ICER). The upper confidence limit of –943 lies in the south-east quadrant, which is represents a win-win situation (monitoring by optometrists is less costly and more effective). In contrast to the previous analyses, this sensitivity analysis shows a clear difference in costs and uncertainty in the effects.

FIGURE 25
Cost-effectiveness plane for sensitivity analysis 4 (inner ellipse 50%; outer ellipse: 95%).

FIGURE 26
Cost-effectiveness acceptability curve for sensitivity analysis 4.
- Copy of ECHoES Resource use and cost questionnaire for optometrists
- Components of a typical monitoring review
- Resource use and costs associated with training
- Sensitivity analysis 1: three ranibizumab injections and consultations instead of one
- Sensitivity analysis 2: one aflibercept injection instead of one ranibizumab
- Sensitivity analysis 3: one bevacizumab injection instead of one ranibizumab
- Sensitivity analysis 4: only monitoring review cost, no pathway cost
- Additional health economic evaluation information - The Effectiveness, cost-effe...Additional health economic evaluation information - The Effectiveness, cost-effectiveness and acceptability of Community versus Hospital Eye Service follow-up for patients with neovascular age-related macular degeneration with quiescent disease (ECHoES): a virtual randomised balanced incomplete block trial
- List of included studies - Strategies for older people living in care homes to p...List of included studies - Strategies for older people living in care homes to prevent urinary tract infection: the StOP UTI realist synthesis
- Scientific summary - Risk assessments and structured care interventions for prev...Scientific summary - Risk assessments and structured care interventions for prevention of foot ulceration in diabetes: development and validation of a prognostic model
- Software output of model coefficients for the covariates with 95% CIs - Chair-ba...Software output of model coefficients for the covariates with 95% CIs - Chair-based yoga programme for older adults with multimorbidity: RCT with embedded economic and process evaluations
- Inclusion and exclusion criteria for the 10 included studies - Adenoidectomy wit...Inclusion and exclusion criteria for the 10 included studies - Adenoidectomy with or without grommets for children with otitis media: an individual patient data meta-analysis
Your browsing activity is empty.
Activity recording is turned off.
See more...