U.S. flag

An official website of the United States government

NCBI Bookshelf. A service of the National Library of Medicine, National Institutes of Health.

Duarte A, Llewellyn A, Walker R, et al. Non-invasive imaging software to assess the functional significance of coronary stenoses: a systematic review and economic evaluation. Southampton (UK): NIHR Journals Library; 2021 Sep. (Health Technology Assessment, No. 25.56.)

Cover of Non-invasive imaging software to assess the functional significance of coronary stenoses: a systematic review and economic evaluation

Non-invasive imaging software to assess the functional significance of coronary stenoses: a systematic review and economic evaluation.

Show details

Appendix 4Further meta-analysis results

FIGURE 18. Meta-analysis of PPVs.

FIGURE 18

Meta-analysis of PPVs.

FIGURE 19. Meta-analysis of NPVs.

FIGURE 19

Meta-analysis of NPVs.

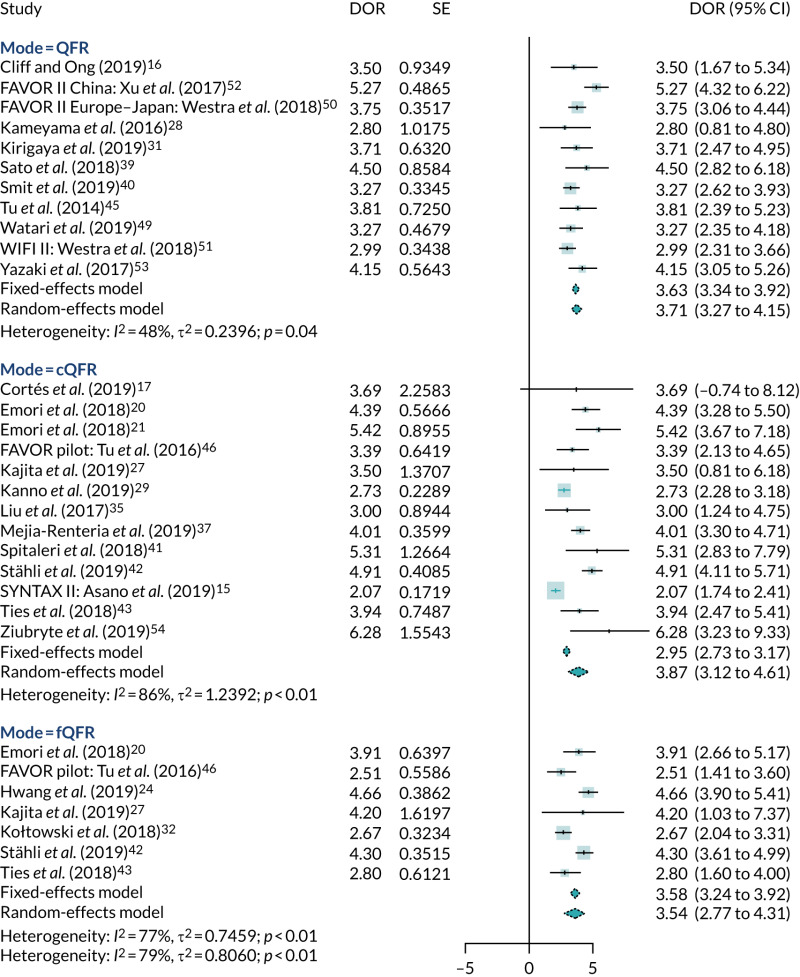
FIGURE 20. Meta-analysis of DORs.

FIGURE 20

Meta-analysis of DORs.

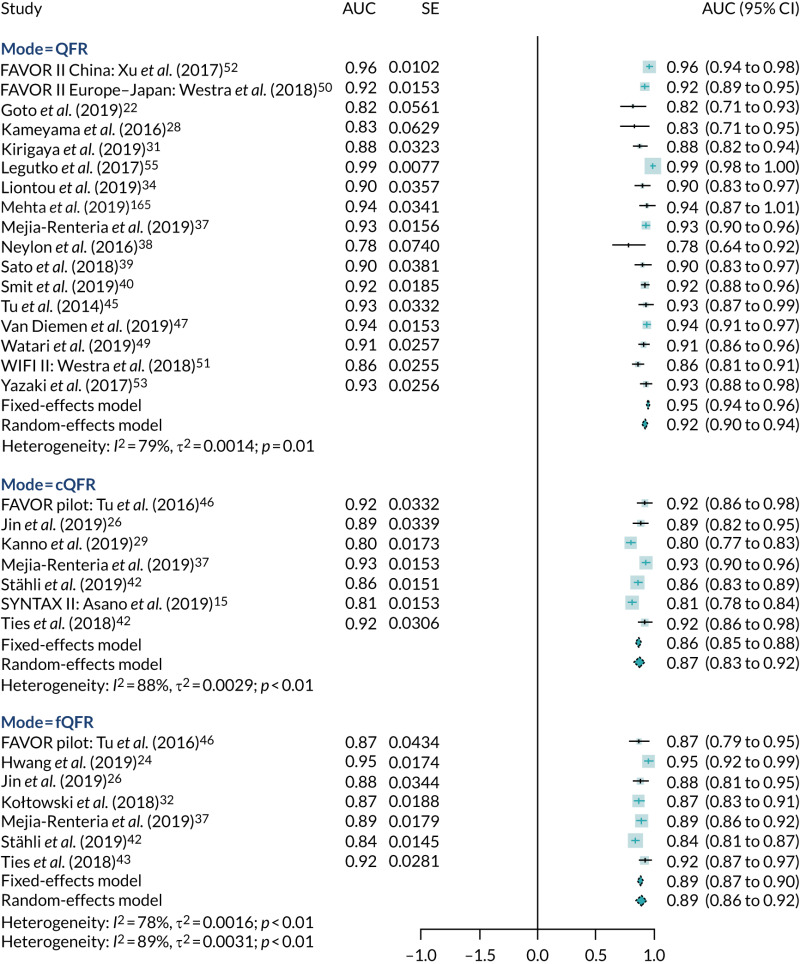
FIGURE 21. Meta-analysis of AUC.

FIGURE 21

Meta-analysis of AUC.

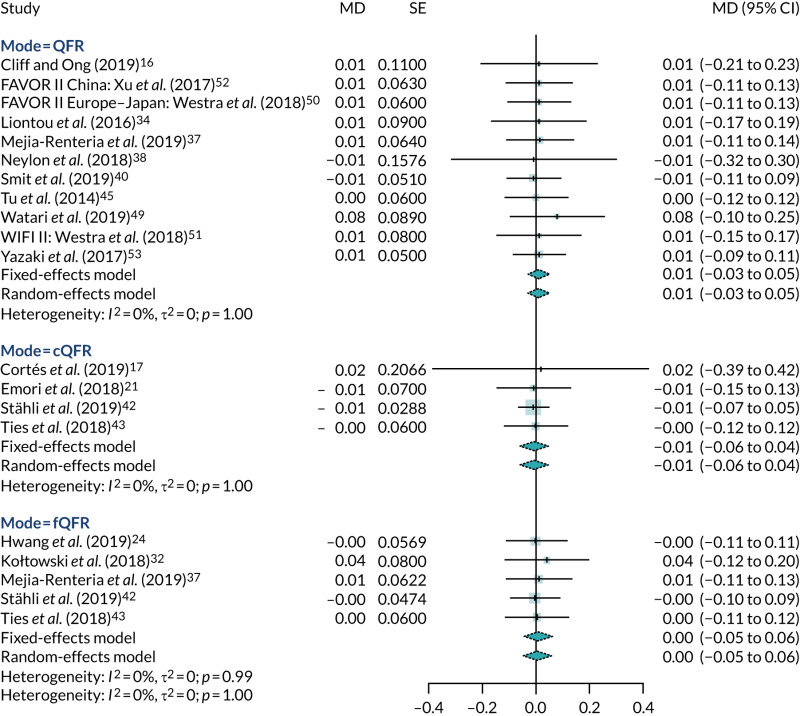
FIGURE 22. Meta-analysis of MD between FFR and QFR.

FIGURE 22

Meta-analysis of MD between FFR and QFR.

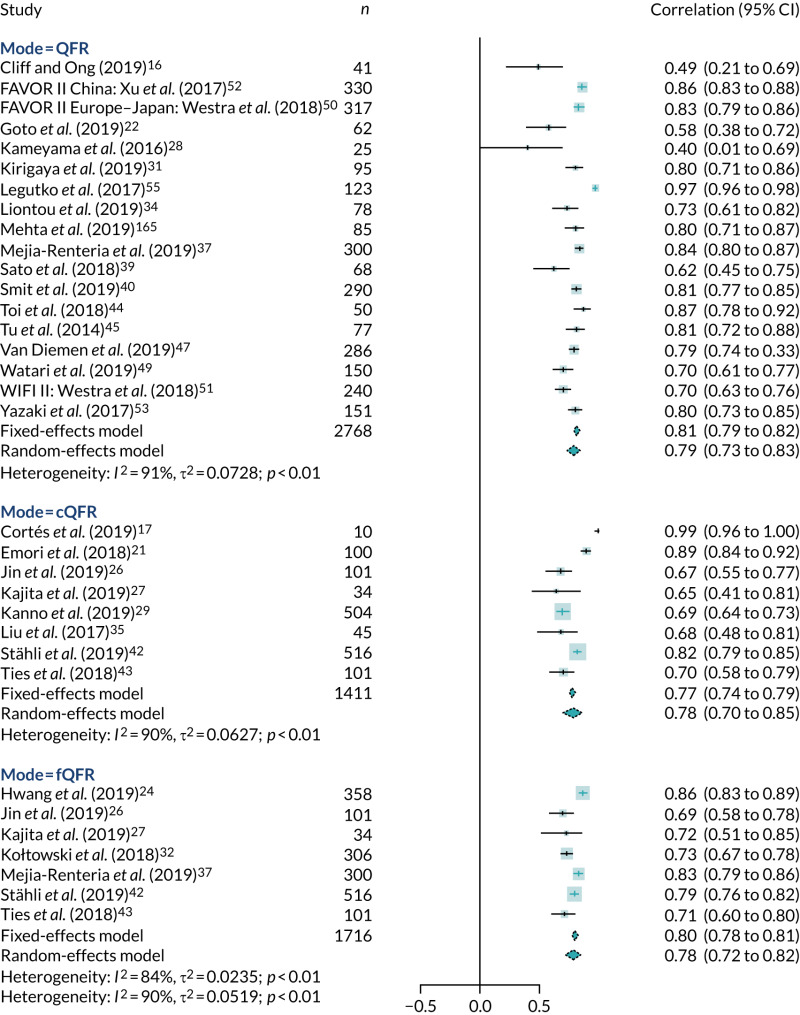
FIGURE 23. Meta-analysis of correlation between QFR and FFR.

FIGURE 23

Meta-analysis of correlation between QFR and FFR.

FIGURE 24. Receiver operating characteristic plot of bivariate meta-analysis.
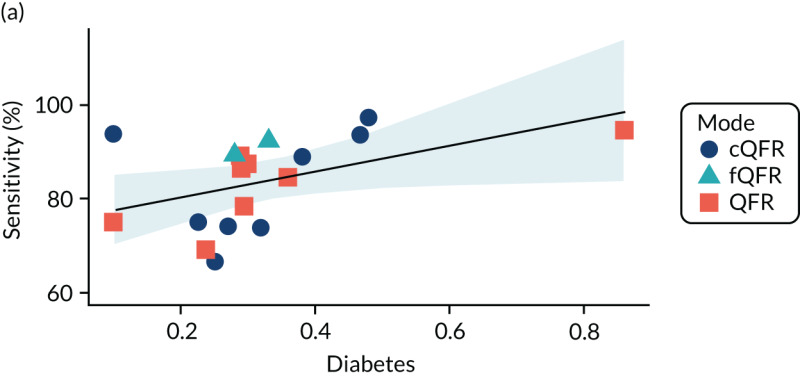
FIGURE 24

Receiver operating characteristic plot of bivariate meta-analysis.
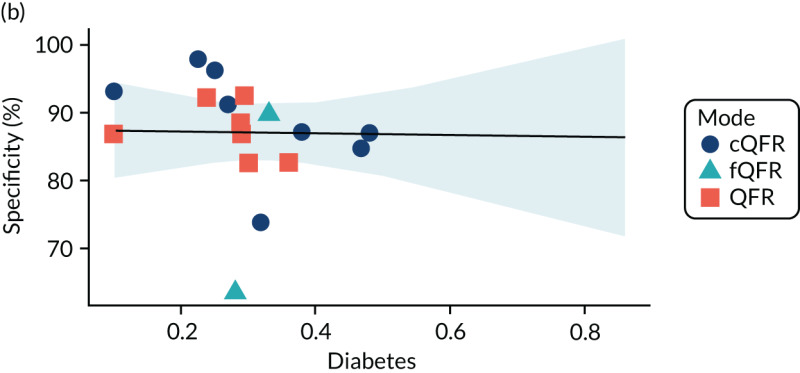
FIGURE 25. Receiver operating characteristic plot of studies comparing ICA, fQFR and cQFR.

FIGURE 25

Receiver operating characteristic plot of studies comparing ICA, fQFR and cQFR.

FIGURE 26. Bivariate meta-analysis by unit of analysis.

FIGURE 26

Bivariate meta-analysis by unit of analysis.

FIGURE 27. Bivariate meta-analysis by study type.

FIGURE 27

Bivariate meta-analysis by study type.

FIGURE 28. Metaregression of sensitivity, specificity and DOR by proportion with diabetes: (a) sensitivity; (b) specificity; and (c) log-DOR.
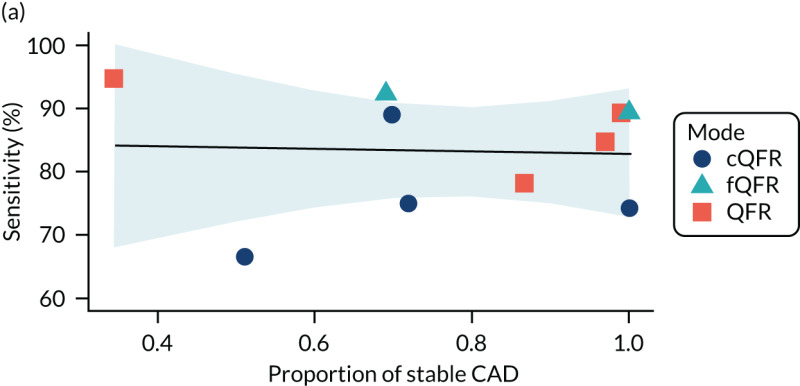

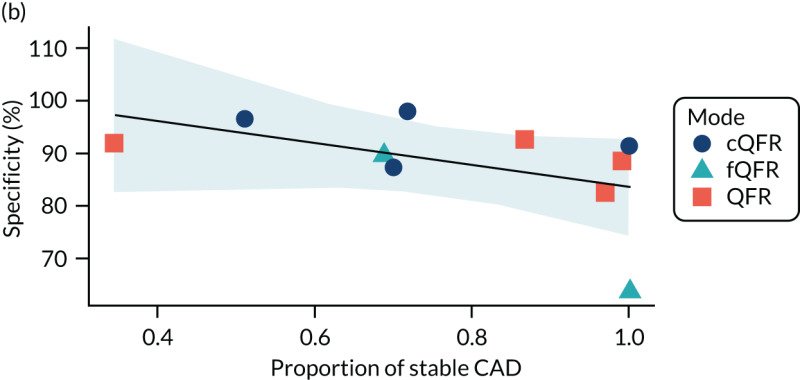
FIGURE 28

Metaregression of sensitivity, specificity and DOR by proportion with diabetes: (a) sensitivity; (b) specificity; and (c) log-DOR.
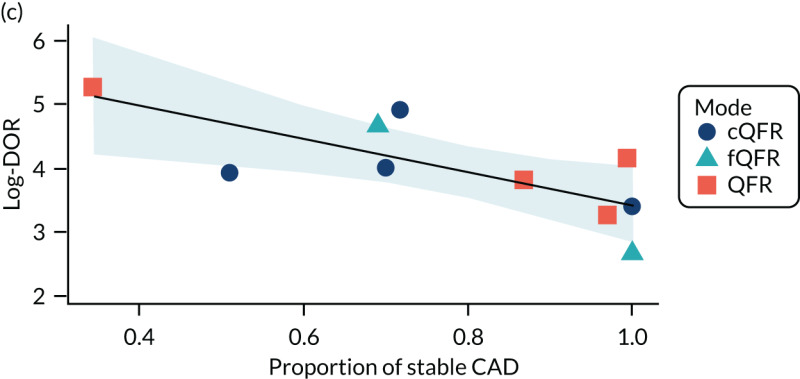
FIGURE 29. Metaregression of sensitivity, specificity and DOR by proportion with stable CAD: (a) sensitivity; (b) specificity; and (c) log-DOR.
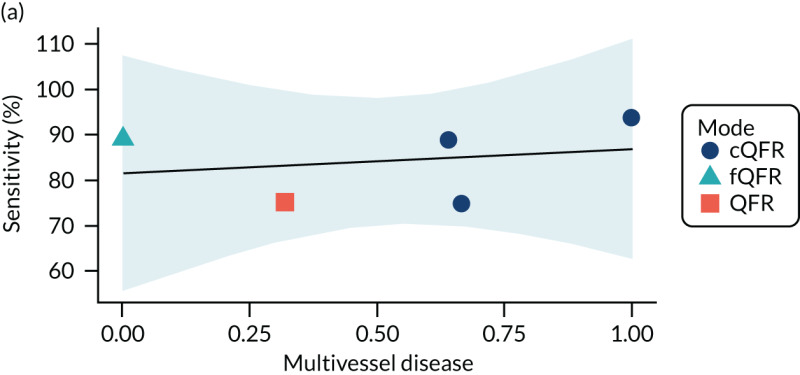

FIGURE 29

Metaregression of sensitivity, specificity and DOR by proportion with stable CAD: (a) sensitivity; (b) specificity; and (c) log-DOR.
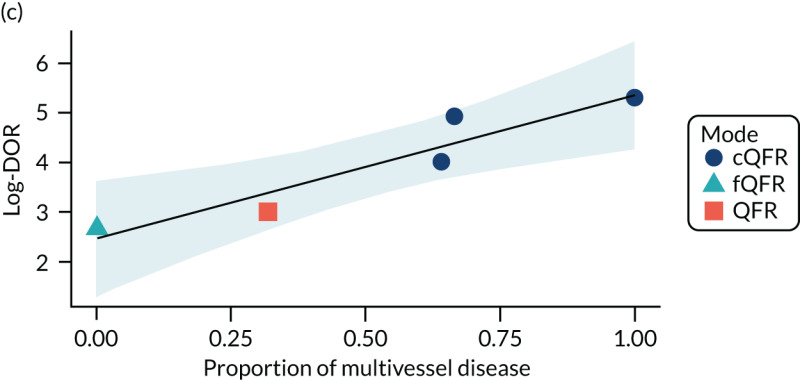
FIGURE 30. Metaregression of sensitivity, specificity and DOR by proportion with multivessel disease: (a) sensitivity; (b) specificity; and (c) log-DOR.
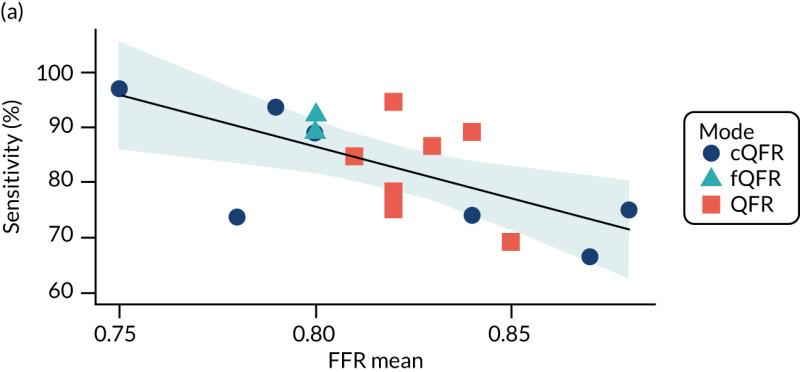

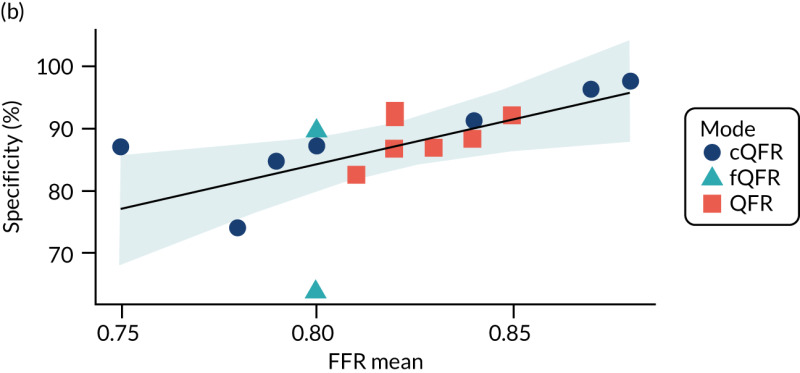
FIGURE 30

Metaregression of sensitivity, specificity and DOR by proportion with multivessel disease: (a) sensitivity; (b) specificity; and (c) log-DOR.
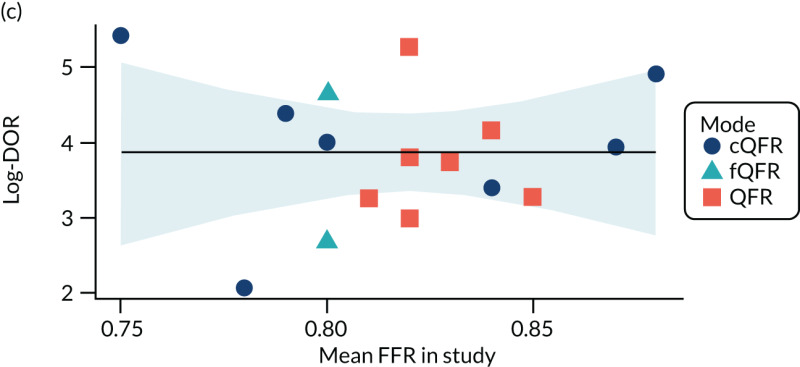
FIGURE 31. Metaregression of sensitivity, specificity and DOR by mean FFR: (a) sensitivity; (b) specificity; and (c) log-DOR.

FIGURE 31

Metaregression of sensitivity, specificity and DOR by mean FFR: (a) sensitivity; (b) specificity; and (c) log-DOR.

TABLE 38

TABLE 38

Regression parameters and p-values from metaregression analyses
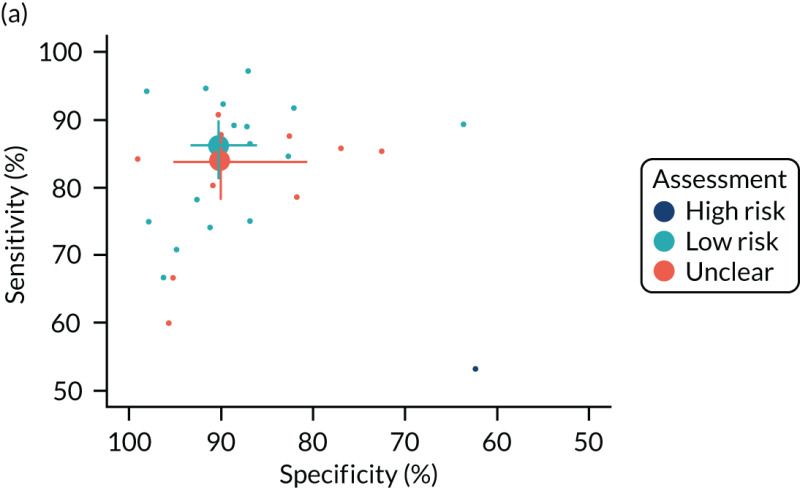
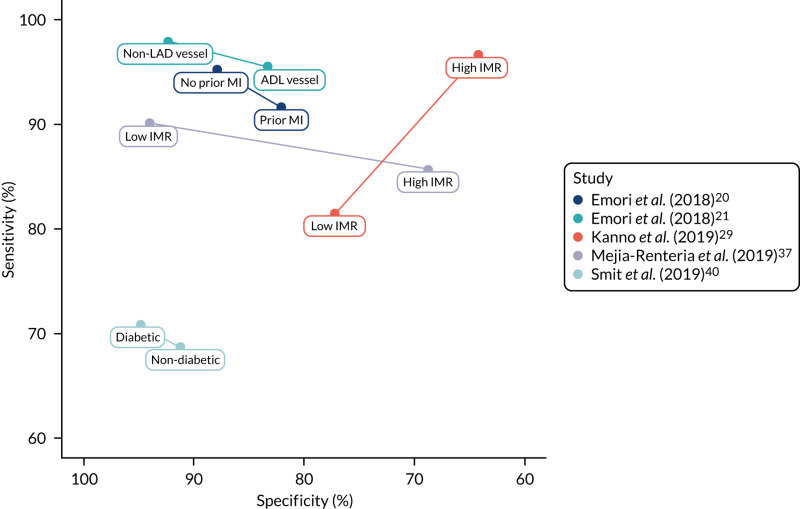
FIGURE 32. Sensitivity and specificity by patient subgroups.

FIGURE 32

Sensitivity and specificity by patient subgroups.

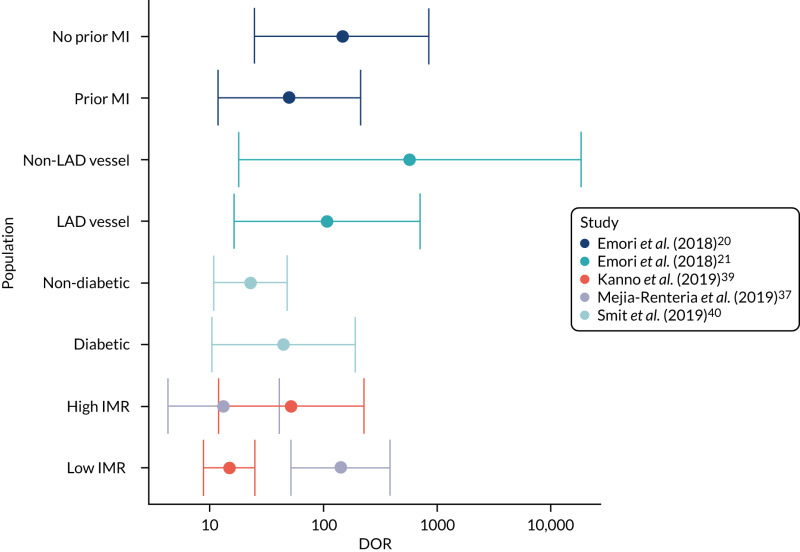
FIGURE 33. Diagnostic odds ratios by patient subgroups.

FIGURE 33

Diagnostic odds ratios by patient subgroups.

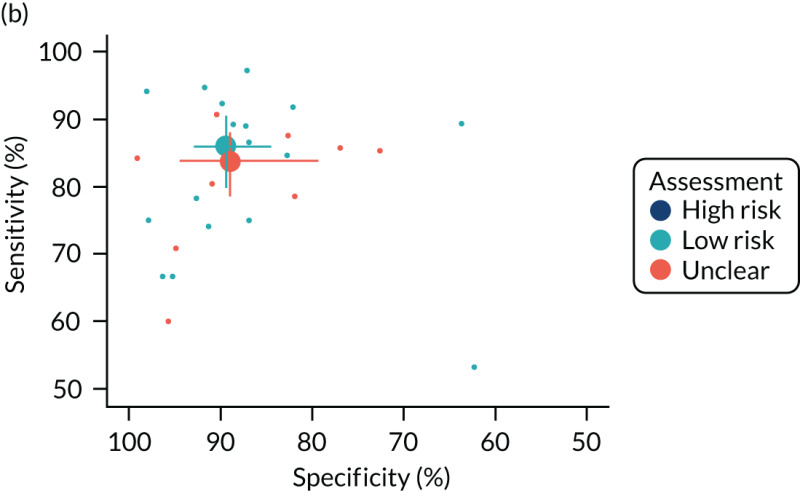
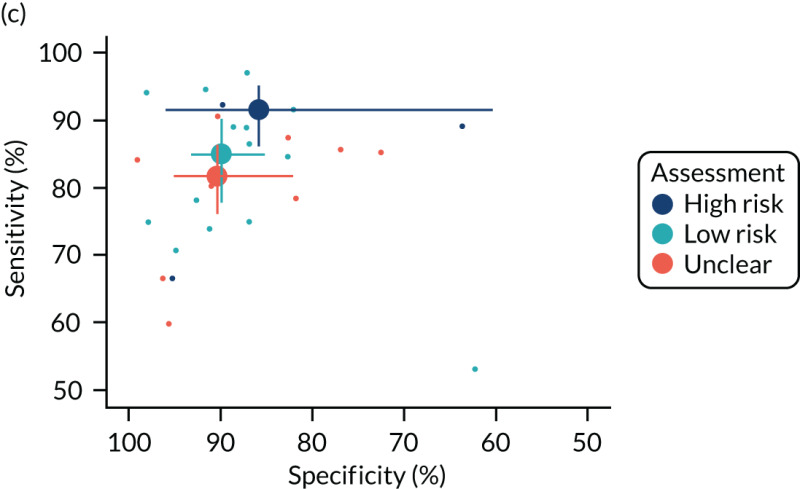
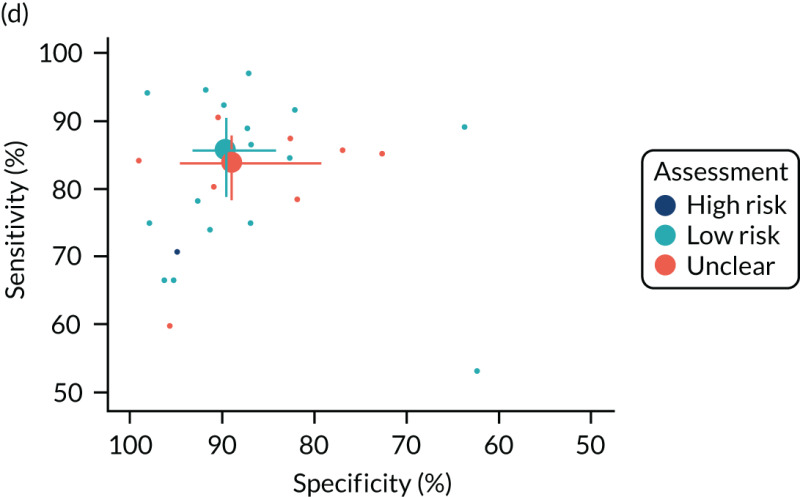
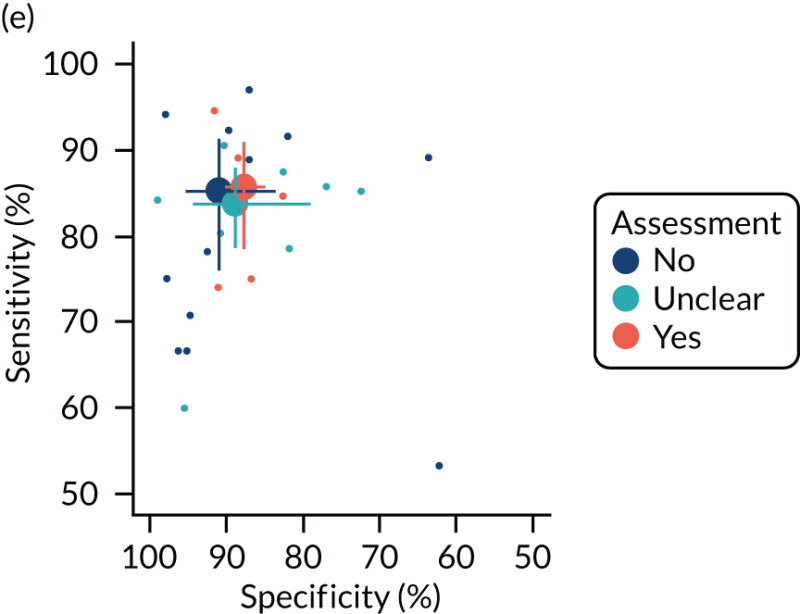
FIGURE 34. Bivariate meta-analyses according to QUADAS-2 risk-of-bias classification: (a) flow; (b) index text; (c) patient selection; and (d) reference standard.

FIGURE 34

Bivariate meta-analyses according to QUADAS-2 risk-of-bias classification: (a) flow; (b) index text; (c) patient selection; and (d) reference standard.

FIGURE 35. Bivariate meta-analyses according to QUADAS-2 applicability classification: (a) index test; (b) patient selection; and (c) reference standard.

FIGURE 35

Bivariate meta-analyses according to QUADAS-2 applicability classification: (a) index test; (b) patient selection; and (c) reference standard.

FIGURE 36. Bivariate meta-analyses according to other factors that might cause bias: (a) blinding; (b) both tests; (c) complete data; (d) online test; (e) same exam; and (f) stable CAD.
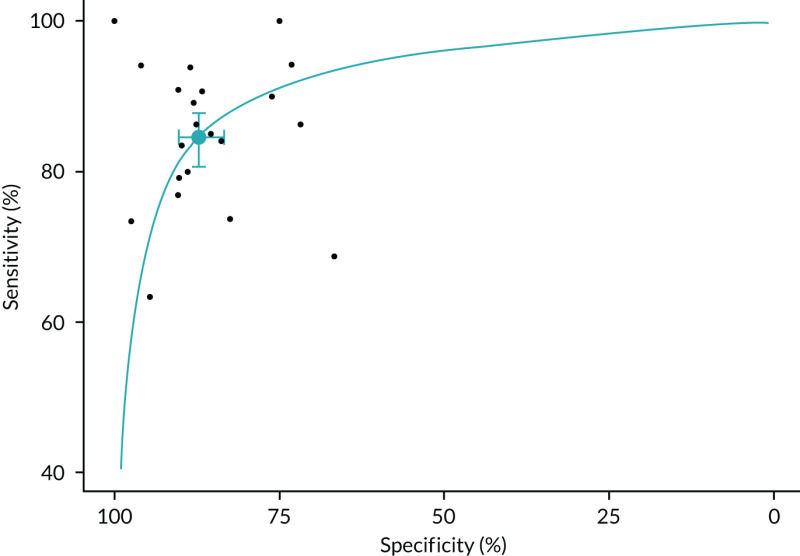

FIGURE 36

Bivariate meta-analyses according to other factors that might cause bias: (a) blinding; (b) both tests; (c) complete data; (d) online test; (e) same exam; and (f) stable CAD.

FIGURE 37. Bivariate meta-analysis of extracted figure data.

FIGURE 37

Bivariate meta-analysis of extracted figure data.

TABLE 39

TABLE 39

Comparison of diagnostic accuracy based on figure data and text/table data

FIGURE 38. Fractional flow reserve and QFR data showing QFR grey zone between 0.

FIGURE 38

Fractional flow reserve and QFR data showing QFR grey zone between 0.78 and 0.84.

FIGURE 39. Difference between FFR and QFR values in the grey zone: (a) FN; (b) FP; (c) TN; and (d) TP.

FIGURE 39

Difference between FFR and QFR values in the grey zone: (a) FN; (b) FP; (c) TN; and (d) TP.

FIGURE 40. Diagnostic accuracy of QFR with and without using the grey zone.

FIGURE 40

Diagnostic accuracy of QFR with and without using the grey zone.

TABLE 40

TABLE 40

Approximate grey-zone thresholds required for sensitivity and specificity of 90% or 95%

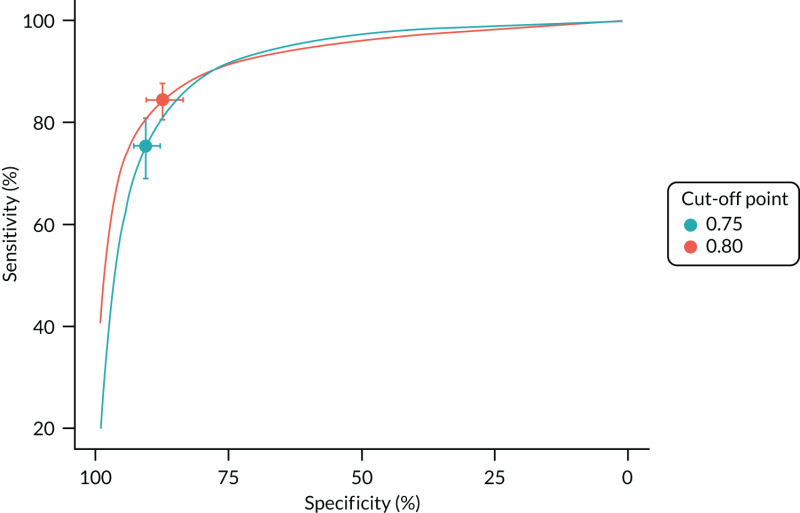
FIGURE 41. Diagnostic meta-analysis using FFR/QFR thresholds of 0.

FIGURE 41

Diagnostic meta-analysis using FFR/QFR thresholds of 0.75 and 0.80.

TABLE 41

TABLE 41

Studies included in the meta-analysis 2D ICA

Copyright © Queen’s Printer and Controller of HMSO 2021. This work was produced by Duarte et al. under the terms of a commissioning contract issued by the Secretary of State for Health and Social Care. This issue may be freely reproduced for the purposes of private research and study and extracts (or indeed, the full report) may be included in professional journals provided that suitable acknowledgement is made and the reproduction is not associated with any form of advertising. Applications for commercial reproduction should be addressed to: NIHR Journals Library, National Institute for Health Research, Evaluation, Trials and Studies Coordinating Centre, Alpha House, University of Southampton Science Park, Southampton SO16 7NS, UK.
Bookshelf ID: NBK574212

Views

  • PubReader
  • Print View
  • Cite this Page
  • PDF version of this title (3.3M)

Other titles in this collection

Recent Activity

Your browsing activity is empty.

Activity recording is turned off.

Turn recording back on

See more...