U.S. flag

An official website of the United States government

NCBI Bookshelf. A service of the National Library of Medicine, National Institutes of Health.

WHO Guidelines on Hepatitis B and C Testing. Geneva: World Health Organization; 2017 Feb.

Cover of WHO Guidelines on Hepatitis B and C Testing

WHO Guidelines on Hepatitis B and C Testing.

Show details

ANNEX 5Systematic Reviews and Evidence Summaries

Annex 5.1. PICO 1 - Who to test (HBV)
Literature review on cost-effectiveness of HBV screening, treatment strategies and applicability to LMICs

Authors

Team Lead: , , , , , , and .

Affiliations

1 Imperial College, London, United Kingdom

For correspondence: ku.ca.lairepmi@10magayan.s

1. Background

Hepatitis B virus (HBV) infection is highly prevalent worldwide, with a disproportionately high burden in low- and middle-income countries (LMICs).1 There is mounting evidence regarding the efficacy of antiviral therapy in the reduction of disease progression to cirrhosis and hepatocellular carcinoma (HCC). However, this impact is not fully translated into practice as many people still remain unaware of their infection status, even in high-income countries (HICs),24 and this value is likely to be even lower in LMICs. For example, in the Gambia, only 0.4% of screening participants in PROLIFICA had been tested in the past. Wilson and Jungner criteria have been used to assess whether a disease should screened.5 However, despite fulfilling most of these criteria, screening for HBV is not performed systematically. The reasons surrounding this are likely multifactorial, including lack of awareness at all levels, lack of clear guidelines, competing health-care priorities, limited health-care budgets and political will. This leads to many people remaining undiagnosed until later stages of the disease, when prognosis is poor. Furthermore, even if diagnosed, access to appropriate antiviral therapy and ongoing clinical management is lacking.

Clarifications of terminology used in this report

1.1.1. High-risk group

For the purposes of HBV screening in LMIC, the categorisation of populations into “high-risk” groups is not helpful or informative in guiding policy. In most LMICs, the adult population prevalence (unvaccinated) falls into the intermediate- to high-endemicity categories.1 Furthermore, within countries HBsAg prevalence is more homogenous within the population, than for example, with hepatitis C virus (HCV) infection. In this report, we therefore only refer to “high-risk” groups when referring to literature from HIC settings.

1.1.2. General population screening

This is used to refer to the fact that all members of the population have access to the screening programme under consideration. This can include community outreach screening, health-care facility-based screening, etc.

1.1.3. Targeted screening

This refers to screening of specific groups, e.g. pregnant women. Targeted groups are not necessary at higher risk of being infected than the general population.

2. Overview of the report

The purpose of this report is not to represent the results of a full systematic review. It is meant to serve as a summary of existing studies on cost-effectiveness of screening and treatment for HBV, with an analytic summary of key considerations. It was envisaged that there was a lack of relevant literature in LMICs, so existing studies from HICs are described and their potential uses and limitations when drawing conclusions are discussed.

3. Search strategy

We searched the bibliography of two previous systematic reviews on the cost-effectiveness of HBV screening by Hahné et al.6 and Gueue et al. (unpublished, shared by WHO team) and included these in the discussion, where appropriate. Hahne and Gueue searches were performed upto 2011 and 2012, respectively. We therefore performed an updated search using PubMed to retrieve any further relevant articles to be included in this report. We searched PubMed for articles published between January 2000 and September 2015, with terms incorporating “hepatitis B”, “HBV”, or “CHB” and “cost” or “economic” and “screen”, “test” or “Diagn”. We excluded studies prior to 2000, as older studies were mainly studying cost-effectiveness of pre-vaccination screening, rather than screening for consideration of antiviral therapy. Furthermore, Geue et al. reports the low methodological standards of cost-effectiveness analyses in older studies. We selected articles published in English only. We did not search any databases other than PubMed, nor did we search the grey literature. However, we attempted to include any known ongoing HBV screening programmes in LMIC by consulting colleagues at WHO, in order to include any unpublished studies in this report.

We excluded studies that considered screening in the following groups, unless the study reported further linkage into care and treatment – blood banks and health-care workers. We excluded evaluations that included screening prior to vaccination, unless the analysis also considered antiviral therapy for the person found to be HBsAg-positive. We also excluded studies around screening for HBV prior to chemotherapy, as this was only likely to be relevant to higher income settings and would only concern a small subset of the populations in LMIC. We also excluded studies looking at coinfection with HIV and comparing diagnostic methods.

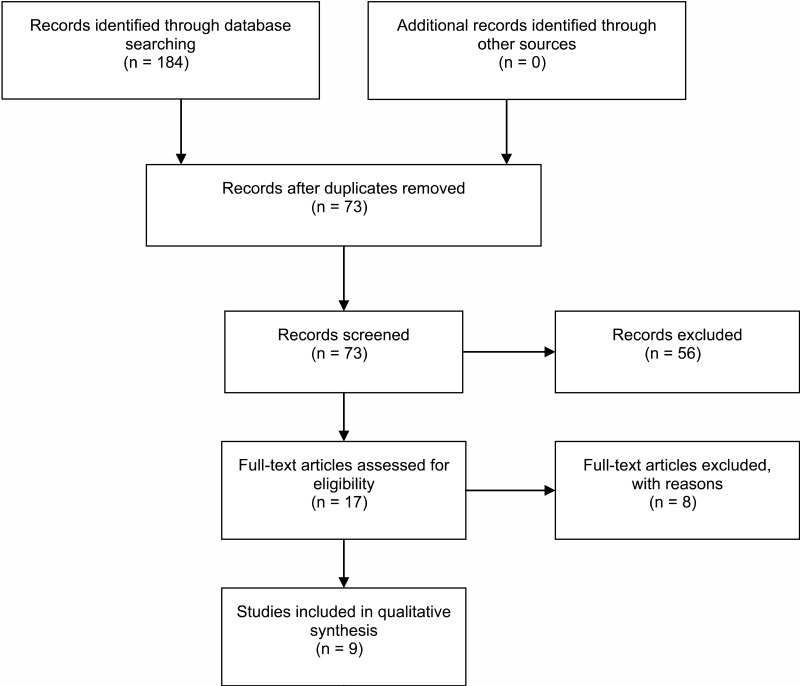
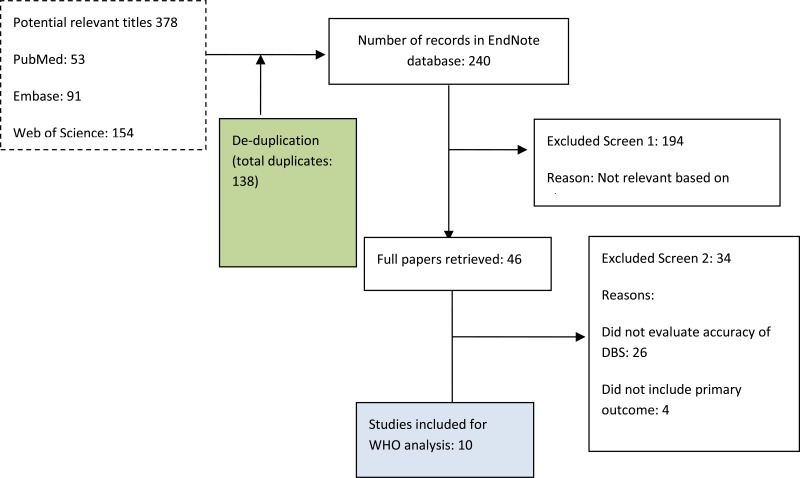
The PubMed search retrieved 32 studies, many of which overlapped with the bibliographies of the existing reviews. All studies were performed in HICs. We were unable to find any previous studies describing cost or cost-effectiveness of screening for HBV in LMICs. Due to the lack of published literature in LMICs, to better inform the report, we also included data from the PROLIFICA study (forthcoming).7 Finally, eight published studies and one unpublished study met inclusion criteria and are discussed in further detail below.

4. Summary of main literature

The existing published studies on the cost-effectiveness of screening and treatment for HBV have been performed in HICs where the prevalence in the general population is low.1 We have also included discussion of unpublished PROLIFICA data, which is the only study in a LIC setting.

Two studies evaluated HBV screening in the general population8,9 and seven studies in “high-risk” groups (all but one concerned screening in migrant or refugee populations).1016 We excluded studies of ANC screening as they did not consider antiviral therapy to the mother and only looked at the benefit of screening in order to guide vaccination strategies to reduce mother-to-child transmission. However, a brief summary is given below. The studies used different methods of screening the “high-risk” groups including, in the clinical setting,10,14 community outreach methods14 and overseas screening.16 Various outcome measures were used including cost per quality-adjusted life-year (QALY) gained, cost per life-year (LY) saved and cost per case screened. Many of the models were simulated using hypothetical cohorts.

4.1. General population level screening

There was one previously published study in the USA and one forthcoming study in The Gambia, looking at the cost-effectiveness of offering screening and treatment to the general population.

Eckman et al.8 looked at the cost-effectiveness of HBsAg testing of asymptomatic outpatients in primary care settings in the USA, using a hypothetical cohort (35-year-old male) with a general population prevalence of 2%. Screening was then followed by treatment with one of four regimens and compared to a no screening strategy. Screening and treatment were found to be cost-effective with an incremental cost-effectiveness ratio (ICER) of US$ 29 230/QALY. The ICER remained below their willingness to pay (WTP) threshold of US$ 50 000/QALY gained, even down to a population prevalence of 0.3%.

The feasibility of large-scale screening and treatment in sub-Saharan Africa (SSA) has been demonstrated by the ongoing “Prevention of liver fibrosis and liver cancer in Africa” (PROLIFICA) study in West Africa (Lemoine et al., forthcoming). This implementation study has screened nearly 10 000 adults for HBsAg at the community level in The Gambia and Senegal using an active outreach method. This is followed by full clinical assessment of those found to HBsAg positive and antiviral treatment if meeting eligibility criteria. A cost-effectiveness analysis of this community-based screen and treat strategy in The Gambia (Nayagam et al., forthcoming), compared to status quo, revealed an ICER of US$ 705/LY gained (other outcome measures also calculated: US$ 476/QALY gained or US$ 575/DALY averted). The authors acknowledge that WTP thresholds levels, and their use, are highly debated in LMICs. However, it can be regarded as cost-effective if using the WHO WTP threshold of three times the country’s GDP per capita to define a cost-effective intervention (3 times GDP per capita = US$ 1460 in The Gambia).17 This is the only cost-effectiveness study of screening and treatment we have found in LMIC settings. Furthermore, it is furnished with real-life cost and effectiveness data from a large-scale screening and treatment intervention programme.

4.2. Screening of “high-risk” groups in HIC

There were six studies looking at the cost-effectiveness of screening and treatment in migrant or refugee populations in HICs,1014,16 and one looking at screening all groups classified as “high–risk” in Italy.15

The study by Wong and colleagues in 2011 looked at the cost-effectiveness of screening and treatment of immigrants for chronic hepatitis B (CHB) in Canada.10 They considered a screen and treat strategy and a screen, treat or vaccinate strategy, with status quo (no screening). Screening was offered by the primary-care physician at a visit scheduled for another reason, described by the authors as a “case-finding” strategy. They used a hypothetical cohort (35-year-old male) with a baseline HBsAg prevalence among the immigrant population of 4.81%. The screen and treat strategy had an ICER of US$ 69 000/QALY gained. The authors acknowledge the uncertainty around WTP thresholds, but quotes range from US$ 50 000 to US$ 120 000 for Canada, implying a cost-effective intervention. This model is more clinically representative than many of the other models; however, it uses high and probably unrealistic uptake and adherence rates.

Another Canadian study by Rossi et al. (2013)11 looked at combinations of scenarios involving screening, treatment and vaccination among newly arrived immigrants and refugees. The screen and treat scenario was found to be the most cost-effective with an ICER of US$ 40 880/QALY gained. This strategy exceeds the Canadian WTP threshold adopted in this study of US$ 50 000/QALY, when HBsAg prevalence is less than 3%. A societal perspective for the analysis was used. A hypothetical cohort of 250 000 immigrants was used, with baseline assumptions of 70% acceptance of screening, 60% linkage to care, 75% of those eligible will have treatment and annual cost of antiviral drugs at US$ 8089.

An earlier study by Hutton et al.12 looked at the cost-effectiveness of screening and vaccination of Asian Pacific Islander adults for HBV by using a hypothetical cohort of 20–60 years old with a HBsAg prevalence of 10%. They compared four strategies of combinations of screening, treatment and vaccination, similar to the study described above. The screen and treat strategy was the most cost-effective with an ICER of US$ 36 000/QALY gained (compared to no screening), even down to an HBsAg prevalence of 1%. This study used a societal perspective.

Another, more recent, US study by Jezwa and colleagues16 compared the cost-benefits of two overseas programmes for reducing HBV infection among refugees. They compared two strategies: (i) vaccination only, and (ii) screening and vaccination; and suggested onward treatment on arrival in USA if HBsAg was positive. The strength of this study was the use of original data sets of refugee populations in two US states. Their baseline assumptions included a prevalence of 6.8%, 100% adherence with screening, 60% of those tested positive for HBsAg will link to specialist care and that 90% will adhere to treatment.

The study by Veldhuijzen et al.13 was the only European study which looked at the cost-effectiveness of HBV screening and early treatment of migrants. An active screening method was used, where the target population is identified using the municipal population registry and receives a postal invitation to attend screening. Compared to status quo, screening and treatment had an ICER of €8966/QALY saved and was therefore reported as cost-effective compared to the authors’ reported WTP threshold of €20 000/QALY. Their baseline HBsAg prevalence was 3.35%, 58% linkage to specialist care and 75% adherence.

A study by Rein et al.14 looked at different methods of screening for HBV among the Asian migrant population in the USA. This was a descriptive rather than a formal cost-effectiveness analysis, with outcome measures given as cost per person screened. The screening methods analysed included testing at a community clinic and other more active community outreach models, where screening was performed at various events in the Asian community. The costs per person screened ranged from US$ 40 to US$ 280 depending on the method used. Integrating screening into clinical services was found to be the least costly method, but reached the least people, whereas extending screening outside the clinical setting was more costly as it included costs of organizing events and volunteer time, but reached more people. This study provides useful insights into the relative costs of various screening methods and, unlike some of the other studies, it includes full costs including those associated with recruiting patients. However, it does not provide long-term outcomes following on from a positive screening test and is therefore limited in its generalizability.

Ruggeri et al.15 looked at screening of all groups defined as “high–risk” (according to local Italian guidelines), and compared the cost-effectiveness of screening followed by treatment for CHB using one of five alternative antiviral drugs. This was compared to the status quo strategy of no screening, but treatment for cirrhosis and HCC stages only. A hypothetic cohort of 100 000 individuals was considered and screening and treatment had an ICER of €17000/QALY.

4.3. Pregnant women

The screening of pregnant women for HBsAg (with or without HBeAg testing) in antenatal care (ANC) settings has also been considered in previous cost-effectiveness analyses. However, all these studies consider only the reduction in mother-to-child transmission and benefits to the child (using various outcome measures—cost per case detected, cost per infant carrier prevented or cost per LY gained). None of these ANC studies include onward linkage into care or treatment for the mother, to reduce her risk of progression of liver disease. A full discussion of these studies is therefore not included in this report. Furthermore, many of the studies are older studies published before 2000 (see Hahne review for summary of these studies18) and performed in HICs (or one in upper-middle income category). They are also heterogeneous in terms of their research question and the baseline strategy under consideration, e.g. Barbosa study is comparing a comprehensive programme to a status quo which already includes screening and birth dose (BD), hepatitis B immune globulin (HBIG) and infant vaccination.19 Fan compares whether to screen for HBeAg or HBV VL in order to guide the use of PPT antiviral therapy in USA.20 Vimloket compared universal neonatal vaccination to screening for HBsAg and HBeAg to stratify whether HBIG is needed in Thailand, using cost per infection averted.21 A full discussion of these studies is therefore not included in this report, as they were unlikely to be useful in helping guide these current recommendations for HBV screening and treatment in ANC settings in LMICs, but would be relevant to consider for reduction of HBV mother-to-child transmission strategies.
5. Drivers of cost-effectiveness

From the studies reviewed, some of the main drivers of whether a HBV screening and treatment strategy will be cost-effective are discussed below. This is not meant to provide an exhaustive list of drivers of cost-effectiveness but a descriptive analysis of key considerations, which will hopefully be useful in informing discussions. The main factors influencing the cost-effectiveness result are usually presented as the results of one-way sensitivity analyses, meant to be performed over plausible parameter ranges. However, it should be noted that the contribution of each parameter depends on the underlying type of model used and its baseline parameters.

5.1. HBsAg prevalence

Although the studies varied in the baseline HBsAg prevalence used in the model, they reported how the cost-effectiveness of the intervention would change over wide HBsAg prevalence ranges. HBsAg prevalence was found to have a relatively small influence on cost-effectiveness over the wide ranges tested in most of the studies. General population screening was found to remain cost-effective, i.e. ICER below the respective WTP threshold down to a HBsAg prevalence of 0.3% in the USA8 and 2% in The Gambia (PROLIFICA). Screening of migrants in North America remained cost-effective down to a prevalence of 1–3%.12,22 Other studies did not explicitly state a prevalence cut-off when the intervention is no longer cost-effective.10,15

It is important to note that “cost-effectiveness” is assessed using differing scales of cost and WTP thresholds between these studies. Therefore, extrapolation of the HIC results to LMICs is difficult, and absolute threshold cut-off for HBsAg prevalence should not be decided on the basis of this literature from HICs. However, the fact that all analyses revealed that a screen and treat strategy remained cost-effective down to low HBsAg prevalence in the groups analysed increases the confidence of this finding.

This has important implications for strategy choice when considering screening in other countries with different prevalence profiles to the study in question. Also, importantly, as prevalence begins to fall as vaccination coverage increases, will it still remain cost-effective to continue screening once prevalence is low, and down to what HBsAg prevalence level does it still remain cost-effective to continue?

5.2. Costs

Cost components that need to be considered in economic evaluations of screening and treatment for HBV include costs of screening, diagnostics, monitoring and drugs. This should involve both the cost of consumables as well as other costs including human resource costs (which are included to various extents in different studies).

A key driver of cost-effectiveness of a screen and treat strategy reported in some studies is the cost of antiviral drugs.9,11,12 The Rossi study used a drug cost of US$ 8089/year to represent the average cost of tenofovir and entecavir and varied this between US$ 7000 and US$ 9100, changing ICER by US$ 10 000, while still remaining cost-effective. Other costs were less important drivers of cost-effectiveness in their study. In the PROLIFICA study, the generic price of tenofovir (US$ 48) available for use in HIV programmes in SSA23 was used as the base case. It should be noted that this price is not currently available for most countries to treat HBV mono-infection. Using the current pharmaceutical drug price of US$ 20724 was reported to increase the ICER to US$ 1042/LY saved, whilst still remaining below the WTP threshold.

Screening costs varied between the studies, and were only found to be drivers of cost-effectiveness in the Wong10 and PROLIFICA studies. In the PROLIFICA study, despite an active community-based screening campaign, screening costs were low (US$ 7.43 per person offered screening) and the intervention remained cost-effective even if there was a 3-fold increase in screening costs. The Rein14 study in USA reported costs per person screened between US$ 40 and US$ 280, with the higher costs representing the more active outreach strategies.

It should also be noted that in HICs there are different cost components incurred (and included in these studies) for the management of end-stage liver disease, e.g. liver transplant. The cost-effectiveness of screen and treat strategies in HIC settings is partly due to the fact that early management reduces the risk of long-term sequelae, which can incur significant costs, e.g. estimated costs of managing cirrhosis is US$ 9000 per patient per year (pppy) and HCC is US$ 15 000 pppy in the Canadian study by Rossi et al.11 However, in LICs, where there are currently limited options for management of end-stage liver disease (no transplant, limited endoscopy facilities, limited palliative care) and where patients often die at home, with the family as the primary care-giver, the costs of the intervention might not offset the cost avoided of end-stage liver disease. Furthermore, the annual costs of managing liver disease are variable and largely unknown.25 The addition of a societal perspective analysis might be more appropriate in these settings.

5.3. Patient behaviour

Adherence to treatment and linkage to care were reported as key drivers of cost-effectiveness in some of the studies.11,13 Veldhuijzen et al. reported that variation in rates of linkage to care and treatment adherence had the largest influence on ICER (ICER varied by about €3000 over the ranges tested—39–75%, 50–100%, for linkage and adherence, respectively). In the PROLIFICA study, variation in treatment adherence was also a key driver of cost-effectiveness. However, rates of linkage into care were reported to be less influential on ICER in this study. The baseline value of linkage into care was high at 81%, likely aided by re-imbursement of transportation fees, clinics held in rural sites to facilitate access to treatment, active reminders about appointments, as well as good sensitization and counselling of screened participants during the study.

Linkage into care and adherence rates being drivers of cost-effectiveness should be unsurprising if one considers that in order to gain the health benefits of a screening programme, the infected person needs to start antiviral therapy to reduce their chance of progression to end-stage liver disease. Furthermore, when people drop out at later stages of the care cascade, the impact is reduced, but the initial costs have already been incurred. This highlights the importance of educating patients on the need for continued treatment that has potential implications for successful programmatic implementation. Many barriers exist to successful linkage to care including both health service and patient factors – poor health infrastructure, distance from screening site to health facility, lack of education and patient fear.

Uptake of screening is not reported to be a key driver of ICER in the studies; however, this does not imply that high participation levels in screening is not important, as when considering health impact alone, increasing uptake is the key. The implication of this result is that it is likely to be worthwhile performing screening and treatment even if participation screening is assumed to be low. This could be because screening costs are low relative to the costs and health benefits of treatment for those who are infected.

5.4. Age of cohort

Age of the cohort screened was reported as a significant driver of cost-effectiveness in the Hutton and Wong studies. The former varied aged of screened cohort from 20 to 60 years, showing variation of ICER of US$ 23 000–US$ 58 000; the latter showed ICER between US$ 60 000 and US$ 136 000 over similar ranges, and Rossi found that the screen and treat intervention is no longer cost-effective if the cohort is over 55 years, with a non-linear relationship between ICER and age. However, despite the finding in HICs that it is more cost-effective to screen and treat younger, rather than older people, there are ethical considerations around using age cut-offs and whether this should be used to guide these type of decisions.

5.5. Disease progression rates

Although the HBV models used slightly differing natural history structures and parameter assumptions, most of them showed that the cost-effectiveness was relatively sensitive to variations in disease progression rates used.

The Dutch study13 showed that varying parameters between a range representing fast to slower disease progression showed significant variation in ICER between €5000 and €60 000/QALY gained, respectively, a trend which was also seen in other studies.10,12 The Eckman study showed that the ICER was most sensitive to the rate of spontaneous HBeAg seroconversion assumed to be 5% at baseline, but exceeded the WTP threshold if increased to 10%. PROLIFICA study also showed that many of the transition rates were influential on ICER.

However, given the complex and heterogeneous natural history of HBV both within and between populations, and lack of natural history progression rate data specific to all populations, this is likely to remain an inherent limitation of all CE models for HBV. However, the ICER did remain below the WTP threshold used in the respective studies for most of the ranges used.

5.6. Effectiveness of antiviral therapy

Effectiveness of antiviral therapy was found to be influential on ICER in some studies.10,12 However, different antivirals and different efficacy assumptions (which have often been superceded with more current data) were used by different authors (the older studies often included low-barrier to resistance drugs like lamivudine or interferon, whilst the newer studies mainly used tenofovir or entecavir). Therefore, conclusions as to the influence of these parameters on the result, as well as comparisons between studies have to be interpreted with caution.

With the recommendation of the use of newer drugs like tenofovir and entecavir, with similar high efficacy rates and better data on efficacy, model inconsistencies regarding efficacy assumptions should be less of a problem with economic analyses in the future. It needs to be noted that this will be dependent on the assumption that efficacy of antiviral therapy will be the same in HBV infected populations in LMICs as in HICs where most of the efficacy literature originates from.

5.7. Distribution of patients between different disease states

The proportion of HBsAg-positive patients with “stable infection”, i.e. CHB not requiring treatment was seen as one of the drivers of cost-effectiveness in some studies. Rossi estimated that 50% of migrants diagnosed with CHB would be eligible for treatment, i.e. they had active chronic infection. They found that the ICER was sensitive to the proportion with stable infection, which when decreased from 70% to 30% increased ICER from US$ 37 000 to US$ 48 000/QALY saved. Veldhuijzen et al. assumed that 26% of HBeAg positive patients and 19% of HBeAg negative patients would be eligible for treatment according to Dutch HBV treatment guidelines, but did not comment on its influence on ICER. In contrast, within the PROLIFICA study, less than 10% of patients were considered eligible for treatment (in states of chronic active hepatitis, compensated cirrhosis or decompensated cirrhosis), and when a lower proportion of HBsAg positive people had stable CHB infection, the ICER decreased, i.e. the intervention became more cost-effective.

The explanation for the differences in eligibility criteria is beyond the scope of this current report, but might be partially explained by population characteristics (especially between HBV in Asian and African populations)26,27 and the use of different local guidelines to classify treatment eligibility. The natural history structures are different between models, therefore direct conclusions cannot be drawn from these studies. The proportion of people who would benefit from treatment in a population, is likely to guide cost-effectiveness, but by how much is difficult to quantify based on current evidence and needs further research.

5.8. Others

Other drivers of cost-effectiveness included factors that are inherent to some of the techniques used in economic analysis, e.g. health utility values used for QALY assumptions810 and discount rate used.10,16 However, these are not discussed further in this report.

6. Limitations of comparing models/generalizability of results

WHO recommendations are primarily aimed for use in LMICs. Therefore, most of the studies summarized in this report have to be interpreted with extreme caution as they have mostly been conducted in HICs. The application of results from one setting cannot be translated into another setting. Conclusions drawn by making generalizations of results from cost-effectiveness analyses between countries or regions with such differing health-care structures, costs, patient behaviour, disease prevalence profiles and WTP thresholds can be misleading.

Comparison of model results are also hindered by differences in model structures, base-line scenarios used, populations under consideration, costs components included and varying assumptions around models parameters. The most useful health outcome measures to be used for cost-effectiveness analyses are also debated, and vary between studies, as do WTP thresholds.

In order to fully answer the question of what the most cost-effective approach is, ideally, a cost-effectiveness analysis is needed which is as specific as possible to the setting being considered as well as the strategies under consideration. However, this is obviously time and labour intensive.

7. Other considerations regarding place of screening

7.1. Community-level

Community-level screening could be considered the most active type of case-finding strategy with outreach components and therefore likely the most labour and resource intensive. However, within PROLIFICA, it has been found to be cost-effective, with low screening costs of US$ 7.43 per person offered screening. Various examples of community outreach programmes exist in the field of HIV,28 and comparable strategies could be considered for HBV, with the caveat that “high-risk” groups will not be as applicable to HBV infection.

7.2. Health-care facilities

Screening at health-care facilities could include primary-care settings, inpatient and outpatient settings. It could include testing everyone, regardless of the reason for presentation or focus on only those with abnormal liver function tests, abnormal ultrasound scan, family history of liver disease or other clinical suspicion of liver function test. Testing could also be offered in special dedicated clinics, e.g. HIV, STD clinics.

A clinically guided testing approach is likely to reveal a higher proportion of people with HBV in highly endemic settings and therefore a lower cost per positive person found. Preliminary data from Mboup et al. (Senegal – verbal communication) where HBsAg screening is performed in the hospital guided by clinical reasons in the health facility (inpatient and outpatient settings), shows that out of 1000 people screened, 567 have been found to be HBsAg-positive (56.7% of those tested).

However, when considering performing a cost-effectiveness analysis of health facility-based screening, the difficulty arises in adjusting for background mortality among those seeking health care. It will depend on many factors, including underlying comorbidities and age distribution and is likely to be highly heterogeneous between settings. Research into this is ongoing (Hess et al.).

7.2.1. ANC clinics

Cost-effectiveness of ANC screening, linkage into care and antiviral treatment for the mother (for the health benefit of the mother, rather than just the child), could be affected by the fact that women have been shown to have slower rates of progression to HCC29 and have lower prevalence of HBsAg than men.30 However, women attending ANC screening are likely to be of a younger age group than those reached by community-based screening, with a longer life expectancy, and therefore can potentially have more impact. The prevalence of HBsAg in women of childbearing age will also depend on the historical vaccination coverage in the country and the percentage of HBeAg-positive mothers will partly depend on the average childbearing age of the country and the rate of HBeAg loss in the region under consideration.31 However, most importantly, since screening of mothers for HBV has benefits to both the mother and child, this is likely to be cost-effective.

Since there is variable percentage of attendance to antenatal care depending on the world region (ref), with this being the lowest in sub-Saharan Africa (SSA) (77% of women have at least one ANC visit, only 48% have four ANC visits),32 this approach should also take into factors which will help strengthen ANC coverage in general and awareness campaigns.

7.2.2. Blood banks

Blood donor screening for HBV already forms part of WHO recommendations in order to prevent transmission of blood-borne viruses to the recipient.33 However, this is rarely accompanied by the HBsAg positive donor being informed of this positive result, counselled and linked into care for clinical evaluation and treatment.34

As part of the PROLIFICA study, linkage into specialist care for blood donors who had tested HBsAg-positive at the blood bank was performed (Lemoine et al., forthcoming). The main difference found between the cohort of blood donors and those screened in the community were a higher proportion who were tested HBsAg-positive, a majority of whom were males, of younger ages, with a higher proportion requiring treatment and a lower proportion who linked to care. A formal cost-effectiveness analysis has not yet been performed, but these factors are likely to make it even more cost-effective for this cohort, compared to the cohorts who were screened in the community. However, as blood donors form only a small fraction of the population, this strategy is likely to be limited in its reach and population level effectiveness and probably should be seen as a complementary, rather than as an alternative to a wider screening strategy.

7.3. Workplace

Other ongoing research in West Africa as part of the PROLIFICA programme includes HBsAg screening in workplaces in Senegal (Mboup et al., unpublished data). Epidemiological and cost-effectiveness studies are underway. Provisional data shows that compared to community screening, there is a higher HBsAg prevalence, higher proportion of males uptaking screening and a higher proportion requiring treatment.

7.4. Others

Although other methods of screening are used, to varying levels, worldwide, including screening of health workers, couples pre-marriage, military recruits or pre-employment screening, etc., implementation and guidance of these methods are highly heterogeneous between countries;35 and apart from the study in Iran (below), no data was found regarding their cost-effectiveness. Therefore, they will not be considered here in further detail. The study in Iran36 looked at premarital HBsAg testing, but this was in order to determine whether to offer the partner of someone who is tested HBsAg positive vaccination. This does not include linkage for treatment. Mandatory premarital testing is not policy in many countries and would therefore have limited reach and applicability.

8. Further research needed to fill this information gap

More implementational research in LMICs needs to be done to assess feasibility, impact and cost-effectiveness of different screening methods. Further research into the simplification of care, as well as health systems research into integration of hepatitis programmes with other health services (e.g. HIV services), could also help guide how impact can be maximised and cost-effectiveness improved.

Ongoing HBV cost-effectiveness screening analyses that are being conducted are as follows:

Screening in OPD settings – Sarah Hess, WHO

Screening in ANC – benefits to the mother, Sarah Hess, WHO

Screening in ANC – benefits to the child, Jess Howell, Imperial College

Screening in work places, Senegal – Shevanthi Nayagam, Imperial College.

9. Conclusions

The data on the cost-effectiveness of screening for HBV is lacking, especially in LMICs. Therefore, it is hard to draw conclusions regarding the best screening strategy in terms of who to screen and where to screen, based on cost-effectiveness alone. However, the data that is available shows that offering screening to the general population with subsequent antiviral treatment strategy is cost-effective in HICs8 as well as LICs,9 even down to a population prevalence as low as 0.3% and 2%, respectively in these studies. Furthermore, screening also has benefits that extend beyond the person screened but also others, e.g. prevention of mother-to-child transmission.

Relatively low screening costs, highly effective and relatively low-cost antiviral therapy at generic price and a fraction of HBsAg-positive persons requiring antiviral therapy should help drive the cost-effectiveness of a test and treat strategy. However, this has to be balanced against long-term treatment and the fact that a high proportion with CHB will survive without treatment. Finite treatment courses in certain patient groups are showing promising results and this could help increase cost-effectiveness further.37 Improving country access to generic priced tenfovir for HBV mono-infection in all LMICs is vital to allowing adoption of wide scale HBV treatment programmes. Other strategies for reducing costs further include integration of HBV services into existing health-care structures, particularly in SSA where enormous progress has been made in the scale-up of HIV services, which may be expanded to also deliver HBV interventions using existing infrastructure, trained health-care professionals and field teams.

Although general guidance cannot be given based on the evidence, a pragmatic approach is to encourage screening anywhere that it is feasible within the country context, e.g. it can include ANCs, health-care facilities and blood banks. PROLIFICA has shown that population-level screening is feasible and cost-effective in The Gambia, but further research and large-scale implementation studies should be performed to evaluate this further in other high-endemic, low-income settings. Furthermore, HBV screening costs could be shared across other disease programmes, as there are overlapping benefits and synergies with maternal and child health goals and HIV infrastructure and experience.

This report aims to summarize key components of the existing literature which has highlighted that apart from the PROLIFICA study in West Africa, there is no data about the cost-effectiveness of screening and treatment in LMICs. Currently, there is not enough literature to make strong recommendations for screening based on cost-effectiveness arguments alone, and further research needs to be done to fill this gap, using similar real life screening data in LMICs like the PROLIFICA project. However, cost-effectiveness analyses form only a small part of guiding public health recommendations, and the overall health impact and key drivers should be considered.

References

1.
Schweitzer A , HornJ, MikolajczykRT, KrauseG, OttJJ. Estimations of worldwide prevalence of chronic hepatitis B virus infection: a systematic review of data published between 1965 and 2013. Lancet. 2015;386(10003):1546–55. [PubMed: 26231459]
2.
Papatheodoridis G , SypsaV, KantzanouM, NikolakopoulosI, HatzakisA. Estimating the treatment cascade of chronic hepatitis B and C in Greece using a telephone survey. J Viral Hepat. 2015;22(4):409–15. [PubMed: 25209157]
3.
Cohen C , HolmbergSD, McMahonBJ, BlockJM, BrosgartCL, GishRG, et al. Is chronic hepatitis B being undertreated in the United States?J Viral Hepat. 2011;18(6):377–83. [PubMed: 21143343]
4.
Allard NL , MacLachlanJH, CowieBC. The cascade of care for Australians living with chronic hepatitis B: measuring access to diagnosis, management and treatment. Aust N Z J Public Health. 2015;39(3):255–9. [PubMed: 25716519]
5.
Andermann A , BlancquaertI, BeauchampS, DeryV. Revisiting Wilson and Jungner in the genomic age: a review of screening criteria over the past 40 years. Bull World Health Organ. 2008;86(4):317–9. [PMC free article: PMC2647421] [PubMed: 18438522]
6.
Hahne SJ , VeldhuijzenIK, WiessingL, LimTA, SalminenM, LaarM. Infection with hepatitis B and C virus in Europe: a systematic review of prevalence and cost-effectiveness of screening. BMC Infect Dis. 2013;13(1):181. [PMC free article: PMC3716892] [PubMed: 23597411]
7.
Lemoine et al. Screen and treat as an intervention programme for hepatitis B virus infection in sub-Saharan Africa: the PROLIFICA experience in the Gambia (Manuscript in progress).
8.
Eckman MH , KaiserTE, ShermanKE. The cost-effectiveness of screening for chronic hepatitis B infection in the United States. Clin Infect Dis. 2011;52(11):1294–306. [PMC free article: PMC3097367] [PubMed: 21540206]
9.
Nayagam et al. An economic evaluation of community-based screening and treatment for chronic hepatitis B in the Gambia (Manuscript in progress).
10.
Wong WW , WooG, JennyHeathcote E, KrahnM. Cost effectiveness of screening immigrants for hepatitis B. Liver Int2011;31(8):1179–90. [PubMed: 21745300]
11.
Rossi C , SchwartzmanK, OxladeO, KleinMB, GreenawayC. Hepatitis B screening and vaccination strategies for newly arrived adult Canadian immigrants and refugees: a cost-effectiveness analysis. PLoS One. 2013;8(10):e78548. [PMC free article: PMC3799697] [PubMed: 24205255]
12.
Hutton DW , TanD, SoSK, BrandeauML. Cost-effectiveness of screening and vaccinating asian and pacific Islander adults for hepatitis B. Ann Intern Med. 2007;147(7):460–9. [PubMed: 17909207]
13.
Veldhuijzen IK , ToyM, HahnéSJ, De WitGA, SchalmSW, de ManRA, et al. Screening and early treatment of migrants for chronic hepatitis B virus infection is cost–effective. Gastroenterology. 2010;138(2):522–30. [PubMed: 19879275]
14.
Rein DB , LesesneSB, SmithBD, WeinbaumCM. Models of community-based hepatitis B surface antigen screening programs in the US and their estimated outcomes and costs. Public Health Rep. 2011;126(4):560–7. [PMC free article: PMC3115215] [PubMed: 21800750]
15.
Ruggeri M , CicchettiA, GasbarriniA. The cost-effectiveness of alternative strategies against HBV in Italy. Health Policy. 2011;102(1):72–80. [PubMed: 21035229]
16.
Jazwa A , ColemanMS, GazmararianJ, WingateLT, MaskeryB, MitchellT, et al. Cost–benefit comparison of two proposed overseas programs for reducing chronic hepatitis B infection among refugees: is screening essential?Vaccine. 2015;33(11):1393–9. [PMC free article: PMC4633992] [PubMed: 25595868]
17.
United Nations Statistics Division. UN data – Gambia: Country profile. In: World Statistics Handbook. New York: United Nations; 2014 (http://data​.un.org/CountryProfile​.aspx?crName=gambia, accessed 07 June 2016).
18.
Hahne SJ , VeldhuijzenIK, WiessingL, LimTA, SalminenM, LaarM. Infection with hepatitis B and C virus in Europe: a systematic review of prevalence and cost-effectiveness of screening. BMC Infect Dis. 2013;13:181. [PMC free article: PMC3716892] [PubMed: 23597411]
19.
Barbosa C , SmithEA, HoergerTJ, FenlonN, SchillieSF, BradleyC, et al. Cost–effectiveness analysis of the National Perinatal Hepatitis B Prevention Program. Pediatrics. 2014; 133(2):243–53. [PubMed: 24394684]
20.
Fan L , Owusu-EduseiK, Jr, SchillieSF, MurphyTV. Cost-effectiveness of testing hepatitis B-positive pregnant women for hepatitis B e antigen or viral load. Obstet Gynecol. 2014;123(5):929–37. [PMC free article: PMC4682356] [PubMed: 24785842]
21.
Vimolket T , PoovorawanY. An economic evaluation of universal infant vaccination strategies against hepatitis B in Thailand: an analytic decision approach to cost–effectiveness. Southeast Asian J Trop Med Public Health. 2005;36(3):693–9. [PubMed: 16124440]
22.
Rossi C , ShrierI, MarshallL, CnossenS, SchwartzmanK, KleinM, et al. Seroprevalence of chronic hepatitis B virus infection and prior immunity in immigrants and refugees: a systematic review and meta-analysis. PLoS One. 2012;7:e44611. [PMC free article: PMC3434171] [PubMed: 22957088]
23.
HIV/AIDS: Global Price Reporting Mechanism. Geneva: World Health Organization; 2011 (http://apps​.who.int/hiv/amds/price/hdd/, accessed 07 June 2016).
24.
MSF Access Campaign. Untangling the Web of Antiretroviral Price Reductions. 17th Edn. Geneva: Médecins Sans Frontières; 2014.
25.
Aggarwal R , GhoshalUC, NaikSR. Assessment of cost–effectiveness of universal hepatitis B immunization in a low-income country with intermediate endemicity using a Markov model. J Hepatol. 2003;38(2):215–22. [PubMed: 12547411]
26.
Hadziyannis SJ . Natural history of chronic hepatitis B in Euro-Mediterranean and African countries. J Hepatol. 2011;55(1):183–91. [PubMed: 21238520]
27.
Lin X , RobinsonNJ, ThurszM, RosenbergDM, WeildA, PimentaJM, et al. Chronic hepatitis B virus infection in the Asia–Pacific region and Africa: review of disease progression. J Gastroenterol Hepatol. 2005;20(6):833–43. [PubMed: 15946129]
28.
Suthar AB , FordN, BachanasPJ, WongVJ, RajanJS, SaltzmanAK, et al. Towards universal voluntary HIV testing and counselling: a systematic review and mta–analysis of community-based approaches. PLoS Med. 2013;10(8):e1001496. [PMC free article: PMC3742447] [PubMed: 23966838]
29.
Kirk GD , LesiOA, MendyM, AkanoAO, SamO, GoedertJJ, et al. The Gambia Liver Cancer Study: Infection with hepatitis B and C and the risk of hepatocellular carcinoma in West Africa. Hepatology. 2004;39(1):211–9. [PubMed: 14752840]
30.
Blumberg BS . Sex differences in response to hepatitis B virus. I. History. Arthritis Rheum. 1979;22(11):1261–6. [PubMed: 508376]
31.
Ott JJ , StevensGA, WiersmaST. The risk of perinatal hepatitis B virus transmission: hepatitis B e antigen (HBeAg) prevalence estimates for all world regions. BMC Infect Dis. 2012;12:131. [PMC free article: PMC3478174] [PubMed: 22682147]
32.
Global Health Observatory Data Repository. Geneva: World Health Organization; 2016 (http://apps​.who.int/gho/data/node.main, accessed 07 June 2016).
33.
WHO Global Database on Blood Safety Summary Report. Geneva: World Health Organization; 2011 (http://www​.who.int/bloodsafety​/global_database​/GDBS_Summary_Report_2011.pdf, accessed 07 June 2016).
34.
Allain JP , Opare-SemO, SarkodieF, RahmanR, Owusu-OforiS. Deferred donor care in a regional hospital blood center in Ghana. Transfusion. 2009;49(4):669–75. [PubMed: 19170991]
35.
Hatzakis A , Van DammeP, AlcornK, GoreC, BenazzouzM, BerkaneS, et al. The state of hepatitis B and C in the Mediterranean and Balkan countries: report from a summit conference. J Viral Hepat. 2013;20(Suppl 2):1–20. [PubMed: 23827008]
36.
Adibi P , RezailashkajaniM, RoshandelD, BehrouzN, AnsariS, SomiM H, et al. An economic analysis of premarriage prevention of hepatitis B transmission in Iran. BMC Infectious Diseases. 2004;4(31). [PMC free article: PMC517713] [PubMed: 15347430]
37.
Berg T , SimonKG, MaussS, SchottE, HeyneR, KlassD, et al. O119. Stopping tenofovir disoproxil fumarate (TDF) treatment after long term virologic suppression in HBeAg-negative CHB: week 48 interim results from an ongoing randomized, controlled trial (“finite CHB”). J Hepatol. 2015;62(2):S253.

Annex 5.2. PICO 2 - Who to test (HCV)
Literature review on cost-effectiveness of HCV screening, treatment strategies and applicability to LMICs

Authors

, Team Lead and .

Affiliations

1 Boston University School of Medicine, Boston, USA

1. Executive summary

We conducted a targeted review of the literature to determine the state of evidence about the cost–effectiveness of testing for HCV in different types of epidemics and among different risk groups. We provide a qualitative assessment of conclusions.

5.

Testing in high-risk groups such as persons who inject drugs (PWID), men who have sex with men (MSM), prisoners, HIV-infected persons, and commercial sex workers is likely to be cost–effective. Testing in settings with a high prevalence of high-risk patients is almost certainly cost–effective in all locations. It is important, however, to ensure adequate follow up after diagnosis.

6.

The best approach to testing outside of high-risk risk groups depends a great deal on a country’s unique HCV epidemiology. Most countries have at least some component of “birth cohort” epidemic, and “birth cohort” testing is likely cost–effective in most settings.

7.

Routine testing of the entire population carries two risks. First, when the HCV epidemic is concentrated to a specific age or risk group, generalized testing can dilute the testing effort and reduce the number of HCV cases identified. Second, if an epidemic is highly concentrated with a specific risk or demographic group, screening outside of that group can be inefficient and increase cost. Countries with high HCV prevalence across the entire population should implement routine screening, but in most epidemics, routine screening in the entire population is likely not be cost-effective. The specific threshold at which a country should alter its approach to routine testing, however, is a function of multiple factors and cannot be identified more generally.

2. Background

Hepatitis C virus (HCV) is a global public health burden and major cause of morbidity and mortality including liver failure and hepatocellular carcinoma.1,2 Current global HCV seroprevalence is estimated to be 2.8%, or more than 185 million infected individuals worldwide.3 Historically, it has been very difficult to treat HCV and most cases of HCV have gone unidentified. The advent of high-efficacy, low-duration therapy, however,4 generates new enthusiasm for testing for HCV infection, linking infected patients to care, and curing HCV before patients begin to experience the consequences of cirrhosis and end-stage liver disease.

It is not clear, however, exactly who should be targeted for HCV testing. Similar to the conversation around HIV testing, there are several approaches to screening for HCV that may provide high yield and improve outcomes including: 1) targeted testing of the highest-risk groups, 2) routine testing among specific demographic groups that are readily identified and who have a high prevalence of HCV infection, and 3) routine testing throughout the entire population. This review develops a rubric by which to measure and characterize the HCV epidemic within a country, surveys the literature about the cost–effectiveness of screening for HCV in various populations, and discusses how epidemiology within a country should inform decision-making about who to test for HCV.

3. Overview of report

This report does not represent the results of a full systematic review. It is meant to serve as a summary of existing studies on cost–effectiveness of screening and treatment for HCV, with an analytic summary of key considerations. It was envisaged that there was a lack of relevant literature in low- and middle-income countries (LMICs), so existing studies from high-income countries (HICs) are described and their potential uses and limitations, when drawing conclusions are discussed.

4. Summary of global HCV epidemiology

Generally, HCV epidemics around the world are heterogeneous and represent mixtures of three core epidemic components:

4.

Infection related to high-risk behaviours: In essentially every geographical region, the highest prevalence of HCV infection is among persons who use injection drugs (PWID).5,6 The prevalence of injection drug use differs between countries and regions, but within those who do inject drugs, HCV prevalence is nearly universally high. Commercial sex workers and prisoners also have increased prevalence (presumably related to both drug use and perhaps sexual transmission),7,8 as do men who have sex with men, especially those who are HIV infected.9 In many cohorts of PWID in North America, Europe, and Asia, HCV prevalence ranges from 30% to 75%.

5.

Infection related to past generalized exposures that have since been identified and removed: This epidemic pattern, in which there is a high prevalence of HCV within a given age group, is commonly referred to as a “birth cohort epidemic”.10 While typically identified as being the infection pattern in North America and Europe, many nations have some element of birth cohort epidemics with their unique HCV epidemiology (Table 1).11 Birth cohort epidemics reflect an HCV exposure source that was once present and to which a large portion of the population was exposed, but that has since been identified and removed. For example, before it was identified and sequenced, HCV infected the blood supply of many countries in all regions of the world. When the blood supply began to be screened for the presence of HCV, the exposure was removed. As a result, the incidence of HCV fell dramatically among the general population, but there remains a burden of prevalent, chronic HCV among patients who were alive and likely to get a blood transfusion during the time that HCV existed in the blood supply.

6.

Generalized population epidemic: This pattern is related to a widespread exposure, often iatrogenic, that results in high prevalence (8–10%) across essentially all age groups. Note that the primary difference between a “birth cohort” pattern and a generalized pattern of infection is the duration of time that the generalized exposure existed and whether it has been removed or mitigated. An example of a generalized exposure is the common use of reusable hypodermic syringes and needles in medical settings without adequate sterilization between uses.

Few epidemics fall into one of the above three categories. Rather, most are mixed, and represent some combination of all components (Table 1). The nature of an epidemic within a specific country determines a great deal about the appropriate approaches to who to screen.

Epidemic scenarios HCVDefinitionDisaggregationCountry example
Generalized High (>5%)With birth cohort(N=23) Cameroon, CAR, Armenia, Egypt, Liberia, Gabon, Guinea, Ghana, Guinea-Bissau, Mongolia, Sierre Leone, Uzbekistan, Cape Verde, Chad, Mali, Niger, Nigeria, Pakistan, San Tome et Principe, Senegal, Togo, Burkina Faso, Georgia
Without birth cohort
High intermediate (3–5%)With birth cohort(N=14) Angola, Bahrain, Congo, Democratic Republic of the Congo, Equatorial Guinea, Estonia, Lebanon, Moldova, Russia, Taiwan, Turkmenistan, Ukraine, United Arab Emirates, Oman
Without birth cohort
Low intermediate (2–3%)With birth cohort(N=44) American Samoa, Anguilla, Azerbaijan, Benin, Bermuda, British Virgin Isles, Cayman Islands, Cook Islands, Cote d’Ivoire, Falkland Isalnds, Faroe Islands, Gibraltar, Greenland, Holy See, Hong Kong, Iraq, Isle of Man, Jordan, Kazakstan, Kuwait, Kyrgzstan, Latvia, Lichtenstein, Lithuania, Macau, Monaco, Monserrat, Nauru, Niue, Northern Mariana, Islands, Palau, Palestine, Romania, St Helena, St Kitts and Nevis, St Pierre Miquelon, San Marino, St Martin, Tajikistan, Thailand, Tokelau, Turks and Kakos, Tuvalu, Wallis and Futuna
Without birth cohort
Mixed Generalized population prevalence, low, moderate or high with a sizeable risk population (PWID)High generalized(N=3) Pakistan, Egypt, Uzbekistan
High intermediate generalized(N=5) Estonia, Kazakstan, Taiwan, Turkmenistan, Ukraine
Low intermediate generalized(N=8) Hong Kong, Latvia, Lithuania, Palestine, Romania, Thailand, Tajikistan, Syria
Low (1–2%) with PWID(N=46) Albania, Algeria, Argentina, Australia, Belarus, Bhutan, Bosnia, Brazil, Cambodia, Chile, China, Colombia, Costa Rica, Croatia, El Salvador, Greece, Honduras, Israel, Italy, Japan, Kenya, Former Yugoslav Republic of Macedonia, Malaysia, Mauritius, Mexico, Montenegro, Morocco, Myanmar, Nepal, New Zealand, Nicaragua, Panama, Paraguay, Portugal, Puerto Rico, Serbia, Slovakia, Slovenia, South Sudan, Spain, Switzerland, United States, United States Virgin Islands, Uruguay, Viet Nam, Yemen
Low (1–2 %) without PWID(N=8) Botswana, Ethiopia, The Gambia, Guadalope, Lesotho, Rwanda, Saudi Arabia, Singapore
(N=21) Andora, Antigua Comorres, Curacao, Democratic People’s Republic of Korea, Dominica, French Guinea, French Polynesia, Guatemala, Martinique, Mauritania, Mayotte, Namibia, New Caledonia, Reunion, Seychelles, South Africa, Sri Lanka, Swaziland, Western Sahara, Zimbabwe
Concentrated Generalized population prevalence <1% with high-risk groups(N=68) Afghanistan, Aruba, Austria, Bahamas, Bangladesh, Barbados, Belgium, Belize, Bolivia, Brunei, Bulgaria, Burundi, Canada, Cuba, Cyprus, Czech Republic, Denmark, Djibouti, Dominican Republic, Ecuador, Eritrea, Fiji, Finland, France, Germany, Grenada, Guyana, Haiti, Hungary, Iceland, India, Indonesia, Iran, Ireland, Jamaica, Kiribati, Korea Republic of, Laos, Libya, Luxembourg, Madagascar, Maldives, Marshall Islands, Micronesia, Mozambique, Netherlands, Norway, Papua New Guinea, Peru, Philippines, Poland, Qatar, St. Lucia, Samoa, Solomon Islands, Somalia, Surinam, Sweden, Tanzania, TimorLeste, Tonga, Trinidad & Tobago, Tunisia, Turkey, Uganda, United Kingdom, Vanuatu, Zambia

5. Summary of the literature – Who to screen? What is the evidence base from modelling of the impact and cost– effectiveness of different screening approaches using different prevalence thresholds?

Testing in high-risk groups, including persons who inject drugs, MSM, prisoners, HIV-infected persons, and commercial sex workers

5.1. Persons who inject drugs

Multiple analyses in many geographical regions concur that routine testing for HCV in venues with a high prevalence of persons who inject drugs is cost–effective, even when the studies assume very poor follow-up rates and limited access to therapy.12,13 Further, dynamic HCV transmission models suggest that aggressive diagnosis and treatment among current drug users could reduce the incidence of HCV – “cure as prevention”.14,15 With typical prevalence estimates of 40%, but ranging as high as 75% in some cohorts, routine screening for HCV is almost certainly cost–effective. It is essential to consider the HCV cascade of care when screening recent or current drug users. Modelling studies demonstrate that even 100% effective HCV therapy has almost no impact on population-level outcomes without efforts to significantly improve the number of HCV-infected patients who initiate therapy.16

5.2. Men who have sex with men

Men who have sex with men (MSM) are also at an increased risk of HCV incidence, particularly if they are also HIV-positive. Since the mid-2000s, outbreaks have surfaced in the US, Europe and Australia among HIV-positive MSM.17,18 Cost–effectiveness modelling has found testing using liver function tests in combination with HCV Ab testing to be cost–effective in the HIV-positive MSM population.19 Preliminary studies have suggested that core-antigen testing has the potential to be cost–effective in this population as well.20 The results of these studies are dependent on appropriate linkage to effective therapy and retention in care. These studies do not fully account for either the reduction in secondary transmission or the possibility of reinfection in high-risk groups.

5.3. Prisoners

Prisons likely have high HCV prevalence as the result of a high prevalence of persons who inject drugs in prisons. One challenge to HCV testing in prisons is that new treatments for HCV are costly and many prisoners do not have access to new therapies. A UK-based study, however, found that HCV case detection, using dried blood spot testing, was cost–effective, even when the model assumed low rates of HCV treatment initiation.21 A second study concurs that screening in prisons can be cost–effective, but this study concluded that targeting screening to those prisoners with a history of injection drug use improves cost– effectiveness22 A later study by several of the same authors found that routine screening of all prisoners is not cost–effective, although that study found significant uncertainty in the results. If the prison population had more advanced disease at the time of screening, or if the rate of HCV disease progression is faster than estimated in the base case, then routine screening in prisons can be cost–effective.23

5.4. HIV-infected persons

Screening for incident and acute HCV in HIV-infected MSM is likely cost–effective.19 Although nearly every guideline for HCV care recommends HCV screening at enrolment in care, we were not able to find a cost-effectiveness analysis that answers the specific question of the cost-effectiveness of HCV testing at enrollment in HCV care. Because the prevalence of HCV is known to be high in HIV-infected persons, the pace of progression of fibrosis in HIV/HCV-coinfected patients is high, and new therapies to treat HCV are effective in HIV/HCV coinfection, testing for HCV at enrolment in HCV is almost certainly cost–effective.

5.5. Sex workers

We were not able to find a study that addresses the cost–effectiveness of HCV testing in sex workers. Because many sex workers are also PWID or non-injection drug users, the prevalence of HCV in this group is likely high. It is not clear at this time, however, if it is cost–effective to routinely screen all sex workers, compared to an approach that targets testing to sex workers who report a history of injection drug use.

5.6. Testing among easily identified age or demographic groups known to have high HCV prevalence (“birth-cohort testing”)

Whenever there is an easily identified demographic group that has high HCV prevalence (for example, all individuals born in a certain time period) it is likely cost–effective to routinely test for HCV within that cohort. Several cost–effectiveness studies in the US estimate incremental cost–effectiveness ratios of “birth cohort” screening that are below commonly cited willingness to pay thresholds for resource-rich countries.10, 245 Each of these studies compared “birth cohort testing” to the current standard of care, and shared the same qualitative conclusions. Similarly, one study from Portugal found that birth cohort testing was cost–effective in that country.26 Notably, based on Portugal’s local HCV epidemiology, the cohort to test is not identical to that in the US. Routine screening is preferred to targeted screening because providers are often not skilled at identifying high-risk behaviours, and because for many patients in such an epidemic, the “risk” to target is simply being a member of a high-prevalence age cohort (i.e. there are no specific behavioural risks to identify).

5.7. Testing among the general population without attempt to identify high-risk behaviours or characteristics (“routine testing”)

At this time, no jurisdiction of which we are aware recommends routine testing for all individuals regardless of demographics or specific behavioural risk. The data about population screening typically come from HICs such as the US and UK, and such studies find that routine testing in the general population is not cost–effective. For example, one cost–effectiveness analysis, conducted in the US context, found that when the general population prevalence of HCV infection exceeded 0.53%, the incremental cost–effectiveness ratio of routine universal screening compared to targeted screening was far below commonly cited US willingness to pay thresholds.27 When compared to “birth cohort testing,” however, universal testing resulted in worse outcomes and higher costs than the birth cohort approach. This analysis raises the spectre that in countries whose HCV epidemic is largely concentrated to a specific birth cohort or demographics group, attempting to identify cases by routine testing of the entire population can dilute the testing effort and result in fewer cases of HCV being identified.

Similarly, a recent study in the US context investigated the cost–effectiveness of two approaches to testing for HCV in average-risk, asymptomatic adults accessing primary care: a) HCV EIA followed by quantitative RNA for those with positive EIA results, and b) quantitative RNA for all patients. Neither strategy was cost–effective.28

An older study, conducted in the UK, also found that although screening high-risk groups in primary care settings was cost–effective, extending screening beyond high-risk individuals was not.29 Importantly, however, that study pre-dates the existence of effective, antiviral therapy targeting HCV. Higher efficacy of therapy could improve cost–effectiveness conclusions.

Similarly, a study conducted in Japan found that routine testing of the population was cost–effective compared to “no screening.”30 That paper, however, did not consider a birth cohort approach, and the conclusions therefore are not certain.

Another analysis, conducted in Italy, used Markov modelling to compare “testing” to “no testing” among patients who had undergone surgery. They found that testing was not cost–effective in this group.31 Notably, individuals who have undergone surgery are more likely to have had exposure to blood products, and therefore likely have a higher HCV prevalence then the general population. If screening among these patients was not cost– effective, screening in even lower prevalence groups, such as the general population, will also not be cost–effective.

There is one recent study, conducted in Canada, that found that one-time testing of patients outside the “birth cohort” of those aged 65 years or older would be cost–effective by Canadian standards.32 It is difficult from that manuscript to determine the epidemiological assumptions that led to this finding, which differs from most US-based studies. One assumption that could have influenced the results was that early-stage HCV had a low quality of life, which tends to make screening and treating HCV more cost–effective.

Similarly, a modelling study based on ten years of retrospective data at a London antenatal clinic found that routine testing for HCV for pregnant women was cost–effective, even at baseline prevalence levels as low as 0.1%.33 This contradicts the findings of a 2005 paper based in the US, which found that screening of asymptomatic pregnant women in the US, even when coupled with elective caesarean delivery to minimize antenatal transmission risk, was not cost–effective.34 It also contradicts a paper based in the Netherlands that found that adding routine one-time testing for HCV in antenatal clinics would not be cost–effective.35 These disparate findings may be influenced by estimates of fibrosis progression, discounting rates, and health-care costs in each country.

Importantly, all of the above studies reflect the epidemiology of HCV in HICs. One recent paper explicitly studied the cost–effectiveness in Egypt of one-time, routine screening for HCV followed by treatment with either pegylated interferon and ribavirin (PEG-RBV) or PEG-RBV plus an HCV protease inhibitor.36 Given the very high prevalence of disease, screening was always cost–effective, and often cost-saving. It is important to consider, however, that assumptions about linkage to HCV care and availability of treatment after diagnosis impact cost–effectiveness conclusions. If general population screening will likely identify many cases of HCV, but those who are infected have limited options for treatment, screening may not be cost–effective.

6. Drivers of cost–effectiveness

The main benefit of testing is identifying cases of HCV before they lead to the sequelae of end-stage liver disease; the resource implications of testing broadly are important. First, the cost of testing itself is not trivial. Second, if the testing strategy (i.e. the laboratory protocol one uses to identify HCV exposure and test for HCV viraemia) results in a large number of false-positive tests, the cost of unnecessary HCV therapy could be very large. At the same time, trying to “over target” testing to only the highest-risk groups can be detrimental to public health. Many high-risk behaviours are stigmatized and underreported, and health-care workers are not always skilled at identifying high-risk behaviours. Balancing these considerations is a challenge, and requires country-level determination of best approaches. General themes that should inform the screening approach include the following:

  1. HCV prevalence – screening provides increasing value as prevalence rises. In one US based study, screening was cost–effective (compared to no screening) at a US willingness to pay threshold down to prevalence of 0.53%.27 Importantly, however, choice of comparator impacts the incremental cost–effectiveness ratio of routine population testing. When routine testing was compared to “birth cohort testing” in that same paper, routine screening diluted the screening effort in the cohort with the highest prevalence of HCV and therefore resulted in fewer cases of HCV identified and higher cost than “birth cohort testing.” However, in any population subgroup that has HCV prevalence >1%, it is likely that some form of testing is cost–effective. The question in such scenarios is whether to routinely screen, or to attempt to identify risk and target screening to that group.
  2. Degree of concentration of the epidemic – to the extent that an epidemic is concentrated to a specific risk or demographic group, targeting screening to that group becomes more cost–effective. This dynamic is most directly at play when considering “birth cohort testing.” Being a member of a birth cohort is easily determined and generally carries no stigma. Thus, targeting testing to birth cohorts is feasible and often cost–effective. In countries with a strong birth cohort dynamic, birth cohort screening is likely preferred. To the extent that epidemics are concentrated among high-risk groups such as PWID, however, targeted testing is more challenging. Because HCV risk behaviours are stigmatized and underreported, trying to identify high-risk individuals is difficult and prone to under-testing high-risk patients.
  3. Treatment rates – screening clearly becomes less cost–effective when identified patients cannot link to effective therapy. US-based analyses typically assume availability of interferon-free regimens to cure HCV. If such treatments are not available, or only available to a limited proportion of identified cases, then the incremental cost– effectiveness ratio of screening increases.
  4. Assumptions about the HCV cascade of care – similar to treatment rates, loss to follow up has an important impact on cost–effectiveness conclusions. As the proportion of patients with identified HCV infection who successfully link to HCV care decreases, the incremental cost–effectiveness ratio of screening also goes up.
  5. Cost of testing – the cost of testing may impact the cost–effectiveness of one testing strategy compared to another (i.e. which tests to use and in what order), but it has little impact on the cost–effectiveness conclusions about who to screen. In one study conducted in the US, ranging the cost of testing by as much as 50% in either direction had no impact on cost–effectiveness conclusions.37
  6. Efficacy of HCV therapy – the cost–effectiveness of HCV testing depends in part on the efficacy of HCV treatment. This dynamic is easily demonstrated by a hypothetical scenario, in which patients with identified HCV do not receive any therapy (efficacy = 0%). In such a case, the incremental benefit of screening would be zero, and the incremental cost– effectiveness ratio would approach infinity (no value).
  7. Cost of HCV therapy – as the cost of treatment increases, the incremental cost– effectiveness ratio also increases. This is not surprising, as the cost of therapy has no impact on clinical outcomes (denominator of the cost–effectiveness ratio), but does increase cost (the numerator of the cost–effectiveness ratio). For example, in one US study, the incremental cost–effectiveness ratio of “birth cohort testing” compared to no testing increased more than 100% when one assumed treatment with pegylated interferon, ribavirin, and an HCV protease inhibitor compared to pegylated interferon and ribavirin alone.
  8. Estimates of quality of life with early-stage HCV – if early-stage HCV has a large impact on quality of life, then testing (via any approach) becomes more cost–effective. If early-stage HCV has little impact on quality of life, then the benefits of testing accrue only to the minority of patients who become cirrhotic, and only in the distant future when those patients begin to experience complications of end-stage liver disease. In contrast, if early-stage HCV has an immediate impact on quality of life, then every patient with identified and cured HCV accrues lifetime benefits that greatly increase the benefits of testing.
  9. HCV fibrosis progression rates – most of the sequelae of chronic HCV infection and essentially all HCV-attributable mortality, accrue only when a patient has reached cirrhosis. The time from HCV infection to development of cirrhosis is highly variable and can be as long as 25 years. Some patients never become cirrhotic. Faster rates of fibrosis progression tend to make testing for HCV more cost–effective, because faster fibrosis progression results in a larger proportion of the population experiencing sequelae of HCV.

7. What further research needs to be done to fill this information gap

It is important to collect accurate epidemiological data to better inform decision-making around HCV testing. A formal cost–effectiveness analysis that compares “targeted” vs “birth cohort” vs “routine” testing requires estimates of the prevalence of high-risk behaviours, stratified by age, the prevalence of HCV among those with high- and low-risk behaviours, stratified by age, and the age structure of the population. Further, it is important to know the cost of both HCV therapy in a country, as well as the costs associated with untreated HCV and end-stage liver disease. In addition, more implementation research in LMICs is needed to determine the degree to which providers can accurately identify and test high-risk patients when employing a targeted approach, as well as estimate of linkage to HCV care and the HCV cascade.

8. Conclusions – who should be tested for HCV?

  • Testing in high-risk groups such as PWID, MSM, prisoners, HIV-infected persons, and commercial sex workers is likely cost–effective. Testing in settings with a high prevalence of high-risk patients is almost certainly cost–effective in all locations. It is important, however, to ensure adequate follow up after diagnosis.
  • The best approach to testing outside of high-risk risk groups depends a great deal on a country’s unique HCV epidemiology. Most countries have at least some component of “birth cohort” epidemic, and “birth cohort” testing is likely cost–effective in most settings.
  • Routine testing of the entire population carries two risks. First, when the HCV epidemic is concentrated to a specific age or risk group, generalized testing can dilute the testing effort and reduce the number of HCV cases identified. Second, if an epidemic is highly concentrated within a specific risk or demographic group, screening outside of that group can be inefficient and increase costs. Countries with high HCV prevalence across the entire population should implement routine screening, but in most epidemics, routine screening in the entire population may not be cost–effective. The specific threshold at which a country should alter its approach to routine testing, however, is a function of multiple factors and cannot be identified more generally.

References

1.
de Oliveria Andrade LJ , D’OliveiraA, MeloRC, De SouzaEC, Costa SilvaCA, ParanáR. Association between hepatitis C and hepatocellular carcinoma. J Glob Infect Dis. 2009;1(1):33–7. doi: 10.4103/0974-777X.52979. [PMID: Accession Number]; PubMed Central. [PMC free article: PMC2840947] [PubMed: 20300384] [CrossRef]
2.
Cooke GS , LemoineM, ThurszM, GoreC, SwanT, KamarulzamanAet al. Viral hepatitis and the Global Burden of Disease: a need to regroup. J Viral Hepat. 2013;20(9):600–1. doi: 10.1111/jvh.12123. [PMID: Accession Number]; PubMed Central. [PubMed: 23910643] [CrossRef]
3.
Hanafiah KM , GroegerJ, FlaxmanAD, WiersmaST. Global epidemiology of hepatitis C virus infection: new estimates of age-specific antibody to HCV seroprevalence. Hepatology. 2013;57(4):1333–42. doi: 10.1002/hep.26141. [PMID: Accession Number]; PubMed Central. [PubMed: 23172780] [CrossRef]
4.
Younossi Z , HenryL. Systematic review: patient-reported outcomes in chronic hepatitis C – the impact of liver disease and new treatment regimens. Aliment Pharmacol Ther. 2015;41(6):497–520. Epub 2015/01/24. doi: 10.1111/apt.13090. [PMID: Accession Number]; PubMed Central. [PubMed: 25616122] [CrossRef]
5.
Johnston L , SaumtallyA, CorcealS, MahadooI, OodallyF. High HIV and hepatitis C prevalence amongst injecting drug users in Mauritius: findings from a population size estimation and respondent driven sampling survey. Int J Drug Policy. 2011;22(4):252–8. doi: 10.1016/j.drugpo.2011.05.007. [PMID: Accession Number]; PubMed Central. [PubMed: 21700442] [CrossRef]
6.
Nelson PK , MathersBM, CowieB, HaganH, Des JarlaisD, HoryniakDet al. Global epidemiology of hepatitis B and hepatitis C in people who inject drugs: results of systematic reviews. Lancet. 2011;378(9791):571–83. doi: 10.1016/S0140-6736(11)61097-0. [PMID: Accession Number]; PubMed Central PMC3285467: PMC3285467. [PMC free article: PMC3285467] [PubMed: 21802134] [CrossRef]
7.
Alonso M , GutzmanA, MazinR, PinzonCE, ReveizL, GhidinelliM. Hepatitis C in key populations in Latin America and the Caribbean: systematic review and meta-analysis. Int J Public Health. 2015;60(7):789–98. doi: 10.1007/s00038-015-0708-5. [PMID: Accession Number]; PubMed Central. [PMC free article: PMC4636523] [PubMed: 26298439] [CrossRef]
8.
Chen Y , ShenZ, MoranoJP, KhoshnoodK, WuZ, LanGet al. Bridging the epidemic: a comprehensive analysis of prevalence and correlates of HIV, hepatitis C, and syphilis, and infection among female sex workers in Guangxi Province, China. PloS One. 2015;10(2):e0115311. doi: 10.1371/journal.pone.0115311. [PMID: Accession Number]; PubMed Central PMC4344209: PMC4344209. [PMC free article: PMC4344209] [PubMed: 25723548] [CrossRef]
9.
Hagan H , JordanAE, NeurerJ, ClelandCM. Incidence of sexually transmitted hepatitis C virus infection in HIV-positive MSM: a systematic review and meta-analysis. AIDS. 2015;29(17):2335–45. doi: 10.1097/QAD.0000000000000834. [PMID: Accession Number]; PubMed Central. [PMC free article: PMC4640945] [PubMed: 26258525] [CrossRef]
10.
Rein DB , SmithBD, WittenbornJS, LesesneSB, WagnerLD, RoblinDWet al. The cost-effectiveness of birth-cohort screening for hepatitis C antibody in US primary care settings. Ann Intern Med. 2012;156(4):263–70. doi: 10.7326/0003-4819-156-4-201202210-00378. [PMID: Accession Number]; PubMed Central. [PMC free article: PMC5484577] [PubMed: 22056542] [CrossRef]
11.
Mohd Hanafiah K , GroegerJ, FlaxmanAD, WiersmaST. Global epidemiology of hepatitis C virus infection: new estimates of age-specific antibody to HCV seroprevalence. Hepatology. 2013;57(4):1333–42. doi: 10.1002/hep.26141. [PMID: Accession Number]; PubMed Central. [PubMed: 23172780] [CrossRef]
12.
Schackman BR , LeffJA, BarterDM, DiLorenzoMA, FeasterDJ, MetschLRet al. Cost-effectiveness of rapid hepatitis C virus (HCV) testing and simultaneous rapid HCV and HIV testing in substance abuse treatment programs. Addiction. 2015;110(1):129–43. doi: 10.1111/add.12754. [PMID: Accession Number]; PubMed Central 4270906: 4270906. [PMC free article: PMC4270906] [PubMed: 25291977] [CrossRef]
13.
Castelnuovo E , Thompson-CoonJ, PittM, CrampM, SiebertU, PriceAet al. The cost-effectiveness of testing for hepatitis C in former injecting drug users. Health Technol Assess. 2006;10(32):iii–iv, ix-xii, 1–93. [PMID: Accession Number]; PubMed Central. [PubMed: 16948891]
14.
Grebely J , MatthewsGV, LloydAR, DoreGJ. Elimination of hepatitis C virus infection among people who inject drugs through treatment as prevention: feasibility and future requirements. Clin Infect Dis. 2013;57(7):1014–20. doi: 10.1093/cid/cit377. [PMID: Accession Number]; PubMed Central. [PubMed: 23728143] [CrossRef]
15.
Martin NK , VickermanP, GrebelyJ, HellardM, HutchinsonSJ, LimaVDet al. Hepatitis C virus treatment for prevention among people who inject drugs: modeling treatment scale-up in the age of direct-acting antivirals. Hepatology. 2013;58(5):1598–609. Epub 2013/04/05. doi: 10.1002/hep.26431. [PMID: Accession Number]; PubMed Central 3933734: 3933734. [PMC free article: PMC3933734] [PubMed: 23553643] [CrossRef]
16.
Linas BP , BarterDM, LeffJA, AssoumouSA, SalomonJA, WeinsteinMCet al. The hepatitis C cascade of care: identifying priorities to improve clinical outcomes. PloS One. 2014;9(5):e97317. doi: 10.1371/journal.pone.0097317. [PMID: Accession Number]; PubMed Central 4026319: 4026319. [PMC free article: PMC4026319] [PubMed: 24842841] [CrossRef]
17.
Yaphe S , BozinoffN, KyleR, ShivkumarS, PaiNP, KleinM. Incidence of acute hepatitis C virus infection among men who have sex with men with and without HIV infection: a systematic review. Sex Transm Infect. 2012;88(7):558–64. doi: 10.1136/sextrans-2012-050566. [PMID: Accession Number]; PubMed Central. [PubMed: 22859499] [CrossRef]
18.
van de Laar T , PybusO, BruistenS, BrownD, NelsonM, BhaganiSet al. Evidence of a large, international network of international hepatitis C virus transmission in HIV-positive men who have sex with men. Gastroenterology. 2009;136(5):1609–17. [PMID: Accession Number]; PubMed Central. [PMC free article: PMC4260925] [PubMed: 19422083]
19.
Linas BP , WongAY, SchackmanBR, KimAY, FreedbergKA. Cost-effective screening for acute hepatitis C virus infection in HIV-infected men who have sex with men. Clin Infect Dis. 2012;55(2):279–90. doi: 10.1093/cid/cis382. [PMID: Accession Number]; PubMed Central PMC3403839: PMC3403839. [PMC free article: PMC3403839] [PubMed: 22491339] [CrossRef]
20.
Cresswell FV , FisherM, HughesDJ, ShawSG, HomerG, Hassan-IbrahimMO. Hepatitis C core antigen testing: a reliable, quick and potentially cost-effective alternative to hepatitis C polymerase chain reaction in diagnosing acute hepatitis C virus infection. Clin Infect Dis. 2015;60(2):263–6. doi: 10.1093/cid/ciu782. [PMID: Accession Number]; PubMed Central. [PubMed: 25301216] [CrossRef]
21.
Martin NK , HickmanM, MinersA, HutchinsonSJ, TaylorA, VickermanP. Cost-effectiveness of HCV case-finding for people who inject drugs via dried blood spot testing in specialist addiction services and prisons. BMJ Open. 2013;3(8). doi: 10.1136/bmjopen-2013-003153. [PMID: Accession Number]; PubMed Central PMC3752052: PMC3752052. [PMC free article: PMC3752052] [PubMed: 23943776] [CrossRef]
22.
Sutton AJ , EdmundsWJ, GillON. Estimating the cost-effectiveness of detecting cases of chronic hepatitis C infection on reception into prison. BMC Public Health. 2006;6:170. doi: 10.1186/1471-2458-6-170. [PMID: Accession Number]; PubMed Central PMC1543636: PMC1543636. [PMC free article: PMC1543636] [PubMed: 16803622] [CrossRef]
23.
Sutton AJ , EdmundsWJ, SweetingMJ, GillON. The cost-effectiveness of screening and treatment for hepatitis C in prisons in England and Wales: a cost-utility analysis. J Viral Hepat. 2008;15(11):797–808. doi: 10.1111/j.1365-2893.2008.01008.x. [PMID: Accession Number]; PubMed Central. [PubMed: 18637074] [CrossRef]
24.
McGarry LJ , PawarVS, PanchmatiaHR, RubinJL, DavisGL, YounossiZMet al. Economic model of a birth cohort screening program for hepatitis C virus. Hepatology. 2012;55(5):1344–55. doi: 10.1002/hep.25510. [PMID: Accession Number]; PubMed Central. [PubMed: 22135116] [CrossRef]
25.
Liu S , CiprianoLE, HolodniyM, Goldhaber-FiebertJD. Cost-effectiveness analysis of risk-factor guided and birth-cohort screening for chronic hepatitis C infection in the United States. PloS One. 2013;8(3):e58975. doi: 10.1371/journal.pone.0058975. [PMID: Accession Number]; PubMed Central PMC3606430: PMC3606430. [PMC free article: PMC3606430] [PubMed: 23533595] [CrossRef]
26.
Brogueira P , CostaA, MirandaA, PeresS, BaptistaT, AldirIet al. Improve screening of HCV infection by targeting high prevalence aged groups: analysis of a cohort of HCV and HIV co-infected patients. J Int AIDS Soc. 2014;17(4Suppl 3):19601. doi: 10.7448/IAS.17.4.19601. [PMID: Accession Number]; PubMed Central PMC4224779: PMC4224779. [PMC free article: PMC4224779] [PubMed: 25394105] [CrossRef]
27.
Coffin PO , ScottJD, GoldenMR, SullivanSD. Cost-effectiveness and population outcomes of general population screening for hepatitis C. Clin Infect Dis. 2012;54(9):1259–71. doi: 10.1093/cid/cis011. [PMID: Accession Number]; PubMed Central PMC3404694: PMC3404694. [PMC free article: PMC3404694] [PubMed: 22412061] [CrossRef]
28.
Singer ME , YounossiZM. Cost effectiveness of screening for hepatitis C virus in asymptomatic, average-risk adults. Am J Med. 2001;111(8):614–21. doi: 10.1016/S0002-9343(01)00951-2. [PMID: Accession Number]; PubMed Central. [PubMed: 11755504] [CrossRef]
29.
Josset V , TorreJP, TavolacciMP, Van Rossem-MagnaniV, AnselmeK, MerleVet al. Efficiency of hepatitis C virus screening strategies in general practice. Gastroenterol Clin Biol. 2004;28(4):351–7. [PMID: Accession Number]; PubMed Central. [PubMed: 15146150]
30.
Nakamura J , TerajimaK, AoyagiY, AkazawaK. Cost-effectiveness of the national screening program for hepatitis C virus in the general population and the high-risk groups. Tohoku J Exp Med. 2008;215(1):33–42. doi: 10.1620/tjem.215.33. [PMID: Accession Number]; PubMed Central. [PubMed: 18509233] [CrossRef]
31.
Tramarin A , GennaroN, CompostellaFA, GalloC, WendelaarBonga LJ, PostmaMJ. HCV screening to enable early treatment of hepatitis C: a mathematical model to analyse costs and outcomes in two populations. Curr Pharm Des. 2008;14(17):1655–60. [PMID: Accession Number]; PubMed Central. [PubMed: 18673188]
32.
Wong WW , TuHA, FeldJJ, WongT, KrahnM. Cost-effectiveness of screening for hepatitis C in Canada. CMAJ. 2015;187(3):E110–E121. doi: 10.1503/cmaj.140711. [PMID: Accession Number]; PubMed Central PMC4330166: PMC4330166. [PMC free article: PMC4330166] [PubMed: 25583667] [CrossRef]
33.
Selvapatt N , WardT, BaileyH, BennettH, ThorneC, SeeL-Met al. Is antenatal screening for hepatitis C virus cost-effective? A decade’s experience at a London centre. J Hepatol. 2015;63(4):797–804. doi: 10.1016/j.jhep.2015.05.015. [PMID: Accession Number]; PubMed Central. [PubMed: 26024832] [CrossRef]
34.
Plunkett BA , GrobmanWA. Routine hepatitis C virus screening in pregnancy: a cost-effectiveness analysis. Am J Obstet Gynecol. 2005;192(4):1153–61. doi: 10.1016/j.ajog.2004.10.600. [PMID: Accession Number]; PubMed Central. [PubMed: 15846195] [CrossRef]
35.
Urbanus AT , van KeepM, MatserAA, RozenbaumMH, WeeginkCJ, van den HoekAet al. Is adding HCV screening to the antenatal national screening program in Amsterdam, the Netherlands, cost-effective?PloS One. 2013;8(8):e70319. doi: 10.1371/journal.pone.0070319. [PMID: Accession Number]; PubMed Central PMC3741285: PMC3741285. [PMC free article: PMC3741285] [PubMed: 23950920] [CrossRef]
36.
Kim DD , HuttonDW, RaoufAA, SalamaM, HablasA, SeifeldinIAet al. Cost-effectiveness model for hepatitis C screening and treatment: implications for Egypt and other countries with high prevalence. Glob Public Health. 2015;10(3):296–317. doi: 10.1080/17441692.2014.984742. [PMID: Accession Number]; PubMed Central PMC4320005: PMC4320005. [PMC free article: PMC4320005] [PubMed: 25469976] [CrossRef]
37.
Rein DB , SmithBD, WittenbornJS, LesesneSB, WagnerLD, RoblinDWet al. The cost-effectiveness of birth-cohort screening for hepatitis C antibody in US primary care settings. Ann Intern Med. 2012;156(4):263–70. doi: 10.7326/0003-4819-156-4-201202210-00378. [PMID: Accession Number]; PubMed Central. [PMC free article: PMC5484577] [PubMed: 22056542] [CrossRef]

Annex 5.3. PICO 1 - How to test (HBV)
Diagnostic accuracy of tests to detect hepatitis B surface antigen: a meta-analysis and review of the literature

Authors

Team lead: ,* ,* , , , , , , , and .

Affiliations

1 London School of Hygiene and Tropical Medicine team
* Co-leaders of this review

1. Executive summary

Background: Rapid diagnostic tests are potentially useful tools for the diagnosis of hepatitis B surface antigen (HBsAg) globally, particularly in low-resource areas. Expansion for global use depends on their performance characteristics clinically in the field, ultimately with the aim being to reach low-resource settings and offer cost–efficient screening as an alternative to laboratory tests.

Objectives: The purpose of this review was to identify quantitative evidence on the clinical sensitivity1 and specificity of available in vitro diagnostics (hereafter referred to as assays) used to detect hepatitis B antibody, synthesize the evidence, and inform models.

Methods: Two reviewers independently assessed the quality and extracted data for estimating accuracy. Meta-analysis was performed. We further performed stratified estimates based on individual products, HIV status, specimen type, study setting and design.

Results: Thirty-three studies were included using an EIA reference standard. The overall pooled clinical sensitivity and specificity of rapid HBsAg tests were 90.0% (95% CI: 89.1, 90.8) and 99.5% (95% CI: 99.4, 99.5), respectively, compared to laboratory-based immunoassay reference standards. Pooled specificity was comparable and less heterogeneous.

Pooled sensitivity in studies of HIV-positive was lower than in known HIV-negative patients; 72.3% (95% CI: 67.9, 76.4) compared to 92.6% (95% CI: 89.8, 94.8), respectively. Pooled sensitivity and specificity in blood donors were 91.6% (95% CI: 90.1, 92.9) and 99.5% (95% CI: 99.5, 99.9), respectively.

Samples using whole blood specimens (venous or capillary) were 91.7% (95% CI: 89.1, 93.9) and 99.9% (95% CI: 99.8, 99.9) sensitive and specific compared to serum.

Results were comparable for studies performed prior to the past ten years as those performed since 2005. Estimates of assay sensitivity demonstrated significant heterogeneity not entirely corrected by sub-analysis, although studies using whole blood specimens (venous or capillary), and the same reference standard (CMIA) were more robust (tau-squared <1 in all cases).

The overall pooled clinical sensitivity and specificity of laboratory-based HBsAg tests were comparable, with 88.9% (95% CI: 87.0, 90.6) and 98.4% (95% CI: 97.8, 98.8) sensitivity and specificity, respectively, compared to immunoassay state-of-the-art chemiluminescent microparticle enzyme immunoassays.

Conclusions: Assays for HBsAg detection such as rapid diagnostic tests (RDTs), including those performed on serum/plasma and capillary whole blood specimens, have good sensitivity and excellent specificity compared to a reference standard comprising laboratory-based methods of HBsAg detection. Improvement in sensitivity, or development of innovative testing strategies could potentially enhance their use as first-line screening globally. Caution in HIV-positive individuals is important, while the reassuring accuracy of capillary whole blood specimens compared to plasma/serum further facilitates use in settings where phlebotomy is not available.

2. Background

An estimated 240 million individuals worldwide1 are chronically infected with hepatitis B virus (HBV) and there are an estimated four million acute HBV infections each year. Twenty per cent to 30% of those with chronic hepatitis B infection will develop cirrhosis2 or hepatocellular carcinoma,3 leading to approximately 650 000 deaths each year.4 However, most individuals with chronic HBV infection are not aware of their serostatus, contributing to delayed diagnosis and complications from advanced disease.5 HBV testing is critically important in order to refer infected individuals to HBV treatment and care, to refer uninfected individuals for vaccination, and to mobilize prevention and control efforts.

In March 2015, the World Health Organization (WHO) published the first guidelines for the prevention, care, and treatment of individuals with chronic HBV infection.5 These guidelines focused on assessment for treatment eligibility, initiation of first-line therapies, switching and monitoring. These initial guidelines did not include testing recommendations, and in particular which tests to use. Given the large burden of HBV in low- and middle-income settings where there are limited or no existing HBV testing guidelines, there is a substantial need for HBV testing guidelines.

Chronic HBV infection is defined as persistence of hepatitis B surface antigen (HBSAg) for at least six months. However, interpretation of HBV serologies is complex. The serologies most frequently used for HBV testing include HBsAg, total anti-HBc, and anti-HBs. HBV screening includes both the one-test (e.g. HBsAg) and two-test strategies (e.g. HBsAg followed by hepatitia B core antibody [HBcAb] or nucleic acid testing [NAT]).

Detection of HBsAg can include rapid diagnostic tests (RDTs) or immunoassays. Rapid tests developed for screening include solid-phase assays, flow-through, agglutination and lateral-flow. The majority, however, are immunochromatographic assays. Immunoassays use different methods for detection of HBsAg using polyclonal or monoclonal anti-HBs antibodies. Labelling to measure antigen–antibody complexes can include radioactive compounds, enzymes with a change in colour in solution, or substances emitting light.

Advances in HBV detection technology create new opportunities for enhancing screening, referral, and treatment. Previous systematic reviews on hepatitis B infection have focused on immunological responses,6 surveillance of cirrhosis,7 and treatment.8 Existing systematic reviews911 on hepatitis B testing focused on point-of-care (POC) tests and included tests with unclear reference standards or those not appropriate for assessing operational diagnostic accuracy in the field.

3. Objectives

The purpose of this review was to identify quantitative evidence on the sensitivity and specificity of assays used to detect hepatitis B antibody, synthesize the evidence and inform models.

To our knowledge, this is the first study exclusively comparing the clinical performance of both RDTs and laboratory-based immunoassays, in addition to addressing the question of accuracy in the context of HIV specifically.

PICO 1 Among persons identified for hepatitis B testing, what is the diagnostic accuracy of available assays for detecting HBsAg?
PPersons identified for HBV testing
IRapid diagnostic tests or immunoassays for HBsAg detection
CReference standard comprising a laboratory-based enzyme immunoassay (EIA)2 (one or more HBsAg enzyme immunoassays, with or without neutralization to confirm)
ODiagnostic accuracy (sensitivity, specificity, TN, TP, FN, and FP; positive predictive value, negative predictive value)

As a subanalysis, we also analysed data for studies comparing the accuracy of HBsAg assays against a nucleic-acid amplification test (NAT) reference standard. This is important given the importance of reducing transmission during the seroconversion period and in the diagnosis of occult hepatitis B, where HBsAg may not be detectable and which is more common in HIV coinfection. [Results in Annex 9.2]

4. Methods

Search strategy and identification of studies

Literature search strategies were developed by a medical librarian with expertise in systematic review searching. Our search algorithm consisted of the following components: hepatitis B, diagnostic tests and diagnostic accuracy (see Annex 1). We searched MEDLINE (OVID interface, 1946 onwards), EMBASE (OVID interface, 1947 onwards), the Cochrane Central Register of Controlled Trials (Wiley interface, current issue), Science Citation Index Expanded (Web of Science interface, 1970 onwards), Conference Proceedings Citation Index-Science (Web of Science interface, 1990 onwards), SCOPUS (1960 onwards), Literatura Latino-Americana e do Caribe em Ciências da Saúde (LILACS) (BIREME interface) and WHO Global Index Medicus. The search was supplemented by searching for ongoing studies in WHO’s International Clinical Trials Registry.

In addition to searching databases, we contacted individual researchers, experts working in the field and authors of major trials to address whether any relevant manuscripts are in preparation or in press. The references of published articles found in the above databases were searched for additional pertinent articles. The review was registered in PROSPERO and reported in accordance with PRISMA guidelines.

Study selection proceeded in three stages. First, titles/abstracts were screened by a single reviewer (AA/HK) according to standard inclusion and exclusion criteria. Second, all articles identified for full manuscript review were obtained and assessed independently by the two reviewers (AA and HK) against inclusion criteria. Papers were accepted or rejected and reasons for rejection were specified. Third, discrepancies were resolved by discussion between review authors, with several studies resolved by a third independent reviewer (RP).

Selection criteria

Types of studies

We included case–control, cross-sectional, cohort studies and randomized trials with a primary purpose of evaluating HBsAg tests published until May 2015. We excluded: conference abstracts, comments or review papers; studies with primary aims other than evaluation of both sensitivity and specificity of HBsAg detection; studies related to disease prevalence, drug resistance, genotyping, sequencing, or non-diagnostic purposes; studies that focus on detection of anti-HBsAg (antibody to hepatitis B antigen); articles in languages other than English.

Participants

We included studies using original data from patient specimens in defined populations. We included all age groups, settings, countries and specimen types, notably whole blood (venous and capillary), plasma or serum. Saliva specimens were considered, but no suitable studies were identified. We excluded studies using commercial reference panels or clinical panels not sourced by authors given applicability and bias concerns from unknown sampling in unclear populations.

Index tests

Studies utilizing commercially available HBsAg tests were eligible for inclusion. We excluded: in-house developed tests; laboratory-based immunoassays which are no longer commercially available. We did not, however, exclude rapid tests based on current commercial availability, in keeping with the methodology in recent systematic reviews. We did however sub-categorize more recent studies between 2005 and 2015.

Reference standard

The reference standard for definite diagnosis of hepatitis B is complicated, given the different viral kinetics of HBsAg and HBV DNA. We included studies using an established commercially available immunoassay as a reference standard for HBsAg detection. Studies using a NAT reference standard were included as a supplementary secondary analysis. For studies comparing immunoassays, we only included studies using chemiluminescent microparticle immunoassays (CMIAs) as the reference standard, given the generally accepted higher analytical sensitivity of these assays. For studies of rapid tests, in keeping with previous systematic reviews, we did not limit based on type of immunoassays.

Data extraction

Information on the following variables were independently extracted by the two review authors (AA, KH): first author, total sample size, country (and city) of sampling, specimen type (oral fluid, capillary [finger-prick] whole blood, venous whole blood, etc.), eligibility criteria, reference standard, manufacturer, raw cell numbers (true positives, false negatives, false positives, true negatives), HIV coinfection, sources of funding, reported conflicts of interest.

Assessment of methodological quality

Study quality was evaluated using the QUADAS-2 tool12 and the STARD checklist.13 QUADAS includes domains to evaluate bias in the following categories: risk of bias (patient selection, index test, reference standard, flow and timing); applicability concerns (patient selection, index test, reference standard).

GRADE summary of finding tables

The GRADE system was used to rate the strength of evidence of each body evidence as high, moderate, low, or very low on the basis of aggregate quality, consistency, precision, directness, and reporting bias. We did not downgrade directness because the outcome evaluated was diagnostic accuracy (an intermediate outcome), as the PICO focuses on diagnostic accuracy. Summary of finding tables were prepared. We did not perform a formal assessment of publication bias.

Data analysis and synthesis

Standard methods for meta-analysis of diagnostic accuracy were used. For each study we calculated sensitivity, specificity, positive likelihood ratio (PLR), negative likelihood ratio (NLR) and 95% confidence intervals (CI). Likelihood ratios are metrics and are calculated using a combination of sensitivity and specificity. Positive likelihood ratio (PLR) is the ratio of sensitivity (1−specificity), whereas the negative likelihood ratio (NLR) is the ratio of specificity (1−sensitivity). When a diagnostic test has no discriminating capability, both likelihood ratios equal 1.

We conducted meta-analysis pooling data using the DerSimonian–Laird bivariate random effect model (REM) to calculate pooled sensitivity, specificity and other related indices. The REM was more suitable than the fixed-effects model (FEM) given significant heterogeneity in studies found, as it takes into account variability both within studies (random error) and between studies (heterogeneity). Statistical heterogeneity was measured using the random-effect variance (tau-squared).

Meta-regression was performed to investigate the source of heterogeneity within included studies (inverse variance weighted). We analysed sub-groups according to the following characteristics: study year (2005–2015); geographical area; individual tests; sample type; patient type (blood donors); patient HIV status. We did not formally test for publication bias. Where meta-regression was not possible for covariates, we performed descriptive statistics.

Meta-analysis of the collected data was conducted using the software: Meta-Disc© version 1.4.7. Statistical analysis was performed using Meta-Disc 1.4 for Windows (XI Cochrane Colloquium, Barcelona, Spain). QUADAS-2 analysis was performed using Microsoft Excel.

5. Results

Study selection

A total of 11 589 citations were identified and 6575 duplicates were removed. Each of the 5014 titles was examined according to pre-specified inclusion and exclusion criteria. A total of 33 research studies were included in the final primary analysis (Fig. 1), with studies comparing both rapid diagnostic tests (RDTs)1442 and enzyme immunoassays4346 against an immunoassay reference standard. Of these, 19 studies1431,47 were also included in a recent systematic review by Khuroo et al.;11 eight papers from that study were excluded as they were conference abstracts or letters to editors,4850 foreign language articles,51,52 or evaluated reference panels.53 Two reports by WHO and the International Consortium for Blood Safety (ICBS) were also excluded as they were not published in peer-reviewed journals and were case–control studies constructed using reference panels from populations of affected individuals. Our search identified 11 additional articles3242 comparing RDTs against the EIA reference standard not found in the previous review. Six articles exclusively assessed accuracy in cohorts of HIV-positive individuals.20,3638,54,55

Studies evaluating laboratory-based immunoassays for HBsAg detection as the index test all used state of the art CMIAs as the reference standard. Seven studies were included in the supplementary analysis assessing diagnostic accuracy of HBsAg assays against a nucleic-acid based reference standard.47,5459

Fig. 1. PRISMA flow diagram outlining study selection examining diagnostic accuracy of HBsAg assays in our systematic review.

Fig. 1PRISMA flow diagram outlining study selection examining diagnostic accuracy of HBsAg assays in our systematic review

Study characteristics

Immunoassay reference standard [Table 1a; 1b]

Overall, the 33 included articles originated in 23 countries: Australia,35 Western Europe16,18, Western Africa;15,25,28,34,36,3840 Eastern Africa;19,20,26,30,41 South Africa;38 South-eastern Asia;24,32 Eastern Asia;25,27,31,43 Southern Asia14,17,21,22,29,42 and the United States.23 Thirty-three RDTs were evaluated using serum (fresh or frozen), plasma, venous and capillary whole blood. Sample sizes varied from 25 to 3928 individuals (mean, 631). Sixty-three data points were generated from the articles. All had bivariate data for analysis; 38% of data points were generated from case–control studies, while the remainder were from cross-sectional cohort studies. Prevalence of hepatitis B in populations tested ranged from 1.9% to 84%.

Populations studied included: general screening of healthy volunteers and blood donors; screening of at-risk populations such as pregnant women, incarcerated adults; and patients from hepatitis cohorts, including confirmed hepatitis B.

The majority of studies were performed in laboratory settings, with some studies performed in the field. A mixture of serum, plasma, capillary and whole blood was used for RDTs, with serum or plasma used for EIAs. Seven studies assessed performance using capillary or venous whole blood specifically.15,16,20,24,28,37,40

In terms of tests used, only the Determine HBsAg and BinaxNOW had more than 3 data points.

NAT reference standard [Table 8; Annex 9.2]

Overall, the 7 articles originating in 4 countries (Iran, Nigeria, Uganda, South Africa), contributed 18 data points and included serum or plasma samples from 3304 individuals, with sample size ranging from 74 to 950. All studies were either cross-sectional, cohort or case– control studies. All had data for bivariate analysis.

Table 1aStudy characteristics – EIA vs EIA

Study
[Author, Year]
Location
[Country, City]
Sample sizeStudy designSettingSampleAssay under evaluation
[Type, Brand]3
Reference standard
[Type, Brand]3
Liu, 2014China250CCHospital patients; outpatients (preselected based on CMIA quantitative results)SerumECLIA, Cobas
ELISA, Wantai
CMIA, Architect HBsAg
Peng, 2011China498CCHospital patients (preselected based on S/CO from KHB screen)SerumELISA, KHBCMIA, Architect HBsAg
Geretti, 2010Ghana, Kumasi838CS – CSQHIV clinic (1/3 on lamivudine)SerumCMIA, Architect HBsAg
CMIA, Liaison Ultra
EIA, Murex v3
CMIA, Architect/Liaison
EIA, Murex v3*
Ol, 2009Cambodia120CS – CSQBlood donors (rural community)SerumELISA, MonolisaCMIA, Architect HBsAg
Viet, 2012Vietnam119CS – CSQBlood donors (rural community)SerumEIA, Monolisa UltraCMIA, Architect HBsAg
*

Reactive all three assays OR reactive in one assay with neutralisation

CMIA: chemiluminescent microparticle enzyme immunoassay; ECLIA: electrochemiluminescent immunoassay; EIA: enzyme immunoassay; ELISA: enzyme-linked immunosorbent assay; CC: case–control; CS: cross-sectional; CSQ: consecutive patients

Table 1bStudy characteristics – RDT vs EIA

Study
[Author, Year]
Location
[Country, City]
Sample sizeStudy designSettingSampleRDT under evaluation
[Type, Brand]
Reference test
[Type, Brand]
Mvere, 1996Zimbabwe206CSBlood bankSDipstick (PATH)
SimpliRed
EIA, Auszyme
Sato, 1996Japan462CCHospitalSDainascreen
Serodia
EIA, Auszyme
Abraham, 1998India, Vellore50CC – PanelHospital patients (Multiply transfused; chronic liver disease; preop and antenatal patients)SQuick Chaser
Virucheck
EIA, Auszyme or Hepanostika
400CS – Screen
Oh, 1999Korea250CC – PanelBlood donor panelSGenedia
Serodia
EIA, Cobas Core
Kaur, 2000India2754CS – CSQHospital surgery patients; blood donors; patients ruling out HBVSHepacardEIA, Ortho 3rd generation
Lien, 2000Viet Nam328CCHigh-risk volunteers; pregnant women; patients with other infectious diseases (including 10 with HIV); preselected HBsAg pos (101), HBsAg neg (99)SPDainascreen
Determine
Serodia
EIA, Monolisa
MEIA for discordant
Raj, 2001India, Vellore999CSHospital laboratory samples (emergency preop screening; antenatal women in labour; haemodialysis; urgent donor screening)SHepacardEIA, Auszyme
MEIA, AxSYM v2
Clement, 2002Belgium942CCHospital - patients with biopsy-proven HBV; healthy volunteers from a vaccine evaluation trial; blood donorsWB, SBinaxNOWMEIA, AxSYM v2
Lau, 2003USA1011CS – CSQHepatology clinicsS freshBinax NOWEIA, ETI-MAK2
827CSIncarcerated offendersS frozen
625CS – CSQChinese community health fair (random patients); known HBV-positive patients (liver clinic)WB
Akanmu, 2006Nigeria, Lagos101CS – CSQBlood donors (male)WBBinax NOWELISA, Monolisa
36Chronic liver disease
Nyirendra, 2008Malawi194CS – CSQHospital Hospital patients including 152 HIV+PDetermineEIA, Bioelisa
Neutralisation (positives)
Lin, 2008China671CCBlood donors (500); Clinical specimens HBsAg+ (171)SDetermine
DRW
EIA, Hepanostika Ultra
Guinea579CCBlood donors (491); Stored positives (88)SP
Randrianirina, 2008Madagascar200CCNot specifiedSCypress
Determine
Hexagon
Virucheck
EIA, AxSYM
Ola, 2009Nigeria25CS – CSQMedical clinicWBAMRAD GWHBELISA, Wellcozyme Kit
55Blood donorsSBiotec Latex
Khan, 2010Pakistan57CCNSSAccurate
Onecheck
ELISA, 2nd generation
Davies, 2010Malawi75CS – CSQHIV-positive adults (ART naive)SDetermineEIA, Biokit
Neutralization (positives)
Bjoerkvoll, 2010Cambodia1200CS – CSQGeneral screen – blood donors (rural)SACONEIA, Monolisa Ultra*
Viet Nam1200
Geretti, 2010Ghana, Kumasi838CS – CSQHIV clinic (1/3 on lamivudine)SDetermine
VIKIA
CMIA, Architect/Liason
EIA, Murex v3
Hoffman, 2012South Africa973CS – CSQHIV-positive adults (ART naive) – antenatal or primary careWB (cap)DetermineELISA, AxSYM
Bottero, 2013France, Paris2472CS – CSQGeneral screening (health-care centres) [general population prevention, screening, vaccination]WB (ven)DetermineELISA, Monolisa Ultra Neutralization (positives)
3922QUICK PROFILE
3928VIKIA
Chameera, 2013Sri Lanka50CSHospital (surgical, other)SCortez
Onsite
EIA, SuraseB-96 (TMB)
Franzeck, 2013Tanzania, Ifakara272CS – CSQHIV clinic (ART naive)WB (ven)
P
DetermineElA, Murex v3
Neutralization (positives)
Chevaliez, 2014Unclear558CCChronic hep B (known mutants, blood donors); HBsAg negative (mix, including HIV, 34; HCV, 48)SPDRW v2.0CMI, Architect
408CSAcute hepatitis
802CSPregnant - pregnant women at delivery
Erhabor, 2014Nigeria, Sokoto130CCBlood donorsSPACONELISA, HBsAg Ultra
Gish, 2014Australia, Melbourne297CS – CSQAt risk health fairs, outreach; Vietnamese (72%)SNanosignEIA, Quest Diagnostics
Honge, 2014Bissau438CS – CSQHIV clinic - mixed ART/naiveSVEDA LABCLIA, Architect
Liu, 2014China250CCHospital patients; outpatients (preselected based on CMIA quantitative results)SIntec One StepCMIA, Architect
Mutocheluh, 2014Ghana150CS – CSQBlood donorsPAbon
Acull-Tell
Core TM
Rapid care
Wondfo
ELISA, Human Gesellschaft
Upretti, 2014Nepal347CS – CSQChildren – pre- and post vaccination; mothers (8)SSD BiolineEIA, Surase B-96 (TMB)
Njai, 2015Gambia178CSHepatitis patients CHB carriers (study 3), incl 3 coinfected HIV (treatment naive)SDetermineCMIA (quantitative), Architect
203Espline
773CS – CSQGeneral community screenWBDetermineEIA (DBS), AxSym + Neutralisation
476VIKIA
*

Validated random sample with CMIA, Abbott

CC: case–control study; CS: cross-sectional study; CSQ: consecutive patients; S: serum; P: plasma; WB (cap): capillary whole blood; WB (ven): venous whole blood

Assessment of the quality of the studies

The methodological quality of included studies4 is summarized [Fig. 2, Table 2].

Patient selection

We judged 15 studies to be at “high risk of bias”. Of these, 10 were case–control studies. Others with a high risk of bias included studies in blood donors and highly selected populations, such as patients with known hepatitis B.

Applicability was judged to be “high risk” in 8 studies, notably those published over ten years ago or with tests which are no longer commercially available.

Index test

We judged 7 studies as high risk of bias, and 14 as unclear, with the most common reason being a lack of reported blinding while reading test results.

Reference standard

We judged 5 studies as high risk of bias, with 17 unclear; the most common reason was a lack of reported blinding interpreting reference tests, or utilisation.

Flow and timing

Bias was predominantly due to lack of reported flow and timing. Although the majority of studies did not specificity the exact time differences between performance of the index and reference assays, we can assume they were low risk as they were on the same sample.

Table 2Risk of bias and applicability according to QUADAS-2 domains for individual studies

Risk of biasApplicability
Patient selectionIndex testReference standardFlow and timingPatient selectionIndex testReference standard
Abraham (CC)HighLowLowLowLowHighUnclear
Abraham (CS)LowLowLowLowLowHighUnclear
Akanmu (Blood)LowLowLowLowLowUnclearLow
Akanmu (Liver)LowLowLowLowLowUnclearLow
BjoerkvollLowLowLowLowLowLowLow
BotteroLowHighLowLowLowLowLow
ChameeraLowHighUnclearLowLowLowLow
Chevaliez (CC)HighUnclearUnclearLowLowLowLow
Chevaliez (Hepatitis)HighUnclearUnclearLowLowLowLow
Chevaliez (Pregnant)HighUnclearUnclearLowLowLowLow
ClementHighUnclearHighLowLowUnclearLow
DaviesUnclearLowUnclearHighLowLowLow
ErhaborHighLowUnclearLowLowLowLow
FranzeckLowLowLowLowLowLowLow
GerettiLowUnclearUnclearUnclearLowLowLow
GishLowUnclearUnclearLowLowLowLow
HoffmanLowUnclearLowUnclearLowLowLow
HongeLowLowUnclearLowLowLowLow
KaurLowUnclearUnclearLowLowHighUnclear
KhanHighLowLowLowLowLowLow
Lau (Hepatology clinic)LowLowLowLowLowUnclearLow
Lau (Prison)LowLowLowLowLowUnclearLow
Lau (Screen + Known)LowHighLowLowLowUnclearLow
LienLowHighLowLowLowLowLow
LinHighUnclearUnclearLowLowLowLow
LiuHighUnclearLowHighLowLowLow
MutocheluhHighLowLowLowLowLowLow
MvereLowLowLowLowLowHighUnclear
Njai (1)LowLowLowUnclearLowLowLow
Njai (2)LowLowLowUnclearLowLowLow
Njai (3)HighLowLowLowLowLowLow
NyirendraLowLowUnclearHighLowLowLow
OhHighHighHighLowHighHighUnclear
OlLowUnclearUnclearHighLowLowLow
Ola BDLowHighUnclearLowLowHighLow
Ola ClinicLowLowUnclearLowLowLowLow
PengHighLowUnclearHighLowLowLow
RajUnclearUnclearHighHighLowHighLow
RandrianirinaHighUnclearHighLowLowLowLow
SatoUnclearHighLowLowUnclearHighUnclear
UprettiHighLowHighHighHighLowLow
VietLowUnclearUnclearHighLowLowLow
Fig. 2. Risk of bias and applicability summary according to QUADAS-2 domains presented as percentages across included studies.

Fig. 2Risk of bias and applicability summary according to QUADAS-2 domains presented as percentages across included studies

Diagnostic accuracy

Overall clinical performance of assays against an immunoassay reference
Pooled test accuracy for RDTs compared to EIAs

A total of 21 studies1436,3843 contributing 63 data points evaluated 25 brands of RDTs using 15 EIA reference assays, with 36 919 total samples, including serum, plasma, venous and capillary whole blood. Sample sizes ranged from 25 to 3983 (mean 586). Sensitivities ranged from 50% to 100% with overall pooled sensitivity of 90.0% (95% CI: 89.1, 90.8). Specificities ranged from 69% to 100%, with overall pooled specificity of 99.5% (95% CI: 99.4, 99.5). Pooled PLR and NLR were 117.5 (95% CI: 67.7, 204.1) and 0.095 (95% CI 0.067, 0.136), respectively, with tau-square 3.89, 1.72, respectively, suggestive of significant heterogeneity between studies [Fig. 3, Table 3].

Pooled test accuracy for EIAs compared to other immunoassays

Five studies36,4346 contributed 8 data points evaluating 8 EIAs with reference to state-of-theart immunoassays alone, using a total 3751 serum samples, with sample sizes ranging from 119 to 838 (mean, 469). Studies were performed in China, Ghana, Cambodia and Viet Nam. Sensitivities ranged from 73% to 100%% with overall pooled sensitivity of 88.9% (95% CI: 87.0, 90.6). Specificities ranged from 88% to 100%, with overall pooled specificity of 98.4% (95% CI: 97.8, 98.8). Pooled PLR and NLR were 46.76 (95% CI: 12.86, 170.03) and 0.041 (95% CI: 0.013, 0.134), respectively, with tau-square 2.95, 2.46, respectively, suggestive of significant heterogeneity between studies [Fig. 4, Table 3].

Overall clinical performance of assays against a NAT reference
Pooled test accuracy for RDTs compared to NAT

Three articles47,57,59 contributed 9 data points evaluating 7 RDTs with a NAT reference, using a total 1710 serum or plasma samples, with sample sizes ranging from 74 to 950 (mean 190). Of note, 1440 were from the same 240 patients in one case–control study evaluating 6 tests. Only one study (Nna)57 used plasma. Sensitivities ranged from 38% to 99% with overall pooled sensitivity of 93.3% (95% CI: 91.3, 94.9). Specificities ranged from 94% to 99%, with overall pooled specificity of 98.1% (95% CI: 97.0, 98.9). Pooled PLR and NLR were 39.42 (95% CI: 22.148, 70.185) and 0.051 (95% CI: 0.009, 0.275), respectively, with tau-square 0.2163, 6.264, respectively. [Fig. 5, Table 9; Fig. 8 are in the Annex]

Pooled test accuracy for EIAs compared to NAT

Five articles5456,58,59 contributed 9 data points evaluating EIAs with a NAT reference, using a total 1594 samples, with sample sizes ranging from 74 to 240 (mean, 177). Sensitivities ranged from 38% to 98%% with overall pooled sensitivity of 75.7% (95% CI: 72.1, 79.1). Specificities ranged from 70% to 98%, with overall pooled specificity of 86.1% (95% CI: 83.8, 88.2). Pooled PLR and NLR were 7.234 (95% CI: 4.441, 11.758) and 0.296 (95%CI: 0.192, 0.458), respectively, with tau-square 0.3748, 0.3299, respectively suggesting acceptable interstudy heterogeneity. [Fig. 6, Table 9; and Fig. 9 are in the Annex]

Clinical performance of assays in HIV-positive and negative individuals
Pooled test accuracy for RDTs in HIV-positive individuals

Five articles19,20,3638 contributed 6 data points evaluating 3 RDTs with an EIA reference, using a total 3434 samples from 2566 patients, with sample sizes ranging from 75 to 838. Sensitivities ranged from 62% to 100% with overall pooled sensitivity of 72.3% (95% CI: 67.9, 76.4). Specificities ranged from 99% to 100%, with overall pooled specificity of 99.8% (95% CI: 99.5, 99.9). Pooled PLR and NLR were 192.63 (95% CI: 77.4, 479.17) and 0.288 (95%CI: 0.217, 0.381), respectively, with tau-square 0.3838, 0.0585, respectively [Table 4 and 5; Fig. 11, Annex 9.3].

Pooled test accuracy for RDTs in HIV-negative individuals

One article40 contributed 4 data points evaluating 3 RDTs with an EIA reference, using a total 1624 samples from 997 patients, with sample sizes ranging from 175 to 773. Sensitivities ranged from 88% to 95% with overall pooled sensitivity of 92.6% (95% CI: 89.8, 94.8). Specificities ranged from 93% to 100%, with overall pooled specificity of 99.6% (95% CI: 99.0, 99.9). Pooled PLR and NLR were 79.449 (95% CI: 11.575, 545.315) and 0.082 (95%CI: 0.053, 0.125), respectively, with tau-square 2.9668, 0.0803 respectively [Table 4 and 5; Fig. 12, Annex 9.3].

Pooled test accuracy for EIAs in HIV-positive individuals

One article36 contributed 3 data points evaluating 3 EIAs with an EIA reference. 838 samples were tested with each index test. Sensitivities ranged from 97% to 99% with overall pooled sensitivity of 97.9% (95% CI: 96.0, 99.0). Specificities ranged from 99% to 100%, with overall pooled specificity of 99.4% (95% CI: 99.0, 99.7). Pooled PLR and NLR were 167.26 (95% CI: 95.135, 294.07) and 0.022 (95% CI: 0.012, 0.043), respectively, with tau-square <0.005, <0.005, respectively [Table 4; Fig. 14, Annex 9.3.]

Clinical performance of RDTS compared to EIAs in other stratified subgroups
Pooled test accuracy for RDTs using whole blood (capillary or venous)

Seven studies15,16,20,24,28,37,40 contributed 11 data points evaluating 5 RDTs with an EIA reference, using a total 13731 samples, with sample sizes ranging from 25 to 3928 (mean 722). Sensitivities ranged from 75% to 100% with overall pooled sensitivity of 91.7% (95% CI: 89.1, 93.9). Specificities ranged from 99% to 100%, with overall pooled specificity of 99.9% (95% CI: 99.8, 99.9). Pooled PLR and NLR were 346.64 (95% CI: 157.598, 762.42) and 0.089 (95%CI: 0.058, 0.136), respectively, with tau-square 0.8124, 0.2367, respectively [Table 5; Fig. 18, Annex 9.3.2].

Pooled test accuracy for RDTs in studies using a case-control design

Ten articles14,18,22,24,25,27,30,31,33,34 contributed 21 data points evaluating 13 RDTs with an EIA reference, using a total 7258 samples, with sample sizes ranging from 50 to 698 (mean 345). Sensitivities ranged from 50% to 100% with overall pooled sensitivity of 96.7% (95% CI: 96.0, 97.3). Specificities ranged from 91% to 100%, with overall pooled specificity of 99.3% (95% CI: 99.0, 99.5). Pooled PLR and NLR were 105.16 (95% CI: 48.038, 230.212) and 0.028 (95%CI: 0.010, 0.076), respectively, with tau-square 2.2261, 4.8632, respectively. Of note, one study22 had significantly lower sensitivity for both index tests evaluated, with otherwise sensitivities ranging from 90% to 100% in remaining studies [Table 5; Fig. 19, Annex 9.3.3].

Pooled test accuracy for RDTs used in blood donors

Seven articles2528,32,34,39 contributed 19 data points evaluating 15 RDTs with an EIA reference, using a total 6881 samples, with sample sizes ranging from 25 to 1200 (mean, 362). Sensitivities ranged from 50% to 100% with overall pooled sensitivity of 91.6% (95% CI: 90.1, 92.9). Specificities ranged from 86% to 100%, with overall pooled specificity of 99.5% (95% CI: 99.3, 99.). Pooled PLR and NLR were 89.219 (95% CI: 32.782, 242.818) and 0.106 (95%CI: 0.055, 0.204), respectively, with tau-square 3.8171, 1.8505, respectively. [Table 5; Fig. 20, Annex 9.3.4]

Pooled test accuracy for RDTs published before and after 2005

Twenty-one articles1517,19,20,22,25,28,30,3243 contributed 44 data points evaluating 26 RDTs with an EIA reference, using a total 25 261 samples, with sample sizes ranging from 25 to 3928 (mean 574). Sensitivities ranged from 50% to 100 % with overall pooled sensitivity of 86.4% (95% CI: 85.2, 87.5). Specificities ranged from 69% to 100%, with overall pooled specificity of 99.4% (95% CI: 99.2, 99.5). Pooled PLR and NLR were 84.657 (95% CI: 43.553, 164.553) and 0.126 (95%CI: 0.087, 0.183), respectively, with tau-square 4.0986, 1.2712, respectively.

Nine articles published before 200514,18,21,23,24,26,27,29,31 contributed 19 data points evaluating 10 RDTs with an EIA reference, using a total 25 253 samples, with sample sizes ranging from 25 to 3928 (mean 1122). Sensitivities ranged from 77% to 100% with overall pooled sensitivity of 96.9% (95% CI: 96.0, 97.7). Specificities ranged from 97% to 100%, with overall pooled specificity of 99.7% (95% CI: 99.6, 99.8). Pooled PLR and NLR were 265.5 (95% CI: 106.1, 664.5) and 0.056 (95%CI: 0.033, 0.095), respectively, with tau-square 2.72, 0.91, respectively. [Table 5; Figs 21 and 22, Annex 9.3.4]

Pooled test accuracy for RDTs by brand

Stratifying by test brand did not eliminate statistical heterogeneity. Data for all 50 brands used [Table 6] demonstrate heterogeneous results for sensitivity, with more robust specificity as previously noted.

Determine HBsAg was evaluated in the most studies, with only one published before 2008. Ten articles16,19,20,24,25,30,36,37,40,41 contributing 12 data points evaluated against an EIA reference, using a total 7553 samples, with sample sizes ranging from 75 to2472. Sensitivities ranged from 56% to 100% with overall pooled sensitivity of 90.8% (95% CI: 88.9, 92.4). Specificities ranged from 69% to 100%, with overall pooled specificity of 99.1% (95% CI: 98.9, 99.4). Excluding one particularly anomalous study,41 the lowest sensitivities and specificities would be 69% and 93%, respectively. Pooled PLR and NLR were 239.24 (95% CI: 17.139, 33339.4) and 0.077 (95%CI: 0.035, 0.168), respectively, with tau-square 20.17, 1.556, respectively. [Table 5, 6]

BinaxNOW HBsAg was evaluated in three articles, (15, 18, 23) all published before 2007, contributing 6 data points evaluating against an EIA reference, using a total 3550 samples, with sample sizes ranging from 36 to 1011. Sensitivities ranged from 94% to 100% with overall pooled sensitivity of 97.6% (95% CI: 96.2, 98.6). Specificity was 100% in all studies, with overall pooled specificity of 100% (95% CI: 99.7, 100). Pooled PLR and NLR were 221.21 (95% CI: 36.160, 1354.1) and 0.045 (95%CI: 0.016, 0.128), respectively, with tau-square 3.53, 1.20, respectively. [Tables 5, 6]

VIKIA HBsAg was also evaluated in three articles,16,36,40 all published after 2010, contributing 3 data points evaluating against an EIA reference, using a total 5242 samples, with sample sizes ranging from 476 to 3928. Sensitivities ranged from 71% to 97% with overall pooled sensitivity of 82.5% (95% CI: 77.5, 86.7). Specificities ranged from 99.8% to 100%, with overall pooled specificity of 99.9% (95% CI: 99.8, 100). Pooled PLR and NLR were 1072.3 (95% CI: 376.082, 3057.2) and 0.108 (95%CI: 0.026, 0.458), respectively, with tau-square <0.005, 1.472, respectively. [Tables 5, 6]

Serodia HBsAg was also evaluated in three articles24,27,31 all published before 2000, contributing 3 data points evaluating against an EIA reference, using a total 1040 samples. Sensitivities ranged from 71% to 97% with overall pooled sensitivity of 82.5% (95% CI: 77.5, 86.7). Specificities ranged from 99.8% to 100%, with overall pooled specificity of 99.9% (95% CI: 99.8, 100). Pooled PLR and NLR were 284.91 (95% CI: 71.42, 1136.6) and 0.045 (95%CI: 0.029, 0.069), respectively, with tau-square <0.005, <0.005, respectively. [Tables 5, 6]

Pooled accuracy of RDTs evaluated against CMIA reference

Five articles33,36,38,40,43 contributed 9 data points evaluating 6 RDTs against specifically a CMIA reference, using a total 4513 samples, with sample sizes ranging from 178 to 838 (mean 501). Sensitivities ranged from 62% to 100% with overall pooled sensitivity of 80.4% (95% CI: 77.9, 82.6). Specificities ranged from 93% to 100%, with overall pooled specificity of 99.0% (95% CI: 98.6, 99.3). Pooled PLR and NLR were 58.5 (95% CI: 31.3, 109.3) and 0.141 (95%CI: 0.074, 0.268), respectively, with tau-square 0.4375, 0.7337, respectively. [Table 5]

Fig. 3. Forest plots, RDT vs EIA, ordered by [Test, Author]*.

Fig. 3Forest plots, RDT vs EIA, ordered by [Test, Author]*

Key brands of RDT and reference standards used in studies

StudyTest brand (manufacturer)Reference test type, brand (manufacturer)
Mvere, 1996Dipstick (PATH)
SimpliRed
EIA, Auszyme
Sato, 1996Dainascreen HBsAG
Serodia HBsAg
EIA, Auszyme
Abraham, 1998QuickChaser
Virucheck
EIA, Auszyme or Hepanostika
Oh, 1999Genedia
Serodia
EIA, Cobas Core
Kaur, 2000HepacardEIA, Ortho 3rd generation
Lien, 2000Dainascreen
Determine HBsAg
Serodia
EIA, Monolisa
MEIA for discordant
Raj, 2001HepacardEIA, Auszyme
MEIA, AxSYM v2
Clement, 2002BinaxNOWMEIA, AxSYM v2
Lau, 2003BinaxNOWEIA, ETI-MAK2
Akanmu, 2006BinaxNOWELISA, Monolisa
Bjoerkvoll, 2010ACONEIA, Monolisa Ultra*
Lin, 2008Determine HBsAg
DRW HBsAg
EIA, Hepanostika Ultra
Nyirendra, 2008Determine HBsAGEIA, Bioelisa
Neutralisation (positives)
Randrianirina, 2008Cypress
Determine HBsAg
Hexagon
Virucheck
EIA, AxSYM
Ola, 2009AMRAD GWHB
Biotec Latex
ELISA, Wellcozyme Kit
Davies, 2010DetermineEIA, Biokit; Neutralisation (for all positives)
Geretti, 2010Determine
VIKIA
CMIA, Architect/Liason
EIA, Murex v3
Khan, 2010Accurate
Onecheck
ELISA, 2nd generation
Hoffman, 2012DetermineELISA, AxSYM
Bottero, 2013Determine
QUICK PROFILE
VIKIA
ELISA, Monolisa Ultra
Neutralisation (for all positive)
Franzeck, 2013Determine HBsAgEIA, Murex v3
Neutralisation (for all positives)
Chameera, 2013Cortez
Onsite
EIA, Surase B-96 (TMB)
Chevaliez, 2014DRW v 2 HBsAgCMIA, Architect
Erhabor, 2014ACONELISA, HBsAg Ultra
Gish, 2014NanosignEIA, Quest Diagnostics
Honge, 2014VEDA LABCLIA, Architect
Liu, 2014Intec One StepCMIA, Architect
Upretti, 2014SD BiolineEIA, Surase B-96 (TMB)
Mutocheluh, 2014Abon
Acull-Tell
Core-TM
Rapid care
Wondfo
ELISA, Human Gesellschaft
Njai, 2015Determine HBsAg
VIKIA
Espline
EIA (DBS), AxSym
Neutralisation
CMIA (quantitative), Architect
Fig. 4. Forest plots, EIA vs EIA, ordered by [Test, Author]**.

Fig. 4Forest plots, EIA vs EIA, ordered by [Test, Author]**

**H+ = HIV positive

Key – Types of EIA and reference standards used in studies

StudyTest type, brand (manufacturer)Reference
Geretti EIA, Murexv.3.0 (Abbott)
CMIA, Architect (Abbott)
CMIA, Liaison Ultra (Diasorin)
CMIA and EIA (agreement) or neutralization
Liu ELISA, Wantai (Beijing Wantai)
ECLIA, Cobas e601 (Roche)
CMIA, Architect (Abbott)
Ol ELISA, Monolisa (bioRad)CMIA, Architect (Abbott)
Viet EIA, Monolisa Ultra (bioRad)CMIA, Architect (Abbott)
Peng ELISA, KHB (Kehua Bio-engineeering Co)CMIA, Architect (Abbott)
Abbreviations used in Forest plots.

Abbreviations used in Forest plots

*Camb: Cambodia; Viet: Viet Nam; BD: blood donor study; CLD: chronic liver disease study; Fresh S: fresh serum; Frozen S: frozen serum; WB: whole blood; H+: HIV positive; CHB: chronic hepatitis B cohort; Screen: general screen cohort; Hep: acute hepatitis cohort; Preg: antenatal cohort; CC: case–control study; CS: cross-sectional study

**H+: HIV positive

Table 3Summary pooled diagnostic accuracy of HBsAg assays using EIA and NAT reference standards

ReferenceIndex testPooled clinical accuracyLikelihood ratios (REM)5Heterogeneity
(Tau-squared)
n Sen
(95% CI)
Spec
(95% CI)
PLR
(95% CI)
NLR
(95% CI)
PLR NLR
EIARDT6390.0
(89.1−90.8)
99.5
(99.4−99.5)
118
(67.7−204)
0.095
(0.067−0.136)
3.891.72
EIA888.9
(87.0−90.6)
98.4
(97.8−98.8)
46.8
(12.9−170)
0.041
(0.013−0.134)
2.952.46
NATRDT993.3
(91.3−94.9)
98.1
(97.0−98.9)
39.4
(22.1−70.2)
0.051
(0.009−0.27)
0.226.26
EIA975.7
(72.1−79.1)
86.1
(83.8−88.2)
7.23
(4.44−11.8)
0.296
(0.192−0.458)
0.370.33

*n = number of data points

Table 4Summary pooled diagnostic accuracy of HBsAg assays in patients with known HIV status

Test typeHIV statusPooled clinical accuracyLikelihood ratios (REM)Heterogeneity (Tau-squared)
n Sen
(95% CI)
Spec
(95% CI)
PLR
(95% CI)
NLR
(95% CI)
PLRNLR
RDTHIV+6672.3
(67.9−76.4)
99.8
(99.5−99.9)
193
(77.4−497)
0.29
(0.22−0.38)
0.3840.0059
HIV392.6
(89.8−94.8)
99.6
(99.0−99.9)
79.5
(11.6−545)
0.08
(0.05−0.13)
2.9670.080
EIAHIV+397.9
(96.0−99.0)
99.4
(99.0−99.7)
167
(95.1−294)
0.02
(0.01−0.04)
<0.005<0.005
HIV

Table 5Summary pooled diagnostic accuracy of rapid HBsAg assays stratified by study, patient, index and reference tests

Sub-analysisPooled clinical accuracyLikelihood ratios (REM)Heterogeneity (Tau-squared)
n Sen
(95% CI)
Spec
(95% CI)
LR+
(95% CI)
LR-
(95% CI)
PLR NLR
StudyPre 20051996.9
(96.0−97.7)
99.7
(99.6−99.8)
266
(106−665)
0.056
(0.033−0.095)
2.720.91
Post 20054486.4
(85.2−87.5)
99.4
(99.2−99.5)
84.6
(43.6−165)
0.126
(0.087−0.183)
4.101.27
Case–control2196.7
(96.0−97.3)
99.3
(99.0−99.5)
105
(48.0−230)
0.028
(0.010−0.076)
2.234.86
PatientBlood donors1991.6
(90.1−92.9)
99.5
(99.3−99.7)
89.2
(32.8−243)
0.106
(0.055−0.204)
3.821.86
HIV+672.3
(67.9−76.4)
99.8
(99.5−99.9)
193
(77.4−497)
0.29
(0.22−0.38)
0.3840.0059
HIV-492.6
(89.8−94.8)
99.6
(99.0−99.9)
79.5
(11.6−545)
0.08
(0.05−0.13)
2.970.080
Index testWhole blood1191.7
(89.1−93.9)
99.9
(99.8−99.9)
347
(158−762)
0.089
(0.058−0.136)
0.810.24
Determine1290.8
(88.9−92.4)
99.1
(98.9−99.4)
239
(17.1−33300)
0.077
(0.035−0.168)
20.21.56
BinaxNOW697.6
(96.2−98.6)
100
(99.7−100)
221
(36.1−1350)
0.045
(0.016−0.128)
3.531.20
VIKIA382.5
(77.5−86.7)
99.9
(99.8−100)
1070
(376−3060)
0.108
(0.026−0.458)
<0.0051.472
Serodia382.5
(77.5−86.7)
99.9
(99.8−100)
285
(71.4−1140)
0.045
(0.029−0.069)
<0.005<0.005
Reference testCMIA980.4
(77.9−82.6)
99.0
(99.6−99.3)
58.5
(31.3−109)
0.141
(0.074−0.268)
0.440.73

n = number of data points

Table 6Summary pooled diagnostic accuracy of HBsAg assays by brand

EIA referenceNAT reference
Type Brand name Sen (95% CI) Spec (95% CI) Sen (95% CI) Spec (95% CI)
RDTAbon50.0 (28.2−71.8)99.2 (95.7−100)
RDTAccurate50.0 (33.4−66.6)94.7 (74.0−99.9)
RDTACON88.0 (83.4−91.7)99.4 (99.0−99.7)92.9 (87.3−96.5)99.1 (96.6−99.9)
RDTAcull-Tell54.5 (33.2−75.6)99.2 (95.7−100)
RDTAM RAD95.2 (76.2−99.9)100 (39.8−100)
RDTAtlas97.5 (92.9−99.5)97.5 (92.9−99.5)
RDTBIN AX97.6 (96.2−98.6)99.9 (99.7−100)
RDTBlue Cross99.2 (95.4−100)98.3 (94.1−99.8)
RDTBiotec58.8 (40.7−75.4)85.7 (63.7−97.0)
RDTCore TM50.0 (28.2−71.8)98.4 (94.5−99.8)
RDTCortez60.0 (14.7−94.7)100 (92.1−100)79.7 (73.1−85.3)97.2 (94.0−99.0)
RDTCypress96.7 (90.7−99.3)96.3 (90.9−99.0)
RDTDainascreen100 (98.7−100)100 (99.3−100)
RDTDetermine90.8 (88.9−92.4)99.1 (98.9−99.4)
RDTDIMA98.3 (94.1−99.8)99.2 (95.4−100)
RDTDipstick (PATH)93.3 (68.1−99.8)100 (98.1−100)
RDTDRW98.1 (96.1−99.2)99.5 (98.8−99.9)
RDTDRW v299.3 (97.4−99.9)98.3 (97.5−98.9)
RDTEspline93.9 (89.1−97.1)94.7 (82.3−99.4)
RDTGenedia98.0 (94.3−99.6)100 (96.4−100)
RDTHepacard90.5 (82.1−95.8)99.7 (99.5−99.9)
RDTHexagon95.6 (89.1−98.8)96.4 (90.9−99.0)
RDTIntec50.8 (43.3−58.4)100 (94.9−100)99.2 (95.4−100)97.5 (92.9−99.5)
RDTNanosign73.7 (48.8−90.9)97.8 (95.4−99.2)
RDTOnecheck52.6 (35.8−69.0)100 (82.4−100)
RDTOnsite80.0 (28.4−99.5)100 (92.1−100)
RDTQuick Profile90.5 (82.1−95.8)99.7 (99.5−99.9)
RDTQuickChaser83.3 (68.6−93.0)99.5 (98.2−99.9)
RDTRapid Care54.5 (32.2−75.6)99.2 (95.7−100)
RDTSD Bioline100 (63.1−100)100 (98.9−100)
RDTSerodia95.8 (93.4−97.5)99.8 (99.1−100)
RDTSimpliRed93.3 (68.1−99.8)100 (98.1−100)
RDTVEDA Lab62.3 (50.6−73.1)99.2 (97.6−99.8)
RDTVIKIA82.5 (77.5−86.7)99.9 (99.8−100)
RDTVirucheck92.3 (86.3−96.2)97.3 (95.5−98.5)
RDTWondfo59.1 (36.4−79.3)99.2 (95.7−100)
EIAADVIA77.4 (65.0−87.1)97.9 (92.6−99.7)
EIAArchitect97.9 (93.9−99.6)99.6 (98.7−99.9)
EIAAxSym56.6 (44.7−67.9)86.8 (81.5−90.9)
EIAAxSym v277.4 (67.0−85.8)75.0 (66.1−82.6)
EIACobas96.6 (92.8−98.8)100 (94.9−100)
EIAElecsys63.4 (55.2−71.0)95.8 (92.4−98.0)
EIAKHB73.8 (68.7−78.6)88.1 (82.4−92.5)
EIALiaison100 (97.6−100)70.0 (63.1−76.3)
EIALiaison Ultra97.1 (92.8−99.2)99.4 (98.5−99.8)
EIAMonolisa100 (95.2−100)91.1 (78.8−97.5)
EIAMonolisa Ultra98.7 (92.9−100)90.7 (77.9−97.4)
EIAMurex v398.6 (94.9−99.8)99.3 (98.3−99.8)
EIAVIDAS Ultra69.0 (58.0−78.7)94.0 (88.0−97.5)
EIAWantai78.2 (71.4−84.0)100 (94.9−100)

Pooled results and I2 (heterogeneity)

TestRefStudies, nData, ndI2 Sen, %I2 Spec, %
ACONNAT2296.00.0
CortezNAT2397.50.0
ADVIANAT120.00.0
AxSymNAT1295.889.1
ElecsysNAT220.049.2
ACONEIA2386.895.2
BinaxEIA3677.325.3
DainascreenEIA220.00.0
DetermineEIA101292.997.0
DRWEIA1276.279.2
DRW v2EIA1371.50.0
HepacardEIA2251.396.6
QuickchaserEIA1220.70.0
SerodiaEIA330.00.0
VIKIAEIA3393.47.3
VirucheckEIA2361.011.9

GRADE

Question: Should RDTs be used to diagnose HBsAg in HIV-negative individuals?

Sensitivity0.88–0.95Prevalences5%20%
Specificity0.93–1.00
OutcomeNo. of studies (no. of patients)Study designFactors that may decrease quality of evidenceEffect per 1000 patients/yearTest accuracy QoE
Risk of biasIndirectnessInconsistencyImprecisionPublication biaspre-test probability of 5%pre-test probability of 20%
True positives
(patients with HBsAg)
4 studies
997 patients
Cross-sectional (cohort type accuracy study)Serious1Not serious2Serious3Serious4None44−48176−190⊕◯◯◯
Very low1234
False negatives
(patients incorrectly classified as not having HBsAg)
2−610−24
True negatives
(patients without HBsAg)
4 studies
997 patients
Cross-sectional (cohort type accuracy study)Serious1Not serious2Serious3Not serious5None884−950744−800⊕⊕◯◯
Low1235
False positives
(patients incorrectly classified as having HBsAg)
0−660−56
1

Downgraded by one for risk of bias: all studies were prospective cohort studies40, although one was assessed as high risk of bias because patients were pre-selected based from known chronic hepatitis B patients.

2

Although study was not specifically designed in HIV-negative patients, clear testing and results were included.

3

Downgraded by one for inconsistency: unexplained heterogeneity may arise from differences between studies in specimen condition (serum, whole blood), specimen processing (field vs laboratory), reference tests (CMIA; EIA on dried blood spots) and study population (e.g. known chronic hepatitis B patients, general community screen).

4

Downgraded by one for imprecision: confidence intervals extend below 90% accuracy, with tau-squared for PLR >1 (indicating substantial heterogeneity).

Question: Should RDTs be used to diagnose HBsAg in HIV-positive individuals?

Sensitivity0.72 (95% CI: 0.68–0.76)Prevalences5%20%
Specificity1.00 (95% CI: 0.99–1.00)
OutcomeNo. of studies (no. of patients)Study designFactors that may decrease quality of evidenceEffect per 1000 patients/yearTest accuracy QoE
Risk of biasIndirectnessInconsistencyImprecisionPublication biaspre-test probability of 5%pre-test probability of 20%
True positives
(patients with HBsAg)
5 studies
2566 patients
Cross-sectional (cohort type accuracy study)Serious1Not serious2Serious3Serious4None36 (34−38)145 (136−153)⊕◯◯◯
Very low1234
False negatives
(patients incorrectly classified as not having HBsAg)
14 (12−16)55 (47−64)
True negatives
(patients without HBsAg)
5 studies
2566 patients
Cross-sectional (cohort type accuracy study)Serious1Not serious2Not serious5Not serious6None948 (945−949)798 (796−799)⊕⊕⊕◯
Moderate1256
False positives
(patients incorrectly classified as having HBsAg)
2 (1−5)2 (1−4)
1

Downgraded by one for risk of bias: all studies were prospective cohort studies of consecutive patients. Studies used different specimens (serum, 2; capillary whole blood, 1; venous whole blood, 1), reference standards (CMIA, EIA confirmed by neutralization), and had patients with different ART status (four studies ART naive).

2

Not downgraded for indirectness: all studies performed in cohorts of consecutive patients in Tanzania20, Ghana36, Malawi19, South Africa37 and Bissau38.

3

Downgraded by one for inconsistency with sensitivities ranging from 62% to 100%: unexplained heterogeneity may arise from differences between studies in specimen type, specimen processing and study population. Two Studies19,20 had very high sensitivities (100%, 96%) while remainder3638 had low sensitivities (range 62−70%). Tau-squared <1 for studies

4

Downgraded by one for imprecision: confidence intervals 67.9−76.4%. Two studies19,20 had very high sensitivities (100%, 96%) while remainder3638 had low sensitivities (range 62−70%).

5

Not downgraded for inconsistency: specificities ranged from 99% to 100%, with tau-squared <1

6

Not downgraded for imprecision: narrow confidence interval

Question: Should Determine HBsAg be used to diagnose HBsAg in a global setting?

Sensitivity0.91 (95% CI: 0.89 to 0.92)Prevalences5%20%
Specificity0.99 (95% CI: 0.99 to 0.99)
OutcomeNo. of studies (no. of patients)Study designFactors that may decrease quality of evidenceEffect per 1000 patients/yearTest accuracy QoE
Risk of biasIndirectnessInconsistencyImprecisionPublication biaspre-test probability of 5%pre-test probability of 20%
True positives
(patients with HBsAg)
12 studies
7552 patients
Cohort & case–control type studies1SeriousNot seriousVery serious2Not seriousNone45 (44−46)182 (178−185)⊕◯◯◯
Very low2
False negatives
(patients incorrectly classified as not having HBsAg)
5 (4−6)18 (15−22)
True negatives
(patients without HBsAg)
12 studies
7552 patients
Cohort & case–control type studiesSeriousNot seriousSerious3Not seriousNone941 (940−944)793 (791−795)⊕⊕◯◯
Low3
False positives
(patients incorrectly classified as having HBsAg)
9 (6−10)7 (5−9)
1

Lin25, Lien24 and Randrianirina30 used a case–control design

2

Significant heterogeneity across studies for sensitivity; tau-squared 20.2

3

Heterogeneity exists, but with lower clinical impact; tau-squared 1.56

6. Discussion

Study findings

Diagnostic accuracy of HBsAg assays using immunoassay reference

Overall, the diagnostic accuracy of 33 RDTs and 8 EIAs were assessed against an EIA reference standard. Total numbers of patients included 36,131 (RDT vs EIA, figure 3) and 3751 (EIA vs EIA, figure 4). Both RDTs and EIAs had similar sensitivity and specificity compared to an EIA reference standard (Table 3).

Clinical sensitivity estimates for both RDTs and EIAs were characterized by statistical heterogeneity, whereas specificity estimates were less heterogeneous (Figures 3 and 4). This applied across brands (Table 6). Heterogeneity can be caused by the use of different reference standards assays, clinical subgroups within the study population, age (children versus adults), patient status and stage of disease.

Compared to previous systematic reviews, the pooled clinical sensitivity 90.0% (95% CI: 89.1–90.8) and specificity 99.5% (95% CI: 99.4–99.5) is slightly inferior for RDTs compared to an EIA reference standard (Table 3). In particular Results were very heterogeneous in terms of sensitivity (Table 7). Khuroo et al.11 reported 96.7% sensitivity (95% CI: 95.3, 97.7) and 99.7% specificity (95% CI: 98.6, 99.9). Studies included conference abstracts and studies using reference panels. Shivkumar et al.60 reported a pooled sensitivity 98.2% (95% CI: 94.7, 99.9) and pooled specificity 99.9% (95% CI: 99.3, 100).

Table 7Summary pooled diagnostic accuracy of HBsAg assays compared to previous reviews

Review, yearIndex
Test
Clinical Accuracy
n Sen (95% CI)Spec (95% CI)
PICO 1, 2015RDT6390.0 (89.1−90.8)99.5 (99.4−99.5)
EIA888.9 (87.0−90.6)98.4 (97.8−98.8)
Hwang, 2008RDT98.1 (97.7−98.5)99.6 (99.2−99.9)
Shivkumar, 2012RDT94.8 (90.1−98.2)99.5 (99.0−100)
Khuroo, 2014RDT97.1 (96.1−7.9)99.9 (99.8−00)

*Sen: sensitivity; Spec: specificity; Cl: confidence interval; RDT: rapid diagnostic test; EIA: enzyme immunoassay; LR+: positive likelihood ratio; LR: negative likelihood ratio; REM: random effects model

When comparing EIAs to newer CMIA (chemiluminescent assays), two standard ELISA/EIA based assays manufactured in markets with transitioning economies appeared to perform poorly compared to other assays.4 Of note, data exists for one assay (KHB) using different signal cut-off ratio’s (S/CO), with improved sensitivity but worse specificity when using the grey zone (S/CO 0.2–0.99); sensitivity 96.2%, specificity 70.6% compared to sensitivity of 73.8% and specificity of 88.1%.45

Results for EIAs are more specific but less sensitive when used in conjunction with manufacturers’ neutralisation assays. In one study,56 Liason HBsAg (Diasorin) had sensitivity 100% and specificity 70% compared to NAT, with improved overall accuracy using with a neutralisation assay (sensitivity 96%, specificity 100%). This shows the critical need to use the neutralization step to confirm any HBsAg reactivity observed upon initial testing.

Diagnostic accuracy of HBsAg assays using NAT reference

The specificity of RDTs and EIA was lower when using a NAT reference; this is understandable as the serological assays detect HBsAg whereas NAT detects HBV DNA. The viral kinetics of HBV DNA and HBsAg are not identical. One limitation of HBV DNA as a diagnostic assay would be that those on anti-viral treatment, including antiretroviral therapy for HIV (containing lamivudine or tefonovir) might be non-detectable HBV DNA in the presence of HBsAg.

The pooled clinical sensitivity of RDTs was 93.3% (95% CI 91.3–94.9) and significantly higher than EIAs 75.7% (95% CI 72.1–79.1) using a NAT reference. It is important to note that study characteristics varied, with one laboratory based case-control study with pre-selected patients showing particularly good results for RDTs vs NAT and providing 6 data points in this analysis.47 The remaining studies in this sub-analysis were all performed in field settings in resource-limited settings, with poor sensitivity (38–60%).

Sub-analyses

HIV

Our results showed that RDTs may be less sensitive in HIV-positive patients. There was still heterogeneity in terms of results, with one otherwise good quality review finding that Determine was 96 % sensitive (95% CI: 80,100) and 100% specific (95% CI: 99,100) in this cohort.20

The difficulty of accurate diagnosis in HIV patients is possibly explained by an increased incidence of hepatitis B and in particular occult hepatitis B in this cohort. In Sudanese HIV-positive ART naïve patients, 27% had detectable HBV DNA, with occult hepatitis B in 15%.61 Among 495 treatment naïve, HIV-infected adults in Cote-d’Ivoire, 13% were HBsAg positive, 42% isolated anti-HBc positive, and 10% occult hepatitis B only detected by NAT.62 Median HBV DNA level was lower in those with occult HBV compared to those with CHB.

Immune pressure has also been hypothesized to contribute, with Geretti et al. noting that discrepant results for RDTs were all mutants in their study. The overlapping surface and polymerase genes in the HBV genome could imply that RT inhibitors (e.g. lamivudine) can lead to the emergence of variants carrying mutations of both the polymerase and surface genes, hence avoiding detection by standard HBsAg assays.

Blood Donors

Pre-transfusion screening of blood donations is a major public health challenge in resource-limited settings, where prevalence rates for TTIs (transfusion-transmissible infections) are significant. Screening of individuals with RDTs pre-donation have been adopted in areas with insufficient laboratory capacity.

Diagnostic accuracy in our review was similar in blood donors compared to the overall pooled estimates of RDTs, with sensitivity 91.6 % (95% CI: 90.1, 92.9) and specificity 99.5% (95% CI 99.3, 99.7). Results were very heterogeneous, with one study in particular having very low sensitivity (~50–60). Two studies comparing EIAs against EIAs in blood donors had higher accuracy, with pooled sensitivity 99.3 % (95% CI: 96.4, 100) and specificity 90.9 % (95% CI 82.9, 96.0).

A recent multinational assessment accuracy of TTI screening in Africa using both RDTs and EIAs on an external quality assessment panel found poor overall sensitivity (75.6%) and specificity (94.5%) for HBsAg detection.63 This was driven by very poor clinical sensitivity (47.4%) of HBsAg RDTs, which was lower than that for HCV (63.7%) and HIV (72.4%) in this population. This can be explained by their lower analytical sensitivity, difficulties in transport and quality assurance, in addition to often studies being performed on smaller scales. In a Nigerian blood donor study, 10% of 113 HBsAg-negative repeat donors using RDTs were found to have quantifiable HBV DNA.57 These patients either had acute infection or occult chronic infection.

In a recent systematic review of studies evaluating RDTs for infectious disease blood screening in Africa, there was again significant variability in performance.64 RDTs for HBsAg detection were again identified for suboptimal sensitivities, with questionable suitability, especially in high prevalence regions. High false negatives could be due to operator error, low HBsAg levels, assay degeneration or lot variation.

Whole blood

For rapid diagnostic tests, accuracy using whole blood (capillary and venous) was marginally superior to serum. The accuracy was comparable to that of EIAs using serum; data from the eight studies (eleven data points) is also less heterogenous (Annex 9.3.2). The significantly lower sensitivity of RDTs using plasma is possibly explained by the nature of the studies; one was in a population of blood donors, while the other was initially designed to assess the accuracy of RDTs in determining HBV and HCV prevalence in a Malawian population with high HIV-co-infection rates.41 The authors of the latter study hypothesised that local operational problems or unexpected technical issues were the reason for poor performance in resource-limited setting. Others have also since suggested that the high HIV-co-infection rate could have contributed, with suppression of HBV replication using lamivudine containing regiments potentially hindering affecting detection by RDT.

Study setting – field

Some heterogeneity is explained by location where RDTs are performed. Two different studies from Malawi, in a predominantly HIV-positive cohort41 or entirely HIV-positive cohort19 produced very different results for the same test (Determine HBsAg). Pooled sensitivity 56% (95% CI: 38, 73) and specificity 69% (95% CI: 62, 76) were much lower in the field study compared to the sensitivity 100% (95% CI: 86, 100) and specificity 100% (95% CI: 93, 100) in the study where samples were returned to the UK.

Analytical sensitivity of different assays as a source of heterogeneity

We were unable to explain heterogeneity of results using different assays. Very few rapid tests meet required analytical LOD (0.130 IU/mL) required by regulatory authorities, but because of insufficient data in studies we were unable to stratify using LOD as a source of heterogeneity. This is important as it has been suggested that false-negative HBsAg RDTs are associated with lower HBsAg levels, low viral load, HBsAg mutants, or specific genotypes, in addition to ART exposure where lamivudine and tenofovir are used. (16, 25, 36, 65)

In a recent fields studies in the Gambia,40 the range of serum HBsAg levels quantified by CMIA that showed reactivity with RDTs in the field was 26.5–27, 320 IU/mL, with a statistically significant (P = 0.0002) difference in median HBsAg level (875 IU/mL) compared to false negatives using RDT’s (median 1.2; range 0.8–25.5 IU/mL). Interestingly significantly more false-negatives were female (P = 0.05) with lower median ALT levels (P = 0.01). The laboratory-based study from the same publication in a chronic hepatitis B cohort found a higher range of HBsAg levels (2.8–124,925 IU/mL) in those testing positive with RDTs, with a significant difference in median HBsAg levels (7, 482 vs 0.40 IU/mL; P <0.0001) and median ALT (P = 0.01) between true-positives and false negatives. The lower limit of detection may be explained by differences in methodology, given the setting (laboratory vs field), reference test (CMIA vs ELISA) and sample type (dried blood spots vs serum). This suggests that subjects with false negatives have lower HBsAg levels and inactive disease compared to true-positives, minimising the impact of reduced sensitivity. Unfortunately, in the single study identified also assessing LSM, 17% (4/23) subjects with false negative results had evidence of fibrosis and would require antiviral therapy.

Another study (Bottero et al)16 also found significantly lower median HBsAg in false negatives vs true positives. [19.5 vs 2351 IU/mL; p=0.0001], with only 4 false negative having HBsAg >10 IU/mL. HBV DNA was usually below 200 IU/mL. False positives occurred in vaccinate patients (n=7), and one patient with resolved infection and anti-HBs titre. Interestingly ALL false negatives were HBcAb positive.

Data exists from large studies of analytical sensitivity using reference, seroconversion, mutant panels.53,65,66 These include specimens from individuals with low antigenaemia, such as early infection. Unfortunately, studies of analytical sensitivity of EIAs are conflicting. One study suggested that 9 out of 10 EIAs were able to detect HBsAg levels as low as 0.2 IU/mL irrespective of genotype.67 Another comparing newer EIAs (Advia Centaur; Monolisa Ultra; Liasion; Vidas Ultra) using reference and mutant panels found a lower limit of detection <350IU/mL, but with varying sensitivity for mutant detection (37.1%–91.4%).68 The authors hypothesised that the lack of detection was due to epitope recognition of the anti-HBs assay reagents in the capture phase and in conjugates. Another study assessing 13 different assays with mutant panels found a range of LOD (0.011–0.096 IU/mL) and sensitivity (63%–98%) in mutants. Another study found comparable analytical sensitivity between four EIAs but significant differences in detection of mutants between assays.69 One blood donor study in China found a significant difference in sensitivities and mutant detection capabilities amongst assays used by blood banks, with the urgent recommendation of a list of high sensitivity assays for blood bank screening.70

In blood donors, studies have found some correlation between HBsAg levels (IU/mL) and NAT (copies/mL).71 The obvious benefit of more sensitive assays with lower limits of detection would be improved detection of those with occult hepatitis B or in the early window period of sero-conversion.

It has been suggested that utilizing “grey zones” in EIAs could improve sensitivity and allow combination of tests to develop of economic testing strategies.45 Sensitivity improved from 76–88% to 96–97%, with a further increase to 99% when combining the use of two EIAs.

Studies looking at RDTs using clinical panels have found sometimes conflicting results. One study found equivalent specificities but significant differences in assay sensitivity between Uni-Gold™ HBsAg and Determine HBsAg.72

Interestingly, studies in Cambodia and Viet Nam by the same group produced different results for sensitivity, suggesting uncontrolled variables, such as prozone effect and genotype variations. The prozone effect may explain why some true positives turned out negative with rapid tests. Given that specificity is excellent but sensitivity is low suggests that this is genuine poor performance.

Study strengths and limitations

Significant strengths of this meta-analysis include the global evidence base, rigorous pre-specified protocol incorporating numerous major scientific databases, in addition to review of the related literature, notably occult hepatitis B and the impact of NAT. We included studies performed in a range of settings, with a diverse population. We only included studies with bivariate data, to minimise bias, measuring clinical sensitivity which are more applicable. We also included evaluations of both RDTs and EIAs, and as such are able to provide a more comprehensive meta-analysis. Comparing RDTs with EIAs, we were able to identify an additional 11 studies not found in previous reviews. Incorporation bias was unlikely as all participants received both index and confirmatory tests independently. As all studies administered the same reference standard to all patients, which reduces risk of verification bias. Our study also excluded articles deemed to be high risk of bias or less applicable, such as conference abstracts or reference panels; reference panels, included in previous reviews, have higher accuracy than that of tests used in the field but are not as useful in guiding policy. Accuracy on seroconversion panels do not necessarily reflect the antibody or antigen spectrum in the populations studied.

Our study, did, however have a number of limitations. First, we only included studies in English, which potentially introduces publication (language) bias. We will identify relevant studies in non-English languages from reference lists to address whether this contributed to a substantial bias or not. Second, a significant proportion of studies were case–control in design or used preselected cohorts, which would bias results. For example, in well-conducted studies from the Gambia,40 those in the community setting had a smaller range of HBsAg levels (26.5–27, 320 IU/mL) than the study conducted in chronic hepatitis B patients (2.8–124,925 IU/mL). This is one reason for the reduced sensitivity of the same test (Determine HBsAg) in the screening cohort (88%; 95% CI: 81, 94) compared to the chronic hepatitis cohort (95%; 95% CI: 90, 98) from the same community. Third, some analyses were based on a small number of studies, which included few positive samples.

There are number of technical and patient factors that could impact accuracy, which cannot be addressed based on the currently available literature. Specific to hepatitis B diagnosis, we were unable to correlate the heterogeneity of sensitivity with different stages, severity and genotypes infection. This was due to insufficient information in studies, principally additional serology such as HBeAg, anti-HBc IgM, anti-HBc total and anti-HBs antibodies. Genetic information has long been suspected to impact on diagnostic accuracy,6770,73,74 although a recent study of analytical performance found no difference in the detection of mutants.70,7375 It should be noted that this study was conducted by authors with significant conflicts of interest. Mutants themselves are also rapidly evolving, such that the prevalence and type of specific mutants cannot be determined based on historical data, making studies difficult to organize. Finally, occult hepatitis should also be considered. The addition of NAT would be useful to stratify patients’ results, but the lack of sufficient of quality studies (Annex 9.2) is testament to the challenges in conducting advanced laboratory based studies in areas of high disease prevalence. Reference standards are also imprecise, resulting in overdiagnosis of clinically insignificant disease, and underestimation of diagnostic accuracy of clinically relevant disease. The natural history of hepatitis B, notably progression and infectiousness, is being investigated for correlations of quantitative HBsAg, HbeAg and HBV DNA levels. Low levels of either antigen may not be significant clinically. Short-term spontaneous fluctuations in DNA and HBsAg are recognized in those with chronic hepatitis B and add extra challenges to accurate diagnosis with a “gold standard”.76

Statistical heterogeneity was an obvious issue as is often observed in diagnostic accuracy reviews. Although we performed stratified analyses to identify potential sources, none fully explained the heterogeneity observed. Firstly, studies evaluated different RDTs, with rapid changes in technology for both EIAs and RDTs meaning that analytical sensitivity is variable among the assays evaluated. Although we pooled based on some RDT brands (Determine HBsAg, BinaxNOW) there were insufficient studies and this pooling did not entirely account for heterogeneity. Another potential confounder is changes in manufacturing processes, including components used to manufacture assays Determine, as one example, has been produced by Abbott, Inverness Medical and Alere Medical Co. Ltd; as the test has been commercially available for over 10 years, there will undoubtedly be minor product changes.

7. Conclusion

WHO has emphasized the importance of timely global testing, prevention and treatment of hepatitis B, with predictions of an increasing prominence as a cause of death globally in years to come. Although RDTs have limitations, many of which can be addressed through improved training and quality assurance systems, they are frequently the only viable option for infectious screening in resource-limited settings. Therefore, additional studies and specific guidelines regarding the use of RDTs in the context of blood safety and patient screening are needed. In terms of global uptake, lower costs of these assays and ease of use across a variety of endemic settings is crucial to achieving goals for control of hepatitis. Worldwide, a significant proportion of countries are unable to afford quality-assured laboratory-based testing with enzyme immunoassays; the use of NAT to further reduce the window period of infection and detect occult hepatitis is beyond reach in many settings at present.

This meta-analysis, along with others, suggests that assays for detection of HBsAg including RDTs and enzyme immunoassays have the potential to contribute significantly to the control of hepatitis B globally in endemic areas, which are often include low resource remote regions. Other benefits of RDTS include easy storage, small sample volumes required with minimal staff training or additional equipment. Unfortunately, with current issues with poor clinical and analytical sensitivity and potential difficulties in detection of occult hepatitis B and mutant variants, a number of cases would be missed. There is also concern that sensitivity is significantly reduced in HIV-positive patients.

There are numerous difficulties in conducting systematic reviews of the performance of in vitro diagnostics, particularly in resource-limited settings. There is a significant variation in terms of quality of studies, most with key parameters missing. Further promotion of current accepted standards to performing and reporting studies of diagnostic accuracy globally can help improve the evidence base currently available. Further high quality studies are desperately needed to assess the accuracy in a variety of settings and support the growing evidence base for RDTs. Specifically, further studies looking at the impact of different geographic locations and mutant phenotypes would be invaluable.

From included studies, excellent robust specificity of all assays is reassuring in terms of ensuring cost–effective initiation of algorithms for further investigation and treatment. Significant heterogeneity and suboptimal sensitivity of RDTs has to be taken into consideration as country control programmes consider the trade-off between affordability, accuracy and accessibility (i.e. ease of use in all levels of the health-care system). The weighting of these three factors are country specific and could be modelled.

8. References

1.
Ott JJ , StevensGA, GroegerJ, WiersmaST. Global epidemiology of hepatitis B virus infection: new estimates of age-specific HBsAg seroprevalence and endemicity. Vaccine. 2012;30(12):2212–9. [PubMed: 22273662]
2.
Ganem D , PrinceAM. Hepatitis B virus infection – natural history and clinical consequences. N Engl J Med. 2004;350(11):1118–29. [PubMed: 15014185]
3.
Fattovich G , StroffoliniT, ZagniI, DonatoF. Hepatocellular carcinoma in cirrhosis: incidence and risk factors. Gastroenterology. 2004;127(5Suppl 1):S35–50. [PubMed: 15508101]
4.
Lozano R , NaghaviM, ForemanK, LimS, ShibuyaK, AboyansV, et al. Global and regional mortality from 235 causes of death for 20 age groups in 1990 and 2010: a systematic analysis for the Global Burden of Disease Study 2010. Lancet. 2012;380(9859):2095–128. [PubMed: 23245604]
5.
Guidelines for the prevention, care, and treatment of persons with chronic hepatitis B infection. Geneva: WHO; 2015. [PubMed: 26225396]
6.
Fabrizi F , MartinP, DixitV, BunnapradistS, DulaiG. Meta-analysis: the effect of age on immunological response to hepatitis B vaccine in end-stage renal disease. Aliment Pharmacol Ther. 2004;20(10):1053–62. [PubMed: 15569107]
7.
Thompson Coon J , RogersG, HewsonP, WrightD, AndersonR, CrampM, et al. Surveillance of cirrhosis for hepatocellular carcinoma: systematic review and economic analysis. Health Technol Assess. 2007;11(34):1–206. [PubMed: 17767898]
8.
Qin XK , LiP, HanM, LiuJP. Xiaochaihu Tang for treatment of chronic hepatitis B: a systematic review of randomized trials. [Article in Chinese]. Zhong Xi Yi Jie He Xue Bao. 2010;8(4):312–20. [PubMed: 20388470]
9.
Hwang SH , OhHB, ChoiSE, KimHH, ChangCL, LeeEY, et al. [Meta-analysis for the pooled sensitivity and specificity of hepatitis B surface antigen rapid tests.] [Article in Korean]. Korean J Lab Med. 2008;28(2):160–8. [PubMed: 18458514]
10.
Shivkumar S , PeelingR, JafariY, JosephL, PaiNP. Rapid point-of-care first-line screening tests for hepatitis B infection: a meta-analysis of diagnostic accuracy (1980–2010). Am J Gastroenterol. 2012;107(9):1306–13. [PubMed: 22641308]
11.
Khuroo NS , KhurooMS. Accuracy of rapid point-of-care diagnostic tests for hepatitis B surface antigen – a systematic review and meta-analysis. J Clin Exp Hepatol. 2014;4(3):226–40. [PMC free article: PMC4284203] [PubMed: 25755565]
12.
Whiting PF , RutjesAW, WestwoodME, MallettS, DeeksJJ, ReitsmaJB, et al. QUADAS-2: a revised tool for the quality assessment of diagnostic accuracy studies. Ann Intern Med. 2011;155(8):529–36. [PubMed: 22007046]
13.
Bossuyt PM , ReitsmaJB, BrunsDE, GatsonisCA, GlasziouPP, IrwigLM, et al. The STARD statement for reporting studies of diagnostic accuracy: explanation and elaboration. Ann Intern Med. 2003;138(1):W1–W12. [PubMed: 12513067]
14.
Abraham P , SujathaR, RaghuramanS, SubramaniamT, SridharanG. Evaluation of two immunochromatographic assays in relation to ‘RAPID’ Screening of HBsAg. Indian J Med Microbiol. 1998;16:23–5.
15.
Akanmu AS , EsanOA, AdewuyiJO, DaviesAO, OkanyCC, OlatunjiRO, et al. Evaluation of a rapid test kit for detection of HBsAg/eAg in whole blood: a possible method for pre-donation testing. Afr J Med Med Sci. 2006;35(1):5–8. [PubMed: 17209320]
16.
Bottero J , BoydA, GozlanJ, LemoineM, CarratF, CollignonA, et al. Performance of rapid tests for detection of HBsAg and anti-HBsAb in a large cohort, France. J Hepatol. 2013;58(3):473–8. [PubMed: 23183527]
17.
Chameera EWS , NoordeenF, PandithasundaraH, AbeykoonAMSB. Diagnostic efficacy of rapid assays used for the detection of hepatitis B virus surface antigen. Sri Lankan J Infect Dis. 2013;3(2):21–7.
18.
Clement F , DewintP, Leroux-RoelsG. Evaluation of a new rapid test for the combined detection of hepatitis B virus surface antigen and hepatitis B virus e antigen. J Clin Microbiol. 2002;40(12):4603–6. [PMC free article: PMC154615] [PubMed: 12454159]
19.
Davies J , van OosterhoutJJ, NyirendaM, BowdenJ, MooreE, HartIJ, et al. Reliability of rapid testing for hepatitis B in a region of high HIV endemicity. Trans R Soc Trop Med Hyg. 2010;104(2):162–4. [PubMed: 19931107]
20.
Franzeck FC , NgwaleR, MsongoleB, HamisiM, AbdulO, HenningL, et al. Viral hepatitis and rapid diagnostic test based screening for HBsAg in HIV-infected patients in rural Tanzania. PLoS One. 2013;8(3):e58468. [PMC free article: PMC3585939] [PubMed: 23469281]
21.
Kaur H , DhanaoJ, OberoiA. Evaluation of rapid kits for detection of HIV, HBsAg and HCV infections. Indian J Med Sci. 2000;54(10):432–4. [PubMed: 11262859]
22.
Khan J , LoneD, HameedA. Evaluation of the performance of two rapid immunochromatographic tests for detection of Hepatitis B surface antigen and anti HCV antibodies using ELISA tested samples. AKEMU. 2010;16(1S1):84–7.
23.
Lau DT , MaH, LemonSM, DooE, GhanyMG, MiskovskyE, et al. A rapid immunochromatographic assay for hepatitis B virus screening. J Viral Hepat. 2003;10(4):331–4. [PubMed: 12823602]
24.
Lien TX , TienNTK, ChanpongGF, CucCT, YenVT, SoderquistR, et al. Evaluation of rapid diagnostic tests for the detection of human immunodeficiency virus types 1 and 2, hepatitis B surface antigen, and syphilis in Ho Chi Minh City, Vietnam. Am J Trop Med Hyg. 2000;62(2):301–9. [PubMed: 10813489]
25.
Lin YH , WangY, LouaA, DayGJ, QiuY, NadalaEC, Jr., et al. Evaluation of a new hepatitis B virus surface antigen rapid test with improved sensitivity. J Clin Microbiol. 2008;46(10):3319–24. [PMC free article: PMC2566085] [PubMed: 18701669]
26.
Mvere D , ConstantineNT, KatsawdeE, TobaiwaO, DambireS, CorcoranP. Rapid and simple hepatitis assays: encouraging results from a blood donor population in Zimbabwe. Bull World Health Organ. 1996;74(1):19–24. [PMC free article: PMC2486854] [PubMed: 8653812]
27.
Oh J , KimTY, YoonHJ, MinHS, LeeHR, ChoiTY. Evaluation of Genedia® HBsAg Rapid and Genedia® anti-HBs Rapid for the screening of HBsAg and Anti-HBs. Korean J Clin Pathol. 1999;19:114–7.
28.
Ola SO , OtegbayoJA, YakubuA, AjeAO, OdaiboGN, ShokunbiW. Pitfalls in diagnosis of Hepatitis B virus infection among adults nigerians. Niger J Clin Pract. 2009;12(4):350–4. [PubMed: 20329669]
29.
Raj AA , SubramaniamT, RaghuramanS, AbrahamP. Evaluation of an indigenously manufactured rapid immunochromatographic test for detection of HBsAg. Indian J Pathol Microbiol. 2001;44(4):413–4. [PubMed: 12035352]
30.
Randrianirina F , CarodJF, RatsimaE, ChretienJB, RichardV, TalarminA. Evaluation of the performance of four rapid tests for detection of hepatitis B surface antigen in Antananarivo, Madagascar. J Virol Methods. 2008;151(2):294–7. [PubMed: 18462816]
31.
Sato K , IchiyamaS, IinumaY, NadaT, ShimokataK, NakashimaN. Evaluation of immunochromatographic assay systems for rapid detection of hepatitis B surface antigen and antibody, Dainascreen HBsAg and Dainascreen Ausab. J Clin Microbiol. 1996;34(6):1420–2. [PMC free article: PMC229035] [PubMed: 8735091]
32.
Bjoerkvoll B , VietL, OlHS, LanNT, SothyS, HoelH, et al. Screening test accuracy among potential blood donors of HBsAg, anti-HBc and anti-HCV to detect hepatitis B and C virus infection in rural Cambodia and Vietnam. Southeast Asian J Trop Med Public Health. 2010;41(5):1127–35. [PubMed: 21073033]
33.
Chevaliez S , ChallineD, NaijaH, LuuTC, LapercheS, NadalaL, et al. Performance of a new rapid test for the detection of hepatitis B surface antigen in various patient populations. J Clin Virol. 2014;59(2):89–93. [PubMed: 24355522]
34.
Erhabor O , KwaifaI, BayawaA, IsaacZ, DorcasIaS I. Comparison of ELISA and rapid screening techniques for the detection of HBsAg among blood donors in Usmanu Danfodiyo University Teaching Hospital Sokoto, North Western Nigeria. J Blood Lymph. 2013;4(2).
35.
Gish RG , GutierrezJA, Navarro-CazarezN, GiangK, AdlerD, TranB, et al. A simple and inexpensive point-of-care test for hepatitis B surface antigen detection: serological and molecular evaluation. J Viral Hepat. 2014;21(12):905–8. [PMC free article: PMC4263238] [PubMed: 24779356]
36.
Geretti AM , PatelM, SarfoFS, ChadwickD, VerheyenJ, FrauneM, et al. Detection of highly prevalent hepatitis B virus coinfection among HIV-seropositive persons in Ghana. J Clin Microbiol. 2010;48(9):3223–30. [PMC free article: PMC2937686] [PubMed: 20631103]
37.
Hoffmann CJ , DayalD, CheyipM, McIntyreJA, GrayGE, ConwayS, et al. Prevalence and associations with hepatitis B and hepatitis C infection among HIV-infected adults in South Africa. Int J STD AIDS. 2012;23(10):e10–3. [PMC free article: PMC3724418] [PubMed: 23104758]
38.
Honge BL , JespersenS, TeDS, da SilvaZJ, LaursenAL, KrarupH, et al. Hepatitis B virus surface antigen and anti-hepatitis C virus rapid tests underestimate hepatitis prevalence among HIV-infected patients. HIV Med. 2014;15(9):571–6. [PubMed: 24717010]
39.
Mutocheluh M , OwusuM, KwofieTB, AkadigoT, AppauE, NarkwaPW. Risk factors associated with hepatitis B exposure and the reliability of five rapid kits commonly used for screening blood donors in Ghana. BMC Res Notes. 2014;7:873. [PMC free article: PMC4295511] [PubMed: 25475050]
40.
Njai HF , ShimakawaY, SannehB, FergusonL, NdowG, MendyM, et al. Validation of rapid point-of-care (POC) tests for detection of hepatitis B surface antigen in field and laboratory settings in the Gambia, Western Africa. J Clin Microbiol. 2015;53(4):1156–63. [PMC free article: PMC4365211] [PubMed: 25631805]
41.
Nyirenda M , BeadsworthMB, StephanyP, HartCA, HartIJ, MunthaliC, et al. Prevalence of infection with hepatitis B and C virus and coinfection with HIV in medical inpatients in Malawi. J Infect. 2008;57(1):72–7. [PubMed: 18555534]
42.
Upreti SR , GurungS, PatelM, DixitSM, KrauseLK, ShakyaG, et al. Prevalence of chronic hepatitis B virus infection before and after implementation of a hepatitis B vaccination program among children in Nepal. Vaccine. 2014;32(34):4304–9. [PMC free article: PMC4663719] [PubMed: 24951865]
43.
Liu C , ChenT, LinJ, ChenH, ChenJ, LinS, et al. Evaluation of the performance of four methods for detection of hepatitis B surface antigen and their application for testing 116,455 specimens. J Virol Methods. 2014;196:174–8. [PubMed: 24239632]
44.
Ol HS , BjoerkvollB, SothyS, Van HengY, HoelH, HusebekkA, et al. Prevalence of hepatitis B and hepatitis C virus infections in potential blood donors in rural Cambodia. Southeast Asian J Trop Med Public Health. 2009;40(5):963–71. [PubMed: 19842380]
45.
Peng J , ChengL, YinB, GuanQ, LiuY, WuS, et al. Development of an economic and efficient strategy to detect HBsAg: application of “gray-zones” in ELISA and combined use of several detection assays. Clin Chim Acta. 2011;412(23–24):2046–51. [PubMed: 21266169]
46.
Viet L , LanNT, TyPX, BjorkvollB, HoelH, GuttebergT, et al. Prevalence of hepatitis B & hepatitis C virus infections in potential blood donors in rural Vietnam. Indian J Med Res. 2012;136(1):74–81. [PMC free article: PMC3461722] [PubMed: 22885267]
47.
Ansari MHK , OmraniMD, MovahediV. Comparative evaluation of immunochromatographic rapid diagnostic tests (strip and device) and PCR methods for detection of human hepatitis B surface antigens. Hepat Mon. 2007;7(2):87–91.
48.
Nakata JM , JohnsonJM. Evaluation of rapid immunoconcentration assay for HBsAg in a prison inmate population. Annual Meeting of the American Society for Microbiology, Anaheim. 1990.
49.
Palmer C , CuadradoR, KoenigE. Multicenter evaluation of the determine™ Rapid tests for the diagnosis of HIV, Hepatitis B Surface Antigen, and Syphilis. Interscience Conference on Antimicrobial Agents and Chemotherapy, Ft Lauderdale. 1999.
50.
Torane V , ShastriJ. Comparison of ELISA and rapid screening tests for the diagnosis of HIV, hepatitis B and hepatitis C among healthy blood donors in a tertiary care hospital in Mumbai. Indian J Med Microbiol. 2008;26(3):284–5. [PubMed: 18695340]
51.
Cha YJ , YangJS, ChaeSL. [Evaluation of indigenously manufactured immunochromatographic assay systems for rapid detection of hepatitis B surface antigen and antibody.] [Article in Korean]. Korean J Lab Med. 2006;26:52–7. [PubMed: 18156700]
52.
Whang DH , UmTH. [Comparison of immunochromatography assays and quantitative immunoassays for detecting HBsAg and anti-HBs.] [Article in Korean]. Korean J Lab Med. 2005;25:186–91.
53.
Maity S , NandiS, BiswasS, SadhukhanSK, SahaMK. Performance and diagnostic usefulness of commercially available enzyme linked immunosorbent assay and rapid kits for detection of HIV, HBV and HCV in India. Virol J. 2012;9:290. [PMC free article: PMC3568713] [PubMed: 23181517]
54.
Lukhwareni A , BurnettRJ, SelabeSG, MzileniMO, MphahleleMJ. Increased detection of HBV DNA in HBsAg-positive and HBsAg-negative South African HIV/AIDS patients enrolling for highly active antiretroviral therapy at a Tertiary Hospital. J Med Virol. 2009;81(3):406–12. [PubMed: 19152393]
55.
Mphahlele MJ , LukhwareniA, BurnettRJ, MoropengLM, NgobeniJM. High risk of occult hepatitis B virus infection in HIV-positive patients from South Africa. J Clin Virol. 2006;35(1):14–20. [PubMed: 15916918]
56.
Khadem-Ansari MH , OmraniMD, RasmiY, GhavamA. Diagnostic validity of the chemiluminescent method compared to polymerase chain reaction for hepatitis B virus detection in the routine clinical diagnostic laboratory. Adv Biomed Res. 2014;3:116. [PMC free article: PMC4063113] [PubMed: 24949287]
57.
Nna E , MbamaluC, EkejinduI. Occult hepatitis B viral infection among blood donors in South-Eastern Nigeria. Pathog Glob Health. 2014;108(5):223–8. [PMC free article: PMC4153823] [PubMed: 24995918]
58.
Olinger CM , WeberB, OtegbayoJA, AmmerlaanW, van der Taelem-BruleN, MullerCP. Hepatitis B virus genotype E surface antigen detection with different immunoassays and diagnostic impact of mutations in the preS/S gene. Med Microbiol Immunol. 2007;196(4):247–52. [PubMed: 17503077]
59.
Seremba E , OcamaP, OpioCK, KagimuM, YuanHJ, AttarN, et al. Validity of the rapid strip assay test for detecting HBsAg in patients admitted to hospital in Uganda. J Med Virol. 2010;82(8):1334–40. [PubMed: 20572076]
60.
Shivkumar S , PeelingR, JafariY, JosephL, PaiNP. Rapid point-of-care first-line screening tests for hepatitis B infection: a meta-analysis of diagnostic accuracy (1980–2010). Am J Gastroenterol. 2012;107(9):1306–13. [PubMed: 22641308]
61.
Mudawi H , HusseinW, MukhtarM, YousifM, NemeriO, GlebeD, et al. Overt and occult hepatitis B virus infection in adult Sudanese HIV patients. Int J Infect Dis. 2014;29:65–70. [PubMed: 25449238]
62.
N’Dri-Yoman T , AnglaretX, MessouE, AttiaA, PolneauS, ToniT, et al. Occult HBV infection in untreated HIV-infected adults in Cote d’Ivoire. Antivir Ther. 2010;15(7):1029–34. [PubMed: 21041918]
63.
Laperche S , Francophone African Group for Research in Blood T. Multinational assessment of blood-borne virus testing and transfusion safety on the African continent. Transfusion. 2013;53(4):816–26. [PubMed: 22804482]
64.
Pruett CR , VermeulenM, ZachariasP, IngramC, TayouTagny C, BlochEM. The Use of rapid diagnostic tests for transfusion infectious screening in Africa: a literature review. Transfus Med Rev. 2015;29(1):35–44. [PubMed: 25447555]
65.
Scheiblauer H , El-NagehM, DiazS, NickS, ZeichhardtH, GrunertHP, et al. Performance evaluation of 70 hepatitis B virus (HBV) surface antigen (HBsAg) assays from around the world by a geographically diverse panel with an array of HBV genotypes and HBsAg subtypes. [Erratum appears in Vox Sang. 2010 May;98(4):581]. Vox Sang. 2010;98(3 Pt 2):403–14. [PMC free article: PMC2860763] [PubMed: 20412171]
66.
Scheiblauer H , SobollH, NickS. Evaluation of 17 CE-marked HBsAg assays with respect to clinical sensitivity, analytical sensitivity, and hepatitis B virus mutant detection. J Med Virol. 2006;78: Suppl 1:S66–70. [PubMed: 16622881]
67.
Mizuochi T , OkadaY, UmemoriK, MizusawaS, YamaguchiK. Evaluation of 10 commercial diagnostic kits for in vitro expressed hepatitis B virus (HBV) surface antigens encoded by HBV of genotypes A to H. J Virol Methods. 2006;136(1–2):254–6. [PubMed: 16707169]
68.
Ly TD , Servant-DelmasA, BagotS, GonzaloS, FereyMP, EbelA, et al. Sensitivities of four new commercial hepatitis B virus surface antigen (HBsAg) assays in detection of HBsAg mutant forms. J Clin Microbiol. 2006;44(7):2321–6. [PMC free article: PMC1489481] [PubMed: 16825343]
69.
Moerman B , MoonsV, SommerH, SchmittY, StetterM. Evaluation of sensitivity for wild type and mutant forms of hepatitis B surface antigen by four commercial HBsAg assays. Clin Lab. 2004;50(3–4):159–62. [PubMed: 15074469]
70.
Zhang R , WangL, LiJ. Hepatitis B virus transfusion risk in China: proficiency testing for the detection of hepatitis B surface antigen. Transfus Med. 2010;20(5):322–8. [PubMed: 20409073]
71.
Martin LA , StramerSL, KuhnsMC, SchlauderGG. Correlation of improved hepatitis B surface antigen detection limits with hepatitis B virus DNA nucleic acid test yield in blood donations. Transfusion. 2012;52(10):2201–8. [PubMed: 22321072]
72.
Austin PM . Comparative sensitivities and specificities of two rapid HBsAg detection methods and their relationship to a third generation commercial enzyme immunoassay. NZ J Med Lab Science. 2005;59(2):38–40.
73.
Kuhns MC , McNamaraAL, HolzmayerV, LouSC, BuschMP. Frequency of diagnostically significant hepatitis B surface antigen mutants. J Med Virol. 2007;79(Suppl. 1):S42–S6.
74.
Servant-Delmas A , Mercier-DartyM, LyTD, WindF, AllouiC, SureauC, et al. Variable capacity of 13 hepatitis B virus surface antigen assays for the detection of HBsAg mutants in blood samples. J Clin Virol. 2012;53(4):338–45. [PubMed: 22296790]
75.
Hirzel C , PfisterS, Gorgievski-HrisohoM, WandelerG, ZuercherS. Performance of HBsAg point-of-care tests for detection of diagnostic escape-variants in clinical samples. J Clin Virol. 2015;69:33–5. [PubMed: 26209374]
76.
Maylin S , SireJM, MbayePS, SimonF, SarrA, EvraML, et al. Short-term spontaneous fluctuations of HBV DNA levels in a Senegalese population with chronic hepatitis B. BMC Infect Dis. 2015;15(1):154. [PMC free article: PMC4376495] [PubMed: 25887383]

9. Annexes

9.1. Search strategy

Ovid Medline search strategy

Searched on 20 April 2015 from 1946–April week 2 2015.

  1. Hepatitis, Viral, Human/ (10382)
  2. Hepatitis Viruses/ (1363)
  3. Hepatitis Antibodies/ (5082)
  4. exp Hepadnaviridae Infections/ (47484)
  5. Hepatitis B Antibodies/ (8638)
  6. Hepatitis B virus/ (20604)
  7. Hepadnaviridae/ (192)
  8. Hepatitis B Surface Antigens/ (17007)
  9. (heptatitis-b or hep-b or (hepatitis adj5 b) or (hep adj5 b) or hbv).ti,ab. (64488)
  10. hbsag.ti,ab. (15146)
  11. or/1–10 [HEPATITIS B] (87943)
  12. exp Reagent Kits, Diagnostic/ (17747)
  13. ((rapid or point of care or near patient or poc or poct or bedside) adj5 (test or tests or testing or detect* or diagnos* or screen* or kit or kits or assay* or device*)).ti,ab. (63080)
  14. (radt or radts or rdt or rdts).ti,ab. (909)
  15. rapid test*.ti,ab. (3400)
  16. exp Enzyme-Linked Immunosorbent Assay/ (127391)
  17. Immunoassay/ (23237)
  18. Immunoenzyme Techniques/ (64864)
  19. (enzyme-linked immunosorbent assay or ELISA).ti,ab. (139374)
  20. (enzyme adj2 (immunoassay* or immuno-assay* or immunosorbent)).ti,ab. (83849)
  21. ((antigen* or antibod*) adj3 detect*).ti,ab. (59427)
  22. or/12–21 [RAPID DIAGNOSTIC TESTS] (394724)
  23. exp “Sensitivity and Specificity”/ (435087)
  24. (diagnos* accura* or sensitiv* or specific* or valid*).ti,ab. (3016884)
  25. roc curve.ti,ab. (10226)
  26. positive predictive value.ti,ab. (25496)
  27. negative predictive value.ti,ab. (20415)
  28. or/23–27 [DIAGNOSTIC ACCURACY] (3235789)
  29. 11 and 22 and 28 (3103)
  30. Humans/ (13846846)
  31. Animals/ (5442465)
  32. 30 and 31 (1513142)
  33. 31 not 32 [ALL ANIMAL STUDIES WHICH DO NOT INCLUDE COMPARISON WITH HUMANS] (3929323)
  34. 29 not 33 (2856)
  35. limit 34 to english language (2345)
Ovid Embase search strategy

Searched on 20 April 2015 from 1947–2015 April 17.

  1. hepatitis virus/ (4410)
  2. hepatitis antibody/ (2216)
  3. exp hepadnaviridae/ (42214)
  4. hepatitis B surface antigen/ (27312)
  5. (heptatitis-b or hep-b or (hepatitis adj5 b) or (hep adj5 b) or hbv).ti,ab. (94627)
  6. hbsag.ti,ab. (22290)
  7. or/1–6 [HEPATITIS B] (111321)
  8. exp diagnostic kit/ (13384)
  9. “point of care testing”/ (5530)
  10. ((rapid or point of care or near patient or poc or poct or bedside) adj5 (test or tests or testing or detect* or diagnos* or screen* or kit or kits or assay* or device*)).ti,ab. (88003)
  11. (radt or radts or rdt or rdts).ti,ab. (1652)
  12. rapid test*.ti,ab. (5049)
  13. enzyme linked immunosorbent assay/ (229634)
  14. immunoassay/ (48491)
  15. enzyme immunoassay/ (36845)
  16. enzyme linked immunospot assay/ (6789)
  17. enzyme multiplied immunoassay technique/ (768)
  18. (enzyme-linked immunosorbent assay or ELISA).ti,ab. (204052)
  19. (enzyme adj2 (immunoassay* or immuno-assay* or immunosorbent)).ti,ab. (98704)
  20. antigen detection/ (18155)
  21. antibody detection/ (34389)
  22. ((antigen* or antibod*) adj3 detect*).ti,ab. (76053)
  23. or/8–22 [RAPID DIAGNOSTIC TESTS] (525203)
  24. “sensitivity and specificity”/ (221828)
  25. diagnostic accuracy/ (189329)
  26. (diagnos* accura* or sensitiv* or specific* or valid*).ti,ab. (4113104)
  27. roc curve.ti,ab. (20232)
  28. positive predictive value.ti,ab. (37541)
  29. negative predictive value.ti,ab. (31612)
  30. or/24–29 [DIAGNOSTIC ACCURACY] (4280338)
  31. 7 and 23 and 30 (4018)
  32. human/ (15785497)
  33. animal/ (1646303)
  34. 32 and 33 (404532)
  35. 33 not 34 [ALL ANIMAL STUDIES WHICH DO NOT INCLUDE COMPARISON WITH HUMANS] (1241771)
  36. 31 not 35 (3963)
  37. limit 36 to english language (3344)
Web of Science

Search was conducted on the Science Citation Index Expanded (1970–20 April 2015) and the Conference Proceedings Citation Index-Science (1990–20 April 2015).

  1. TOPIC: (“hepatitis-b” OR “hep-b” OR (hepatitis near/5 b) OR (hep near/5 b) OR hbv) (79,505)
  2. TOPIC: (hbsag) (12,160)
  3. #2 OR #1 (81,526)
  4. TOPIC: ((rapid near/5 test) or (rapid near/5 tests) or (rapid near/5 testing) or (rapid near/5 detect*) or (rapid near/5 diagnos*) or (rapid near/5 screen*) or (rapid near/5 kit) or (rapid near/5 kits) or (rapid near/5 assay*) or (rapid near/5 device*)) (77,863)
  5. TOPIC: ((“point of care” near/5 test) or (“point of care” near/5 tests) or (“point of care” near/5 testing) or (“point of care” near/5 detect*) or (“point of care” near/5 diagnos*) or (“point of care” near/5 screen*) or (“point of care” near/5 kit) or (“point of care” near/5 kits) or (“point of care” near/5 assay*) or (“point of care” near/5 device*)) (5,974)
  6. TOPIC: ((“near patient” near/5 test) or (“near patient” near/5 tests) or (“near patient” near/5 testing) or (“near patient” near/5 detect*) or (“near patient” near/5 diagnos*) or (“near patient” near/5 screen*) or (“near patient” near/5 kit) or (“near patient” near/5 kits) or (“near patient” near/5 assay*) or (“near patient” near/5 device*)) (423)
  7. TOPIC: ((poc near/5 test) or (poc near/5 tests) or (poc near/5 testing) or (poc near/5 detect*) or (poc near/5 diagnos*) or (poc near/5 screen*) or (poc near/5 kit) or (poc near/5 kits) or (poc near/5 assay*) or (poc near/5 device*)) (866)
  8. TOPIC: ((poct near/5 test) or (poct near/5 tests) or (poct near/5 testing) or (poct near/5 detect*) or (poct near/5 diagnos*) or (poct near/5 screen*) or (poct near/5 kit) or (poct near/5 kits) or (poct near/5 assay*) or (poct near/5 device*)) (522)
  9. TOPIC: ((bedside near/5 test) or (bedside near/5 tests) or (bedside near/5 testing) or (bedside near/5 detect*) or (bedside near/5 diagnos*) or (bedside near/5 screen*) or (bedside near/5 kit) or (bedside near/5 kits) or (bedside near/5 assay*) or (bedside near/5 device*)) (2,705)
  10. TOPIC: (radt or radts or rdt or rdts) (1,406)
  11. TOPIC: (“rapid test*”) (3,783)
  12. TOPIC: (“enzyme-linked immunosorbent assay” or ELISA) (141,435)
  13. TOPIC: ((enzyme near/2 immunoassay*) or (enzyme near/2 immuno-assay*) or (enzyme near/2 immunosorbent)) (85,660)
  14. TOPIC: ((antigen* near/3 detect*) or (antibod* near/3 detect*)) (56,976)
  15. #14 OR #13 OR #12 OR #11 OR #10 OR #9 OR #8 OR #7 OR #6 OR #5 OR #4 (286,936)
  16. TOPIC: (“diagnos* accura*” or sensitiv* or specific* or valid*) (4,557,124)
  17. TOPIC: (“roc curve”) (12,767)
  18. TOPIC: (“positive predictive value”) (23,706)
  19. TOPIC: (“negative predictive value”) (18,947)
  20. #19 OR #18 OR #17 OR #16 (4,566,667)
  21. #20 AND #15 AND #3 (1,789)
  22. #20 AND #15 AND #3 Refined by: LANGUAGES: (ENGLISH) (1,720)
Scopus

Search was conducted on 20 April 2015.

TITLE-ABS-KEY ((“heptatitis-b” OR “hep-b” OR (hepatitis W/5 b) OR (hep W/5 b) OR hbv OR hbsag) AND (((rapid OR “point of care” OR “near patient” OR poc OR poct OR bedside) W/5 (tests OR test OR testing OR detect* OR diagnos* OR screen* OR kit OR kits OR assay* OR device*)) OR radt OR radts OR rdt OR rdts OR “rapid test*” OR “enzyme-linked immunosorbent assay” OR elisa OR (enzyme W/2 (immunoassay* OR immuno-assay* OR immunosorbent)) OR ((antibod* OR anigen*) W/3 detect*)) AND (“diagnos* accura*” OR sensitiv* OR specific* OR valid* OR “roc curve” OR “positive predictive value” OR “negative predictive value”)) AND (LIMIT-TO (LANGUAGE, “English”)) (3,605)

Cochrane Central Register of Controlled Trials, Wiley

The search was run on 20 April 2015.

  1. MeSH descriptor: [Hepatitis, Viral, Human] this term only
  2. MeSH descriptor: [Hepatitis Viruses] this term only
  3. MeSH descriptor: [Hepatitis Antibodies] this term only
  4. MeSH descriptor: [Hepadnaviridae Infections] explode all trees
  5. MeSH descriptor: [Hepatitis B Antibodies] this term only
  6. MeSH descriptor: [Hepatitis B virus] this term only
  7. MeSH descriptor: [Hepadnaviridae] this term only
  8. MeSH descriptor: [Hepatitis B Surface Antigens] explode all trees
  9. “hepatitis-b”:ti,ab,kw (Word variations have been searched)
  10. “hep-b”:ti,ab,kw (Word variations have been searched)
  11. hepatitis near/5 b:ti,ab,kw (Word variations have been searched)
  12. hep near/5 b:ti,ab,kw (Word variations have been searched)
  13. hbv:ti,ab,kw (Word variations have been searched)
  14. hbsag:ti,ab,kw (Word variations have been searched)
  15. #1 or #2 or #3 or #4 or #5 or #6 or #7 or #8 or #9 or #10 or #11 or #12 or #13 or #14
  16. MeSH descriptor: [Reagent Kits, Diagnostic] explode all trees
  17. (rapid or “point of care” or “near patient” or poc or poct or bedside) near/5 (test or tests or testing or detect* or diagnos* or screen* or kit or kits or assay* or device*):ti,ab,kw (Word variations have been searched)
  18. radt or radts or rdt or rdts:ti,ab,kw (Word variations have been searched)
  19. “rapid test*”:ti,ab,kw (Word variations have been searched)
  20. MeSH descriptor: [Enzyme-Linked Immunosorbent Assay] explode all trees
  21. enzyme near/2 (immunoassay* or immuno-assay* or immunosorbent):ti,ab,kw (Word variations have been searched)
  22. (antigen* or antibod*) near/3 detect*:ti,ab,kw (Word variations have been searched)
  23. MeSH descriptor: [Immunoassay] this term only
  24. MeSH descriptor: [Immunoenzyme Techniques] this term only
  25. “enzyme-linked immunosorbent assay” or ELISA:ti,ab,kw (Word variations have been searched)
  26. #16 or #17 or #18 or #19 or #20 or #21 or #22 or #23 or #24 or #25
  27. MeSH descriptor: [Sensitivity and Specificity] explode all trees
  28. diagnos* accura* or sensitiv* or specific* or valid*:ti,ab,kw (Word variations have been searched)
  29. “roc curve”:ti,ab,kw (Word variations have been searched)
  30. “positive predictive value”:ti,ab,kw (Word variations have been searched)
  31. “negative predictive value”:ti,ab,kw (Word variations have been searched)
  32. #27 or #28 or #29 or #30 or #31
  33. #15 and #26 and #32

The search found 64 trials.

Literatura Latino-Americana e do Caribe em Ciências da Saúde (LILACS) (BIREME interface)

LILACS was searched on 20 April 2015

(“hepatitis b” or “hep b” or “hbv” or “hbsag”) and (“rapid test$” or “point of care test$” or “near patient test$” or “poc test$” or poct or “bedside test$” or “rapid detect$” or “point of care detect$” or “near patient detect$” or “poc detect$” or “bedside detect$” or “rapid diagnos$” or “point of care diagnos$” or “near patient diagnos$” or “poc diagnos$” or “bedside diagnos$” or “rapid screen$” or “point of care screen$” or “near patient screen$” or “poc screen$” or “bedside screen$” or “rapid kit$” or “point of care kit$” or “near patient kit$” or “poc kit$” or “bedside kit$” or “rapid assay$” or “point of care assay$” or “near patient assay$” or “poc assay$” or “bedside assay$” or “rapid device$” or “point of care device$” or “near patient device$” or “poc device$” or “bedside device$” or radt or radts or rdt or rdts or “enzyme-linked immunosorbent assay” or “antigen$ detect$” or “antibod$ detect$” or elisa or immunoassay or immunoenzyme or “immuno-assay”) and (“diagnos$ accura$” or sensitiv$ or specific$ or valid$ or “roc curve” or “positive predictive value” or “negative predictive value”) (33)

WHO Global Index Medicus

The database was searched on 22 April 2015.

SUBJECT: ((“Hepatitis, Viral, Human” OR “Hepatitis Viruses” OR “Hepatitis B virus” OR “Hepatitis Antibodies” OR “Hepadnaviridae Infections” OR “Hepatitis B Antibodies” OR “Hepatitis B Virus” OR “Hepadnaviridae” OR “Hepatitis B Surface Antigens”) AND (“Reagent Kits, Diagnostic” OR “Enzyme-Linked Immunosorbent Assay” OR “Immunoassay” OR “Immunoenzyme Techniques”) AND (“Sensitivity and Specificity”)) (478)

Summary data for studies assessing diagnostic accuracy against a NAT-reference standard

Table 8Study characteristics – RDT/EIA vs NAT

Study
[Author, Year]
Location
[Country, City]
Sample sizeStudy designSettingSampleTest under evaluation
[Type, Brand]
Reference test
[Type, Brand]
Ansari, 2007Iran, Urumieh240CCHospital patientsSRDT, ACON
RDT, Atlas
RDT, Blue Cross
RDT, Cortez
RDT, DIMA
RDT, Intec
qPCR
Khadem-Ansari, 2014Iran, Urumieh350CC – CSQHospital patients-referred as? HBVSChLIA, LiaisonRt-PCR
Lukhwareni, 2009South Africa192CCHIV cohort-pre ARTSChLIA, ElecsysqPCR
Mphahlele, 2006South Africa167 (HIV+)
128 (HIV)
CCHIV cohortSEIA, AxSYMNested PCR
Nna, 2014Nigeria113CSBlood donors (repeat)PRDT, ACONNested PCR; qPCR for positive
Olinger, 2007Nigeria, Ibadan200CSHospital patients-liver disease, HIVSMEIA, AxSYM v2
ChLIA, Elecsys
ELFA, VIDAS Ultra
rtPCR and nested PCR
Seremba, 2010Uganda74 (HIV-)
83 (HIV+)
CS – CSQHospital patients-ED, including HIVSRDT, Cortez
EIA, ADVIA
PCR

qPCR: quantitative PCR; rtPCR: realtime PCR; ChLIA: chemiluminescent immunoassay; CMIA: chemiluminescent microparticle enzyme immunoassay; ECLIA: electrochemiluminescent immunoassay; EIA: enzyme immunoassay; ELFA: enzyme-linked fluorescent assay; ELISA: enzyme-linked immunosorbent assay; MEIA: microparticle enzyme immunoassay; RDT: rapid diagnostic test; rtPCR: real-time PCR; CC: case–control; CS: cross-sectional; CSQ: consecutive patients; LB: lab-based study

Table 9Summary pooled diagnostic accuracy of HBsAg assays compared to NAT reference

Test typeNAT reference
Sen (95% CI)Spec (95% CI)
RDT93.3 (91.3−94.9)98.1 (97.0−98.9)
EIA75.7 (72.1−79.1)86.1 (83.8−88.2)

*Sen: sensitivity; Spec: specificity; Cl: confidence interval; RDT: rapid diagnostic test; EIA: enzyme immunoassay

Table 10Summary pooled diagnostic accuracy of HBsAg assays

Test typeHIV statusNAT reference
n Sen (95% CI)Spec (95% CI)
RDTHIV+137.5 (22.7−54.2)97.7 (87.7−99.9)
HIV257.1 (41.0−72.3)97.2 (93.1−99.2)
EIAHIV+357.9 (49.8−65.6)95.8 (92.7−97.8)
HIV283.3 (69.8−92.5)85.7 (79.2−90.8)
Fig. 5. Forest plots, RDT vs NAT, ordered by [Test, Author].

Fig. 5Forest plots, RDT vs NAT, ordered by [Test, Author]

Key – Types of RDT and reference standards used in studies

StudyTest brand (manufacturer)Reference test type, brand (manufacturer)
Ansari ACON (Aeon laboratories)

Atlas (William James House)

Blue Cross (Blue Cross Inc.)

Cortez (Cortez diagnostics)

DIMA (Geseeschaft fur Diagnostika mbH)

Intex (Intec Products Inc.)
QPCR

Roto-GENE 3000 Research (Corbet real time PCR) and kit artus (Hamburg)
Nna ACON (Aeon laboratories)Nested PCR

QPCR for positive
Seremba Cortez (Cortez diagnostics)b-DNA (Versant);

PCR, Amplicor for discrepant
Fig. 6. Forest plots, EIA vs NAT, ordered by [Test, Author].

Fig. 6Forest plots, EIA vs NAT, ordered by [Test, Author]

Key – Types of EIA and reference standards used in studies

StudyTest type, brand (manufacturer)Reference test type, brand (manufacturer)
Seremba EIA, ADVIA Centaur (Siemens)b-DNA (Versant);
PCR, Amplicor for discrepant
Mphahlele EIA, AxSym (Abbott)Nested PCR (in house);
positive quantified with COBAS Amplicor ()
Olinger MEIA, AxSym v2 (Abbott)
ELFA, VIDAS Ultra (Biomérieux)
ChLIA, Elecsys (Roche)
RT-PCR
Lukhwareni ChLIA, Elecsys (Roche)Nested PCR, High Pure Viral Nucleic Acid assay (Roche)
Q-PCR, COBAS TaqMan HBV Test 48 assay ()
Khadem-Ansari ChLIA, Liasison (Diasorin)RT-PCR, Robogene (Corbett)

Summary Receiver Operating Characteristic (SROC) curves

Fig. 7. SROC curves for studies comparing RDTs with EIAs.

Fig. 7SROC curves for studies comparing RDTs with EIAs

Fig. 8. SROC curves for studies comparing RDTs with NATs.

Fig. 8SROC curves for studies comparing RDTs with NATs

Fig. 9. SROC curves for studies comparing EIAs with EIAs.

Fig. 9SROC curves for studies comparing EIAs with EIAs

Fig. 10. SROC curves for studies comparing EIAs with NAT.

Fig. 10SROC curves for studies comparing EIAs with NAT

Forest plots of sub-analyses

Forest plots, analysed by HIV status

Fig. 11. Forest plots of RDTs vs EIAs in HIV-positive patients.

Fig. 11Forest plots of RDTs vs EIAs in HIV-positive patients

Fig. 13. Forest plots, RDTs vs EIAs in HIV-negative patients.

Fig. 13Forest plots, RDTs vs EIAs in HIV-negative patients

Fig. 14. Forest plots, EIAs vs EIAs in HIV-positive patients.

Fig. 14Forest plots, EIAs vs EIAs in HIV-positive patients

Fig. 15. Forest plots, EIAs vs NAT in HIV-positive patients.

Fig. 15Forest plots, EIAs vs NAT in HIV-positive patients

Fig. 16. Forest plots, EIAs vs NAT in HIV-negative patients.

Fig. 16Forest plots, EIAs vs NAT in HIV-negative patients

Fig. 17. Forest plots, RDTs vs NAT in HIV-negative patients.

Fig. 17Forest plots, RDTs vs NAT in HIV-negative patients

Forest plots, analysed by sample type

Fig. 18. Forest plots, RDTs vs EIA in whole blood.

Fig. 18Forest plots, RDTs vs EIA in whole blood

Forest plots, analysed by study design

Fig. 19. Forest plots, RDTs vs EIA in case–control studies.

Fig. 19Forest plots, RDTs vs EIA in case–control studies

9.3.4. Forest plots, analysed by study setting
Fig. 20. Forest plots, RDTs vs EIA in blood donors.

Fig. 20Forest plots, RDTs vs EIA in blood donors

Forest plots, analysed by study year

Fig. 21. Forest plots, RDTs vs EIA for studies after 2005.

Fig. 21Forest plots, RDTs vs EIA for studies after 2005

Fig. 22. Forest plots, RDTs vs EIA for studies before 2005.

Fig. 22Forest plots, RDTs vs EIA for studies before 2005

9.5. List of tests available

ManufacturerTestTest type
AbbottAxSym HBsAg v2MEIA
AbbottArchitect HBsAgCMIA (Quant)
AbbottArchitect HBsAg QualitativeCMIA
AbbottArchitect HBsAg Qualitative IICMIA
AbbottAuszyme Monoclonal
AbbottPRISM HBsAgChLIA
AdaltisElAgen HBsAg KitEIA
SiemensADVIA Centaur HBsAgChLIA
SiemensADVIA Centaur HBsAg IIChLIA
BIOKITBioelisa HBsAg 3.0
bioMerieuxHepanostika Uni-Form IIMicroelisa
bioMerieuxVIKIA HBsAg Kit
bioMerieuxVIDAS HBsAgELFA
bioMerieuxVIDAS HBsAg UltraELFA
BIO-RADGenscreen HBsAg 3.0
BIO-RADMONOLISA HBsAg UltraEIA/ELISA
BIO-RADMONOLISA HBsAg PlusEIA
BIO-RADMONOLISA AgHBs (2nd Gen)
Dade BehringEnzygnost HBsAg EIA 5.0EIA
Dade BehringEnzygnost HBsAg EIA 6.0EIA
DiasorinETI-MAK 4 HBsAg EIAEIA -? not available
Diasorin (prev Abbott)Murex HBsAg Version 3ELISA
DiasorinLiason HBsAgChLIA
DiasorinLiason XL MUREX HBsAgChLIA (Quant)
General Biologicals Corp.SURASE B-96, TMBELISA
MBS SRL Medical Biological ServicesHBsAg One StepELISA
OrthoHBsAg ELISA Test System 3
OrthoVitros ECi HBsAg
RocheCobas Core HBsAg IIEIA
RocheElecsys HBsAgECLIA
RocheElecsys II HBsAgECLIA
Siemens Medical Solutions DiagnosticsImmulite 2000 HBsAgELISA
Beijing Wantai Biological Pharmacy Enterprise Co., LtdHepatitis B Virus Surface Antigen (HBsAg) ELISAELISA

Footnotes

1

Unless otherwise specified, sensitivity and specificity refer to clinical and not analytical sensitivity for tests.

2

For convenience we shall refer to all laboratory-based immunoassays for HBsAg detection (ELISA, MEIA, ECLIA, CMIA) as EIAs as most have some form of enzymatic amplification.

3

Abbreviated names for table clarity – full product names in Annex

4

Studies refers to either entire articles or individual sub-studies within a single publication using different patients, methods, index tests or reference standard.

5

REM: Random effects model

6

Three studies on ART-naive patients (Hoffman, Davies, Franzeck); two studies from single article (Geretti) in patients who included 1/3 on lamivudine; with one study (Honge) on a mixture

Annex 5.4. PICO 2 - How to test (HCV)
Diagnostic accuracy of tests to detect hepatitis C antibody: a meta-analysis and review of the literature

Authors

Team lead: , MD, PhD,* , PhD,* , MBBS, , MPH, , MS, , MD, and , PhD. , MBBS and , MD, PhD.

Affiliations

1 London School of Hygiene and Tropical Medicine team
2 London School of Hygiene and Tropical Medicine team
* Co-leaders of this review

1. Executive summary

Background: Although direct acting antivirals (DAAs) have led to sustained virological response in greater than 90% of all individuals treated for hepatitis C virus (HCV), most HCV-infected individuals remain undiagnosed and untreated. Enzyme immunoassays have been used to detect exposure to HCV but access to these laboratory-based assays has been a barrier in reaching at-risk populations for testing and treatment. Rapid diagnostic tests (RDTs) to detect HCV antibody (HCV Ab) are commercially available and may be useful in decentralizing HCV screening outside of laboratory settings. The purpose of this work was to review the peer-reviewed literature and determine the diagnostic accuracy of available assays in detecting antibodies to HCV as a biomarker of exposure.

Method: We used the PRISMA guidelines and Cochrane guidance to develop our search protocol. The search strategy was registered in PROSPERO (CRD42015023567). A literature search was conducted focused on hepatitis C, diagnostic tests and diagnostic accuracy among eight databases. Studies were included if they evaluated an assay to determine the sensitivity and specificity of HCV Ab in humans. Reference standards included enzyme immunoassay (EIA), immunoblot (e.g. recombinant immunoblot assay), and/or nucleic acid testing (NAT). Two reviewers independently extracted data and performed a quality assessment of the studies using the QUADAS tool.

Results: A total of 52 studies were included that included 52 273 unique test measurements. Based on five studies, the pooled RDT sensitivity and specificity were 0.98 (95% CI 0.98–1.00) and 1.00 (95% CI 1.00–1.00) compared to an EIA reference standard. High HCV Ab RDT sensitivity and specificity were observed across screening populations (general population, key populations, hospital patients) using different reference standards (EIA, NAT, immunoblot). Limiting the RDT analysis to studies published in the past five or ten years did not change the results. There were insufficient studies to undertake subanalyses based on HIV coinfection. Oral HCV Ab RDTs had excellent sensitivity and specificity compared to blood reference tests, respectively, at 0.94 (95% CI 0.93–0.96) and 1.00 (95% CI 1.00–1.00). Among studies that assessed individual oral RDT tests, the eight studies that examine OraQuick ADVANCE® had a slightly higher sensitivity (0.98, 95% CI 0.97–0.98) compared to the six studies that examined other brands and found a pooled sensitivity of 0.88 (95% CI 0.84–0.92).

Conclusions: RDTs, including oral tests, have excellent sensitivity and specificity compared to laboratory-based methods for HCV antibody detection across a wide range of settings. Although the sensitivity of the HCV Ab RDT decreases in low- and middle-income country (LMIC) contexts, this would still be an important public health tool for screening purposes. Oral HCV Ab RDTs had good sensitivity and specificity compared to blood reference standards and may be particularly useful in contexts where the use of blood-based tests may be challenging.

2. Background

Hepatitis C is a liver disease caused by the hepatitis C virus (HCV) that causes acute and chronic infection.1,2 An estimated 130–150 million people have chronic hepatitis C infection worldwide, leading to 350 000–500 000 deaths per year.14 The introduction of direct-acting antivirals (DAAs) has led to sustained virological response (SVR) in more than 90% of all HCV-infected individuals.5,6 DAAs are now recommended by WHO and many other HCV treatment guidelines.1 DAAs will not only improve SVR rates, but also may simplify HCV management algorithms and allow smaller health facilities to manage HCV-infected individuals.7 Despite the availability of effective treatment, most HCV-infected individuals remain undiagnosed and untreated.4 As a result, approximately 15–30% of individuals with chronic HCV infection progress to cirrhosis, leading to end-stage liver disease and hepatocellular carcinoma.1,2

In April 2014, WHO published the guidelines for the screening, care and treatment of individuals with HCV infection.8 These guidelines included recommendations on who to screen for HCV and how to confirm HCV infection, but not which tests are optimal for initial screening. The World Health Assembly has passed several resolutions highlighting the importance of prevention and control of viral hepatitis for global health.

Advances in HCV detection technology create new opportunities for enhancing screening, referral, and treatment. Previous systematic reviews on hepatitis C infection have focused on treatment response,9,10 clinical complications11 and epidemiology.12,13 Two systematic reviews on hepatitis C testing focused on evaluating point-of-care (POC) tests compared to EIAs and other reference tests.14,15 This review extends previous reviews by including new studies, including a subanalysis focused on oral tests, and including studies that evaluated immunoassays using a NAT reference standard.

3. Objectives

The purpose of this review was to identify quantitative evidence on the sensitivity and specificity of rapid diagnostic tests used to detect HCV Ab, synthesize the evidence, and inform models to estimate cost–effectiveness of different strategies for testing.

PICO 2Among persons identified for hepatitis C testing, what is the diagnostic accuracy of available assays for detecting HCVAb?
PPersons identified for HCV testing
IRapid diagnostic tests and enzyme immunoassays for HCsAg detection
C
1)

EIA (with subanalysis based on the last ten years)

2)

NAT (nucleic acid testing)

3)

Immunoblot or similar assay

4)

A combination of 1,2,3 above

ODiagnostic accuracy (Sensitivity, Specificity, Positive predictive value, Negative predictive value, TN, TP, FN, and FP).

4. Methods

Search strategy and identification of studies

We included observational and randomized control trial (RCT) studies that provide original data from patient specimens from cross-sectional or case–control studies. Literature search strategies were developed by a medical librarian with expertise in designing systematic review searches. Our search algorithm consisted of the following components: hepatitis C, diagnostic tests, and diagnostic accuracy (see annex 1). We searched MEDLINE (OVID interface, 1946 onwards), EMBASE (OVID interface, 1947 onwards), the Cochrane Central Register of Controlled Trials (Wiley interface, current issue), Science Citation Index Expanded (Web of Science interface, 1970 onwards), Conference Proceedings Citation Index-Science (Web of Science interface, 1990 onwards), SCOPUS (1960 onwards), Literatura Latino-Americana e do Caribe em Ciências da Saúde (LILACS) (BIREME interface) and WHO Global Index Medicus. The search was supplemented by searching for ongoing studies in WHO’s International Clinical Trials Registry. The literature search was limited to the English language and human subjects. In addition to searching databases, we contacted individual researchers and authors of major trials to address whether any relevant manuscripts are in preparation or in press. The references of published articles found in the above databases were searched for additional pertinent materials.

Study selection proceeded in three stages: (1) titles/abstracts were screened by a single reviewer according to standard inclusion and exclusion criteria; (2) full manuscripts were obtained and assessed against inclusion criteria. Papers were accepted or rejected and reasons for rejection were specified; (3) two independent reviewers assessed each manuscript. Differences were resolved by a third independent reviewer.

Selection criteria

The inclusion criteria included the following: primary purpose is HCV Ab test evaluation, reported sensitivity and specificity of HCV Ab test kits, and studies published before May 2015. Studies that only reported sensitivity or specificity, conference abstracts, comments or review papers, panel studies, and studies that only used reference assay for positive samples were excluded.

Data extraction

Information on the following variables were extracted from each individual study: first author, total sample size, country (and city) of sampling, sample type (oral fluid, finger-prick, venous blood, etc.), POC (defined as being able to give a result within 60 minutes and having the results to guide clinical management in the same encounter), eligibility criteria, reference standard, manufacturer, raw cell numbers (true positives, false negatives, false positives, true negatives), antibody–antigen combo (yes or no), sources of funding, reported conflicts of interest.

Assessment of methodological quality

Study quality was evaluated using the QUADAS-2 tool16 and the STARD checklist.17 QUADAS includes domains to evaluate bias in the following categories: risk of bias (patient selection, index test, reference standard, flow and timing); applicability concerns (patient selection, index test, reference standard).

Data analysis and synthesis

Data synthesis

Data were extracted to construct 2 × 2 tables. According to the test results of reference standard, anti-HCV positive and negative were defined. By comparing with reference standard results, the index test results were categorized as a true positive, a false positive, a false negative, or a true negative. Indeterminate test results were not included in pooled analyses.

Statistical analysis

To estimate test accuracy, we calculated sensitivity and specificity for each study and pooled statistics, along with 95% confidence intervals (CIs). We pooled test estimates using the DerSimonian–Laird method, a bivariate random effect model. We did further sub-analysis based on reference standard (EIA alone; NAT or immunoblot; EIA, NAT, or immunoblot), brand, and combination test. We performed all statistical analysis (including heterogeneity) using the software R and RevMan 5.3.

5. Results

Study selection

A total of 11 163 citations were identified and 6163 duplicates were removed. Each of the 5000 titles was examined. A total of 52 research studies were included in the final analysis (Fig. 1 below).8,1868 Of the 52 studies, 32 studies evaluated the accuracy of 30 different RDTs, of which 5 evaluated RDTs compared to EIA alone, 13 compared RDT results to NAT or immunoblot, and 15 focused on evaluating RDT by comparing with the results of EIA or immunoblot or NAT. Twelve studies evaluated the diagnostic accuracy of oral fluid RDTs.

There were insufficient data to undertake a subanalysis based on HIV coinfection or other coinfections.

Fig. 1. PRISMA flow diagram outlining study selection examining diagnostic accuracy of HCV antibody tests.

Fig. 1PRISMA flow diagram outlining study selection examining diagnostic accuracy of HCV antibody tests

Study characteristics

Of the 52 included studies, 9 were published before 2010, 12 reported evaluation using oral fluid samples, and 34 were reported performance of POC tests (Table 1). Of the 52 studies, 41 different brands of testing kits were evaluated (Table 1).

Table 1Characteristics of studies focused on evaluating diagnostic accuracy of HCV antibody tests

First authorYearSettingsSample typeManufacturerStudy typeSample sizePOC (Y/N)Reference standard
Al-Tahish et al.2013EgyptVenous bloodHCV one step test device (ACON Laboratories, USA), Fourth-generation HCV TRI_DOT (J. Mitra Co, India) and ImmunoComb II HCV (Inverness Medical Innovations, USA)Cross-sectional100YPCR
Bonacini et al.2001USAVenous bloodOrtho Clinical Diagnostics (Raritan, NJ, USA)Cross-sectional222NChiron Immunoblot HCV 3.0 SIA
Buti et al.2000SpainSerumNot availableCross-sectional188YImmunoblot
Caudai et al.1998USASerum or plasma samplesELISA 2nd generation Abbott Laboratories, Abbott park, IL, USA)Cross-sectional682NPCR
Cha et al.2013KoreaOral fluids and serumOraQuick (OraSure Technologies, PA USA)Case–control437YPCR
Croom et al2006AustriaVenous bloodMonolisa anti-HCV PLUSVersion 2 EIA (Bio-Rad, France)Cross-sectional182NEIA
da Rosa et al.2013BrazilSerumRapid Test Bioeasy® (Standard Diagnostics, Yongin, Korea) and Imuno-Rapido HCV® (Wama Diagnostica, São Carlos, Brazil).Cross-sectional307YArchitect HCV, PCR
Daniel et al.2005IndiaSerumTRI DOT (J. MITRA &Co. Ltd., New Delhi, India)Cross-sectional2590YEIA, Immunoblot, PCR
Denoyel et al.2004France and GermanySerum or plasma samplesAxSYM HCV 3.0 (other information is not available)Cross-sectional5700NImmunoblot
Dokubo et al.2014USABloodHCV Version 3.0 ELISA (Ortho®)Cross-sectional132NPCR
Drobnik et al.2011USAOral fluidOraQuick (OraSure Technologies, PA USA)Cross-sectional484YEIA, Immunoblot
Eroglu et al.2000TurkeyPlasma specimensELISA v3.0(Ortho®)Cross-sectional160NPCR
Feucht et al.1995GermanyPlasma specimensAbbott HCV second-generation enzyme immunoassay (other information is not available)Cross-sectional262NImmunoblot
Gao et al.2014USASerumOraQuick (OraSure Technologies, PA USA)Cross-sectional289YEIA
Hess et al.2014USAWhole bloodDPP HIV-HCV-Syphilis Assay (Chembio Diagnostic Systems, Inc., Medford, NY)Cross-sectional948YEIA
Hui et al.2002Hong Kong, ChinaWhole bloodOraQuick (OraSure Technologies, PA USA)Cross-sectional197YEIA
Ibrahim et al.2015Saudi ArabiaOral fluidOraQuick (OraSure Technologies, PA USA)Case–control160YPCR
Ivantes et al.2010BrazilWhole bloodHCV Rapid Test Bioeasy (Bioeasy Diagnostica Ltda, Minas Gerais, Brazil)Cross-sectional71YCLIA
Jewett et al.2012USAOral fluids and serumChembio DPP HCV test (Chembio Diagnostic Systems, USA) and Rapid HIV/HCV antibody test (Medmira Laboratories, Canada)Cross-sectional407YImmunoblot/NAT
Kant et al.2012GermanyWhole bloodToyo anti-HCV test (Turklab, Izmir, Turkey)Cross-sectional185YArchitect HCV
Kaur et al.2000IndiaSerumHCV Bidot (J. Mitra Co., India)Cross-sectional2754YEIA 3rd generation
Kim et al.2013Republic of KoreaSerumGENEDIA® HCV Rapid LF (Green Cross medical science corp., Korea)Case–control200YImmunoblot
Kosack et al.2014GermanySerumThe ImmunoFlow HCV test (Core Diagnostics, United Kingdom)Cross-sectional81YImmunoblot
Lakshmi et al.2007IndiaBloodBeijing United Biomedical, Ortho Clinical Diagnostics, General Biologicals; other information is not avaliableCross-sectional69NPCR
Larrat et al.2012FranceFSB (finger-stick blood) and oral fluidcEIA: the Monolisa® HCV-Ag-Ab-ULTRA (Bio-Rad, Marnes-la-Coquette, France)Case–control201YPCR
Lee et al.2010USAOral fluid, whole bloodOraQuick (OraSure Technologies, PA USA)Cross-sectional572YEIA, Immunoblot
Lee et al.2011USASerum, plasma, venous blood, finger-stick blood and oral fluidOraQuick (OraSure Technologies, PA USA)Cross-sectional2183YEIA, Immunoblot, PCR
Lee et al.2011USAOral fluidOraQuick (OraSure Technologies, PA USA)Cross-sectional2180 or 2178YEIA
Maity et al.2012IndiaSerumJ Mitra & Co. Pvt Ltd, SPAN Diagnostics Ltd. and Standard Diagnostics, INC, other information is not availableCase–control100YEIA
Montebugnoil et al.1999ItalyWhole bloodAnti-HCV Ab rapid test (1st IRP 75/537 by Thema Ricerca, WHO Geneva)Case–control100YEIA, Immunoblot
Mvere et al.1996ZimbabweSerumHCV-SPOT (Genelabs Diagnostics, Singapore)Cross-sectional206YEIA 2nd generation, INNO-LIA HCV Ab III
Nalpas et al.1992FranceSerumOrtho Diagnostics, other information is not availableCross-sectional62NPCR
Njouom et al.2006CameroonPlasmaImmunoComb® II HCV assay (Orgenics Ltd, Not reported manufacturer located country); ImmunoComb® II HCV assay (Orgenics Ltd, Not reported manufacturer located country)Cross-sectional329YEIA 3rd generation, PCR
Nyirenda et al.2008MalawiSerumMonoelisa HCV Ag/Ab ultra microplate EIA (Bio-Rad, France)Cross-sectional202YEIA
O’Connell et al.2013USAPlasma, whole blood (normal) and whole blood (cold storge)OraQuick (OraSure Technologies, PA USA); CORE (CORE Diagnostics, United Kingdom); Axiom (Axiom Diagnostics, Burstadt, Germany); FirstVue (AT First Diagnostic, Woodbury, NY, USA) and Instant View Cassette (Alfa Scientific Designs, Poway)Case–control674 or 168YEIA, Immunoblot, and when available viral load)
O’Flynn et al.1997Ireland, Germany, UKPlasma and serumAxSYM (Abbott laboratories, other information is not available)Case–control5554, 1421 or 643NABBOTT MATRIX HCV, Chiron Immunoblot HCV 2.0 or 3.0
Park et al.2012KoreaSerumVitros anti-HCV assay kits (Ortho-Clinical Diagnostics, Buckinghamshire, UK) and Elecsys (Roche Diagnostics GmbHMannheim, Germany)Cross-sectional1008NImmunoblot HCV 3.0 and Cobas Ampliprep/Taqman HCV RNA
Poovorawari et al.1994ThailandSerumHCV-SPOT assay (Genelabs Diagnostics Pty Ltd, Singapore)Cross-sectional192YEIA 2nd generation or Immunoblot
Prayson et al.1993USASerumC100-3 HCV EIA (Abbott laboratories, other information is not available)Cross-sectional123NImmunoblot 2.0
Rihn et al.2000FranceSerumMATRIX hcv2 (Abbott laboratories, other information is not available)Cross-sectional146NPCR
Scalioni Lde et al.2014BrazilSerum, whole blood and oral fluidWAMA Imuno-Rápido HCV Kit (WAMA Diagnóstica, Brazil); Bioeasy HCV Rapid Test, (Bioeasy Diagnóstica Ltd, Brazil) and OraQuick (OraSure Technologies, PA USA)Cross-sectional194 or 172YPCR
Smith et al.2011USAWhole blood, oral fluidMultiplo Rapid HIV/HCV Antibody Test (MedMira, Canada); Chembio DPP HCV test (Chembio Diagnostic Systems, USA) and OraQuick (OraSure Technologies, PA USA)Cross-sectional476, 385, 432, 549 or 266YMEIA/EIA/CLIA, Immunoblot
Smith et al.2011USAOral fluid and bloodMultiplo Rapid HIV/HCV Antibody Test (MedMira, Canada); Chembio DPP HCV test (Chembio Diagnostic Systems, USA)Cross-sectional1081YChiron Immunoblot HCV 3.0 SIA; Bayer Advia Centaur HCV Chemiluminescent immunoassay
Sommese et al.2014ItalyBloodCMIA assays (Abbott Diagnostics, Wiesbaden, Germany)Cross-sectional17894NINNO-LIA (Innogenetics, Ghent, Belgium), NAT
Tagny et al.2014CameronPlasmaHCV Ag/Ab combination assay (Monolisa HCV Ag-Ab Ultra, BioRad, Marnes La Coquette, France)Cross-sectional1998YEIA
Vrielink et al.1996NetherlandsBloodAbbott HCV EIA 3.0 (Abbott laboratories, Murex anti-HCV VK47 (Murex Diagnostic) and Ortho HCV 3.0 elisa (Ortho Diagnostic Systems; other information is not avaliableCross-sectional403, 212, 253 03 1055NPCR
Vrielink et al.1995NetherlandsBloodMonolisa anti-HCV new antigens (Sanofi Diagnostics Pasteur), Abbott HCV EIA 3.0 (Abbott laboratories); other information is not availableCross-sectional403, 212, 253NPCR
Yang et al.2011ChinaSerumAxSYM HCV 3.0 (Abbott Laboratories), Murex Ag/Ab test (Abbott Laboratories); other information is not availableCase–control101 or 100NHCV RNA test (COBAS AMPLICOR Hepatitis C Virus Test, version 2.0
Yang et al.2013ChinaSerumElecsys anti-HCV II (Roche Diagnostics GmbH), Architect anti-HCV (Abbott) and Vitros anti-HCV(Ortho-Clinical Diagnostics), other information is not availableCross-sectional859 or 167NIMMUNOBLOT 3.0 test or the Realtime HCV RNA assay
Yarri et al.2006IsraelSerum and oral fluidImmunoComb II HCV (Inverness Medical Innovations, USA)Cross-sectional37YPCR
Yoo et al.2015South Korea; China; China/Taiwan; Thailand; Australia; Malaysia; IndonesiaSerumElecsys® Anti-HCV II assay (Roche Diagnostics GmbH, other information is not avaliable)Cross-sectional7726Y1 or more of the following comparator assays at 9 centers: ARCHITECTTM Anti-HCV; Serodia®-HCV Particle Agglutination; Vitros® ECi Anti-HCV; Elecsys® Anti-HCV; ADVIA Centaur® HCV; InTec® HCV EIA; or Livzon® Anti-HCV.
Yuen et al.2001ChinaSerumSM-HCV Rapid Test (SERO-Med Laborspezialita¨ten GmbH, Eichsta ¨tt, Germany)Case–control290YEIA, PCR

Assessment of the quality of the studies

All studies used cross-sectional or case–control design. Risk of bias in patient selection, index test, or reference standard was assessed using QUADAS-2 (Table 2). Among the included studies, 21 have at least one category that was considered high risk. Risk of bias in patient selection usually came from a poor description of patient selection and clinical scenario. Bias in the index test was primarily due to a lack of reported blinding while reading test results. Bias in the reference standard was due to the use of multiple reference standards (EIA, NAT, and/or immunoblot). Bias in the flow and timing was primarily due to a lack of reported details.

Table 2Quality assessment by QUADAS-2 of the included studies

ReportsBias assessment/Risk of biasAcceptability concerns
Patient selectionIndex testReference standardFlow and timingPatient selectionIndex testReference standard
Al-Tahish et al.2013UCLRLRLRLRLRLR
Bonacini et al.2001HRLRLRLRLRLRLR
Buti et al.2000UCUCLRLRHRLRLR
Caudai et al.1998HRLRLRLRUCLRLR
Cha et al.2013HRLRLRLRUCLRLR
Croom et al.2006LRLRLRUCLRLRLR
da Rosa et al.2013HRUCLRLRHRUCLR
Daniel et al.2005LRLRLRLRLRLRLR
Denoyel et al.2004UCLRLRLRUCLRHR
Drobnik et al.2011LRUCLRUCLRUCLR
Eroglu et al.2000LRLRLRLRLRLRLR
Feucht et al.1995HRLRLRLRHRLRLR
Gao et al.2014LRLRLRHRLRLRLR
Hess et al.2014LRHRLRLRLRHRLR
Hui et al.2002HRLRHRLRHRLRHR
Ivantes et al.2010LRUCHRLRLRLRHR
Jewett et al.2012LRLRLRLRLRLRLR
Dokuboa et al.2014UCLRLRLRUCLRLR
Kant et al.2012HRUCHRLRHRUCHR
Kaur et al.2000LRUCHRLRLRLRLR
Kim et al.2013UCLRLRLRUCLRLR
Kosack et al.2014HRLRLRLRHRLRLR
Lakshmi et al.2007UCLRLRUCHRLRLR
Larrat et al.2012LRLRLRLRLRLRLR
Lee et al.2010LRUCLRLRLRUCLR
Lee et al.2011HRUCLRLRLRLRLR
Maity et al.2012HRUCHRLRHRUCHR
Montebugnoil et al.1999HRLRLRLRHRLRLR
Mvere et al.1996HRLRLRLRHRLRLR
Nalpas et al.1992HRLRLRUCHRLRLR
Njouom et al.2006HRUCLRLRHRUCLR
Nyirenda et al.2008LRUCLRLRLRLRLR
O’Connell et al.2013HRLRHRLRHRLRLR
O’Flynn et al.1997UCLRLRUCLRLRLR
Park et al.2012UCLRLRUCLRLRLR
Poovorawari et al.1994LRUCLRLRLRLRLR
Prayson et al.1993UCLRLRUCUCLRLR
Rihn et al.2000UCLRLRUCUCLRLR
Scalioni et al.2014UCLRLRUCUCLRLR
Smith et al.2011LRLRLRLRLRLRLR
Smith et al.2011HRLRLRLRHRLRLR
Sommese et al.2014LRLRLRLRLRLRLR
Lee et al.2010_2LRLRLRLRLRLRLR
Ibrahim et al.2015HRLRLRLRHRLRLR
Tagny et al.2014LRUCHRLRLRUCHR
Vrielink et al.1995UCLRLRLRUCLRLR
Vrielink et al.1995_2UCLRLRLRHRLRLR
Yang et al.2011UCLRLRLRUCLRLR
Yang et al.2013LRLRLRUCLRLRLR
Yarri et al.2006HRLRLRLRHRLRLR
Yoo2015UCLRLRHRUCLRLR
Yuen et al.2001HRLRLRLRHRLRLR

LR: low risk; HR: high risk; UC: unclear risk

Diagnostic accuracy

Overall clinical performance of assays

The 52 included studies contributed 127 data points from 52 273 unique test measurements. Some studies contributed additional data points by comparing the accuracy of two or more tests, reporting data from multiple study sites, or reporting the accuracy of a test in more than one type of specimen. The sample sizes of the included studies ranged from 37 to 17 894. Sensitivities of included studies ranged from 0.22 to 1.00, and specificities ranged from 0.77 to 1.00. The overall pooled sensitivity and specificity for all tests were 0.97 (95% CI: 0.97–0.98) and 0.99 (95% CI: 0.98–0.99), respectively. Figure 2 show estimates of sensitivity and specificity from each study.

Fig. 2. Sensitivity and specificity of HCV Ab tests included in the review (n=52).

Fig. 2Sensitivity and specificity of HCV Ab tests included in the review (n=52)

Manufacturers and accuracy of RDTs among included studies

Overall, 32 studies evaluated the accuracy of 30 different RDTs (Table 3). The most commonly evaluated test kit was the OraQuick ADVANCE® from OraSure Technologies.

An Ag–Ab test by BioRad and a combo HIV-HCV test by MedMira were among the tests evaluated.

Table 3Manufacturers and accuracy of RDTs among included studies

First authorManufacturerSample sizeTPFPTNFNSESP
Montbugnoil et al.Anti-HCV Ab rapid test (1st IRP 75/537 by Thema Ricerca, WHO Geneva)1005014901.000.98
O’Connell. et al.Axiom (Axiom Diagnostics, Burstadt, Germany)6743261032990.970.97
O’Connell et al.Axiom (Axiom Diagnostics, Burstadt, Germany)1687728270.920.98
O’Connell et al.Axiom (Axiom Diagnostics, Burstadt, Germany)1688257920.980.94
Scalioni Lde, et al.Bioeasy HCV Rapid Test, (Bioeasy Diagnóstica Ltd, Brazil)19413704890.941.00
Scalioni Lde et al.Bioeasy HCV Rapid Test (Bioeasy Diagnóstica Ltd, Brazil)194111048350.761.00
Scalioni Lde et al.Bioeasy HCV Rapid Test (Bioeasy Diagnóstica Ltd, Brazil)194136048100.931.00
Jewett et al.Chembio DPP HCV Test (Chembio Diagnostic Systems, USA)407101329080.930.99
Jewett et al.Chembio DPP HCV test (Chembio Diagnostic Systems, USA)400883294150.850.99
Smith et al.Chembio DPP HCV test (Chembio Diagnostic Systems, USA)47630812125320.910.91
Smith et al.Chembio DPP HCV test (Chembio Diagnostic Systems, USA)3852643101170.940.97
Smith et al.Chembio DPP HCV test (Chembio Diagnostic Systems, USA)10815251543120.981.00
O’Connell et al.CORE (CORE Diagnostics, United Kingdom)16829183550.350.99
O’Connell, et al.CORE (CORE Diagnostics, United Kingdom)16824282600.290.98
O’Connell et al.CORE (CORE Diagnostics, United Kingdom)6743237332120.960.98
Maity et al.Diagnostics Ltd (other information is not available)300132016801.001.00
O’Connell et al.FirstVue (AT First Diagnostic, Woodbury, NY, USA)16866084180.791.00
O’Connell et al.FirstVue (AT First Diagnostic, Woodbury, NY, USA)16854183300.640.99
O’Connell et al.FirstVue (AT First Diagnostic, Woodbury, NY, USA)6743123336230.930.99
Al-Tahish et al.Fourth-generation HCV TRI_DOT (J. Mitra Co, India)10034155010.970.77
Daniel et al.Fourth-generation HCV TRI_DOT (J. Mitra Co, India)259013824242710.990.99
Kim, M. H. et al.GENEDIA® HCV Rapid LF (Green Cross medical science corp., Korea)10052034140.791.00
Kaur et al.HCV Bidot (J. Mitra Co., India)2754280272240.881.00
Al-Tahish et al.HCV one step test device (ACON Laboratories, USA)10034155010.970.77
Ivantes et al.HCV Rapid Test Bioeasy (Bioeasy Diagnostica Ltd, Brazil)713033801.000.93
da Rosa et al.HCV Rapid Test Bioeasy® (Standard Diagnostics, South Korea)307100020430.971.00
Poovoran et al.HCV-SPOT assay (Genelabs Diagnostics Pty Ltd, Singapore)192411113910.980.93
Mvere et al.HCV-SPOT assay (Genelabs Diagnostics Pty Ltd, Singapore)20610419110.910.98
Njouom et al.Hexagon® HCV (Not reported manufacturer located country)3291601715110.990.90
Al-Tahish et al.ImmunoComb II HCV (Inverness Medical Innovations, USA)10034145110.970.78
Yarri et al.ImmunoComb II HCV (Inverness Medical Innovations, USA)371841501.000.79
Yarri et al.ImmunoComb II HCV (Inverness Medical Innovations, USA)371811801.000.95
Njouom et al.ImmunoComb® II HCV assay (Orgenics Ltd, Not reported manufacturer located country)3291030168580.641.00
da Rosa et al.Imuno-Rapido HCV® (Wama Diagnostica, Brazil).307100020430.971.00
O’Connell et al.Instant View Cassette (Alfa Scientific Designs, Poway, CA, USA)6743213336140.960.99
O’Connell et al.Instant View Cassette (Alfa Scientific Designs, Poway, CA, USA)16868381160.810.96
O’Connell et al.Instant View Cassette (Alfa Scientific Designs, Poway, CA, USA)16846183380.550.99
Maity et al.J Mitra Co. India (other information is not available)300120017460.951.00
Jewett et al.Rapid HIV/HCV antibody test (Medmira Laboratories, Canada)374800274200.801.00
Nyirenda et al.Monoelisa HCV Ag/Ab Ultra microplate EIA (Bio-Rad, France)2022718670.220.96
Tagny et al.Monolisa HCV Ag-Ab Ultra, (BioRad, France)199826281929150.630.99
Smith et al.Multiplo Rapid HIV/HCV Antibody Test (MedMira, Canada)10814741543630.881.00
Smith et al.Multiplo Rapid HIV/HCV Antibody Test (MedMira, Canada)432303840810.790.83
Cha et al.OraQuick (OraSure Technologies, PA USA)437134030030.981.00
Lee et al.OraQuick (OraSure Technologies, PA USA)21837561142211.001.00
Lee et al.OraQuick (OraSure Technologies, PA USA)21837552142011.001.00
Lee et al.OraQuick (OraSure Technologies, PA USA)21837532142121.001.00
Lee et al.OraQuick (OraSure Technologies, PA USA)21837521142121.001.00
Lee et al.OraQuick (OraSure Technologies, PA USA)218373951418140.981.00
O’Connell et al.OraQuick (OraSure Technologies, PA USA)674333133820.991.00
O’Connell et al.OraQuick (OraSure Technologies, PA USA)1688318310.990.99
O’Connell et al.OraQuick (OraSure Technologies, PA USA)1688208420.981.00
Smith et al.OraQuick (OraSure Technologies, PA USA)5493758140260.940.95
Smith et al.OraQuick (OraSure Technologies, PA USA)26618817250.970.99
Lee et al.OraQuick (OraSure Technologies, PA USA)572122044910.991.00
Lee et al.OraQuick (OraSure Technologies, PA USA)572123044901.001.00
Lee et al.OraQuick (OraSure Technologies, PA USA)572123144801.001.00
Smith et al.OraQuick (OraSure Technologies, PA USA)1081533354140.990.99
Drobnik et al.OraQuick (OraSure Technologies, PA USA)48492338270.930.99
Lee et al.OraQuick (OraSure Technologies, PA USA)21807561142211.001.00
Lee et al.OraQuick (OraSure Technologies, PA USA)21787552142011.001.00
Lee et al.OraQuick (OraSure Technologies, PA USA)21787532142121.001.00
Lee et al.OraQuick (OraSure Technologies, PA USA)21767521142121.001.00
Lee et al.OraQuick (OraSure Technologies, PA USA)217673951418140.981.00
Gao et al.OraQuick (OraSure Technologies, PA USA)1156166113310.940.99
IbrahimOraQuick (OraSure Technologies, PA USA)16053010070.881.00
Scalioni Lde_2014OraQuick (OraSure Technologies, PA USA)172108050140.891.00
Hess et al.DPP HIV-HCV-Syphilis Assay (Chembio Diagnostic Systems, Inc., Medford, NY).9481526776140.920.99
Buti et al.Not available18813505030.981.00
Yuen et al.SM-HCV Rapid Test (SERO-Med Laborspezialita¨ten GmbH, Eichsta ¨tt, Germany)29098018930.971.00
Maity et al.SPAN Diagnostics, Indi, other information is not available300132016801.001.00
Kant et al.Toyo anti-HCV test (Turklab, Izmir, Turkey)18582129010.990.88
Kosack et al.The ImmunoFlow HCV test (Core Diagnostics, United Kingdom)825502601.001.00
Scalioni Lde et al.WAMA Imuno-Rápido HCV Kit (WAMA Diagnóstica, Brazil)194119345270.820.94
Scalioni Lde et al.WAMA Imuno-Rápido HCV Kit (WAMA Diagnóstica, Brazil)194134345120.920.94
Hui et al.Not reported19791088180.831.00
Pooled test accuracy for RDT versus EIA alone

Overall, five studies evaluated RDT compared to the EIA alone, with a total sample of 15 943. Of the five studies, sample sizes ranged from 197 to 2754, sensitivities ranged from 0.83 to 1.00, and specificities ranged from 0.99 to 1.00. The pooled sensitivity and specificity were 0.98 (95% CI 0.98–1.00) and 1.00 (95% CI 1.00–1.00), respectively, while heterogeneity was observed between the included studies (P<0.001) (Fig. 3, Table 4).

For the three studies that were conducted within past 10 years,8,31,42 the total sample size was 12 992, with pooled sensitivity and specificity of 0.99 (95% CI 0.99–1.00) and 1.00 (95% CI 1.00–1.00), respectively.

Fig. 3. Pooled test accuracy of HCV Ab RDTs compared to an EIA reference (5 studies).

Fig. 3Pooled test accuracy of HCV Ab RDTs compared to an EIA reference (5 studies)

RDT accuracy compared to NAT or immunoblot

Overall, 13 studies evaluated RDTs compared to NAT or immunoblot, with a total sample of 6 683. Among these studies, sample sizes ranged from 36 to 549, sensitivities ranged from 0.76 to 1.00, and specificities ranged from 0.77 to 1.00. The pooled sensitivity and specificity were 0.93 (95% CI 0.91–0.95) and 0.98 (95% CI 0.97–0.99), respectively, while heterogeneity was observed between the included studies (P<0.001) (Fig. 5, Table 4).

Fig. 5. Pooled test accuracy of HCV Ab RDTs compared to a NAT or immunoblot reference (n=13 studies).

Fig. 5Pooled test accuracy of HCV Ab RDTs compared to a NAT or immunoblot reference (n=13 studies)

RDT test accuracy compared to EIA, NAT or Immunoblot

Overall, 14 studies evaluated RDT by referencing to EIA with NAT and/or immunoblot, with a total sample of 42 212. Of the 14 studies, sample sizes ranged from 168 to 2754, sensitivities ranged from 0.29 to 1.00, and specificities ranged from 0.90 to 1.00. The pooled sensitivity and specificity were 0.97 (95% CI 0.96–0.98) and 1.00 (95% CI 1.00–1.00), respectively, while heterogeneity was observed between studies (P<0.001) (Fig. 4, Table 4).

Fig. 4. Pooled test accuracy of HCV Ab RDTs compared to EIA, NAT or immunoblot reference standards (n=14 studies).

Fig. 4Pooled test accuracy of HCV Ab RDTs compared to EIA, NAT or immunoblot reference standards (n=14 studies)

Pooled test accuracy for oral versus blood samples

EIAs using oral fluid samples

Overall, 12 studies compared the accuracy of EIAs using oral fluid samples to a blood sample as a reference, with a total sample size of 14 546. Of the 12 studies, sample sizes ranged from 37 to 2176, sensitivities ranged from 0.72 to 1.00, and specificities ranged from 0.91 to 1.00. The pooled sensitivity and specificity were 0.94 (95% CI 0.93–0.96) and 1.00 (95% CI 1.00–1.00), respectively. Heterogeneity was observed between the included studies (P<0.001) (Fig. 6, Table 4).

Fig. 6. Pooled test accuracy for oral HCV Ab RDTs compared to blood as a reference (n=12 studies).

Fig. 6Pooled test accuracy for oral HCV Ab RDTs compared to blood as a reference (n=12 studies)

Blood samples

Overall, 45 studies used blood samples for evaluations, with a total sample of 89 608. Sample sizes ranged from 37 to 17 894, sensitivities ranged from 0.29 to 1.00, and specificities ranged from 0.18 to 1.00. The pooled sensitivity and specificity were 0.98 (95% CI 0.97–0.98) and 0.98 (95% CI 0.98–0.98), respectively. Heterogeneity was observed between the included studies (P<0.001) (Fig. 7, Table 4).

Fig. 7. Pooled HCV Ab test accuracy for blood samples (n = 45 studies).

Fig. 7Pooled HCV Ab test accuracy for blood samples (n = 45 studies)

Pooled test accuracy for OraQuick versus other bands on Oral kits

OraQuick

Overall, eight studies reported sensitivity and specificity of OraQuick (OraSure Technologies, PA, USA), with a total sample of 9024. The sample size of these studies ranged from 172 to 2183, sensitivities ranged from 0.90 to 1.00, and specificities ranged from 0.95 to 1.00. The pooled sensitivity and specificity were 0.98 (95% CI 0.97–0.99) and 1.00 (95% CI 0.90–1.00), respectively. Heterogeneity was observed between the included studies (P<0.001) (Fig. 7, Table 4).

Fig. 8. Pooled test accuracy for HCV Ab OraQuick kits (n = 8 studies).

Fig. 8Pooled test accuracy for HCV Ab OraQuick kits (n = 8 studies)

Overall, six studies reported sensitivity and specificity for other three brands of oral kits, with a total sample of 6652. The sample size of these studies ranged from 37 to 1081, sensitivities ranged from 0.72 to 1.00, and specificities ranged from 0.91 to 1.00. The pooled sensitivity and specificity were 0.88 (95% CI 0.84–0.92) and 0.99 (95% CI 0.99–1.00), respectively, while heterogeneity was observed between the included studies (P<0.001) (Fig. 8, Table 4).

Figure 9. Pooled test accuracy for other brands of oral HCV Ab test kits (n = 6 studies).

Figure 9Pooled test accuracy for other brands of oral HCV Ab test kits (n = 6 studies)

Other findings

Our study further found that the overall sensitivity and specificity of studies conducted among general populations were 0.95 (95% CI 0.94–0.96) and 0.99 (95% CI 0.98–0.99), among key populations were 0.97 (95% CI 0.96–0.98) and 0.94 (95% CI 0.94–0.95), and among hospital patients were 0.97 (95% CI 0.96–0.98) and 1.00 (95% CI 1.00–1.00), respectively.

Table 4Pooled test accuracy for different testing strategies (n = 52 studies)

ComparisonPooled SE95%CITau-square P-value for heterogeneityPooled SP95% CITau-square P-value for heterogeneity
RDT versus EIA only (n = 5)0.990.981.00<0.0011.001.001.00<0.001
RDT versus NAT or Immunoblot (n = 13)0.930.910.95<0.0010.980.970.99<0.001
RDT versus EIA, NAT or Immunoblot (n = 14)0.970.960.98<0.0011.001.001.00<0.001
Oral RDT versus blood reference (n = 12)0.940.930.96<0.0011.001.001.00<0.001
Sample type
 Blood samples (n = 45)0.980.970.98<0.0010.980.980.99
 Oral samples (n = 12)0.940.930.96<0.0011.001.001.00<0.001
Source population
 General screening (n = 17)0.950.940.96<0.0010.990.980.99<0.001
 Key population (n = 19)0.970.960.98<0.0010.940.940.95<0.001
 Hospital patients (n = 16)0.970.960.98<0.0011.001.001.00<0.001
Antibody and antigen combo testing (n = 6)0.860.790.94<0.0010.990.981.00<0.001
Oral kits brand
 OraQuick (n = 8)0.980.970.99<0.0011.001.001.00<0.001
 Other brands (n = 6)0.880.840.92<0.0010.990.991.00<0.001

* Studies conducted in both LMICs and high-income countries were not included here

# Studies conducted across these regions were not included here.

SE: sensitivity; SP: specificity

GRADE

GRADE for RDT versus EIA

HCV Ab RDTs showed comparable sensitivity and specificity compared to that of EIAs. For the 5 studies evaluated RDT versus EIA, 15 943 of samples were evaluated, and moderate risk of bias was observed, and precision was present, while inconsistency was present for sensitivity, as the sensitivities of the included tests varied. But the consistency of specificity is observed. Since the unit of the analysis varied among studies (Table 4), indirectness was observed. In addition, the overall strength of the pooled evaluation was moderate, with pooled sensitivity and specificity of 0.99 (95% CI 0.98–1.00) and 1.00 (95% CI 1.00–1.00), respectively. Under the pre-test probability of 5%, the post-test probability after a positive test result is 97%, and the post-test probability after a negative test result is 100%.

GRADE for oral RDT versus blood reference

The use of oral RDT HCV Ab had comparable sensitivity and specificity compared to blood reference standards (Table 4). For the 12 studies evaluated oral RDT versus blood reference, 14 547 samples were evaluated. A moderate risk of bias was observed. Inconsistency present for sensitivity, as the sensitivities of the included studies varied. But the consistency of specificity was observed. Since the unit of the analysis varied with each other among the included studies (Table 4), indirectness was observed for included studies. In addition, the overall strength of the pooled evaluation was moderate, with pooled sensitivity and specificity of 0.94 (95% CI 0.93–0.96) and 1.00 (95% CI 1.00–1.00), respectively. Assuming a pre-test probability of 5%, the post-test probability after a positive test result was 94%, and the post-test probability after a negative test result was 100%.

Table 5GRADE table

RDT versus EIAOral RDT versus blood
Unit of analysisHospital patients, blood donors, injection drug users and other high-risk populationsGeneral population, hospital patients, blood donors, injection drug users and other highrisk population
Sample typeOral fluid serum or plasma
Studies, n512
Risk of biasModerate
ConsistencySe: Inconsistent Sp: Inconsistent
Directness/PrecisionIndirect/Precise
# of samples15 94314 547
Strength of evidenceSe: Moderate Sp: Moderate
Sensitivity (95% CI)0.99(0.98–1.00)0.94 (0.93–0.96)
Specificity (95%CI)1.00 (1.00–1.00)
Pretest probability (%)0.05
Positive LR (95% CI)618.5 (350.6–2493.2)314.5 (202.0–684.1)
PPV0.970.94
Negative LR (95% CI)0.01 (0.002–0.02)0.06 (0.04–0.07)
NPV1

6. Discussion

Acute HCV infection is usually asymptomatic, therefore there is an urgent need to increase screening for individuals who may be at increased risk. In this meta-analysis, we found HCV Ab RDTs, including those using oral fluid, showed a high overall sensitivity and specificity compared to laboratory-based EIAs. This extends the literature by including several new studies that were not included in prior reviews, including a subanalysis focused on RDTs that used oral fluid.

Our data suggest that RDTs can be used for HCV Ab detection in a wide range of clinical settings. High HCV Ab RDT sensitivity and specificity were observed across several different populations (general population, key populations, hospital patients). The use of an EIA to detect HCV Ab followed by NAT to confirm active infection is standard practice for diagnosis of HCV infection and recommended by the US Centers for Disease Control and Prevention (CDC) and the WHO.70,71 However, despite these recommendations, HCV Ab assays have not been widely used because of the complexity of laboratory-based assays, long turnaround time, high cost and requirements for specialized apparatus and trained technicians. To overcome this barrier, companies have developed RDTs for HCV Ab screening.72 They obviate the need for multiple follow-up appointments, shorten wait times, and allow for the simplification and decentralization of testing. However, it is essential for policy-makers, government officials, and health care practitioners engaged in HCV screening, care and treatment to know that the performance of individual RDTs for detection of HCV Ab vary widely. Individual diagnostic accuracy for specific brands should be examined to ensure acceptable performance.

In recent years, RDTs that used oral fluid has been developed. Tests that can be used with non-invasive samples allow testing to be decentralised further and can be used in outreach settings.73 Our data suggest that oral tests have slightly lower pooled sensitivity (0.94, 95% CI: 0.93–0.96) compared to blood-based tests (0.98, 95% CI: 0.97–0.98) but comparable specificity. Oral HCV Ab RDTs tests may be particularly useful in contexts where venepuncture may be difficult, such as subsets of people who inject drugs who have difficult veins to access.

With the increasing availability of DAAs, countries are seeking information on diagnostic accuracy of different tests, their operational characteristics and cost, to allow them to scale up HCV Ab screening, especially of at risk populations. Deploying which tests at which level of the health care system and for what settings require policy-makers to consider the different attributes of laboratory-based EIA versus blood-based or oral RDTs. Advantages and disadvantages of EIAs and RDTs are listed in Table 6. Performance, cost and accessibility need to be considered. Each country needs to decide on what cannot be compromised and what trade-offs are acceptable, based not only on disease prevalence and the health-care infrastructure, but also on technical, socioeconomic, cultural, behavioural considerations. For example, is it acceptable to buy Test X, which is 10% less accurate than Test Y but is considerably cheaper so that many more people can be screened? Although oral RDTs are less accurate than blood-based RDTs, would their use be more acceptable for outreach to at-risk populations and allow the control programme to identify more HCV cases? In a low-prevalence setting, even a test with 98% specificity can yield more false-positive than true-positive results. All these trade-offs can be modelled to give an estimate of the cost– effectiveness and potential impact of different strategies for HCV Ab screening.

Table 6Advantages and disadvantages of laboratory-based EIAs vs RDTs

Laboratory-based EIARDTs
Advantages
  • Accurate
  • High throughput
  • Objective, automated reading of results
  • Within-assay quality control
  • Accessible to lowest level of the health care system (including outreach)
  • Can be used with non-invasive specimens, and facilitate self-testing
  • Rapid result to enable treatment initiation at the same clinic visit
  • Can be stored at ambient temperature
Disadvantages
  • Requires laboratory facility, equipment and highly trained staff
  • Reagents need refrigeration
  • Need venepuncture to obtain sera
  • Time to result = 3–4 hours so patients need to return for results
  • Lower accuracy than EIAs
  • Subjective reading and interpretation of results
  • No built-in quality control
  • Higher cost/test

Our review also underlines some of the common methodological problems encountered in evaluating diagnostic accuracy. Cross-sectional method or case–control methods were used by all 52 included studies, introducing a potential risk of bias. These studies used a broad range of reference standards, which makes the pooled performance data less meaningful. Within the evaluation of diagnostic accuracy, even cross-sectional studies in patients with diagnostic uncertainty and direct comparison of test results with an appropriate reference standard can be considered high quality.74 The majority of the included studies used convenience sampling. In this review, we excluded panel studies because there are not based on clinical settings and our purpose was to produce data that would be relevant in clinical settings as part of detection of HCV Ab.

Most studies that reported HIV or HBV coinfection only reported the test performance of the kits among all samples, instead of disaggregated diagnostic accuracy. It may be useful for policy-makers and hospital administrators to know that the diagnostic accuracy of different kits among individuals with coinfections, particularly HIV coinfection.69 Further research is needed to understand HCV Ab test characteristics among coinfected individuals.

Our study is subject to a number of limitations. First, we included studies conducted among the general population, hospital patients and key populations. HCV prevalence is variable among these different populations.75 Diagnostic performance can be influenced by disease prevalence.76 Second, we detected substantial heterogeneity that could influence our confidence in the review findings.77 To deal with this problem, we undertook a number of subanalyses. Third, about 20 brands of RDT kits were used in the included studies, and the performance of these RDT kits vary. This limited our ability to summarize the accuracy of different brands, with the exception of comparing OraQuick to other brands. Another concern is publication bias, as studies with poor test performance may be less likely to be published, leading to distorted estimates of accuracy.78

References

1.
Hepatitis C (No 164) [Fact sheet]. Geneva: WHO; 2014.
2.
Lavanchy D . The global burden of hepatitis C. Liver Int. 2009;29(s1):74–81. [PubMed: 19207969]
3.
Mohd Hanafiah K , GroegerJ, FlaxmanAD, WiersmaST. Global epidemiology of hepatitis C virus infection: new estimates of age-specific antibody to HCV seroprevalence. Hepatology. 2013;57(4):1333–42. [PubMed: 23172780]
4.
Papatheodoridis G , TsochatzisE, HardkeS, WedemeyerH. Barriers to care and treatment for patients with chronic viral hepatitis in europe: a systematic review. Liver Int. 2014;34(10):1452–63. [PubMed: 24750532]
5.
Feeney ER , ChungRT. Antiviral treatment of hepatitis C. BMJ. 2014; 348: g3308. [PMC free article: PMC6880951] [PubMed: 25002352]
6.
Pawlotsky JM . New hepatitis C therapies: the toolbox, strategies, and challenges. Gastroenterology. 2014;146(5):1176–92. [PubMed: 24631495]
7.
Soriano V , LabargaP, Fernández-MonteroJV, VispoE, PovedaE, Martin-CarboneroL, et al. The changing face of hepatitis C in the new era of direct-acting antivirals. Antivir Res. 2013;97(1):36–40. [PubMed: 23147192]
8.
Gao F , TalbotEA, LoringCH, PowerJJ, Dionne-OdomJ, Alroy-PreisS, et al. Performance of the OraQuick HCV rapid antibody test for screening exposed patients in a hepatitis C outbreak investigation. J Clin Microbiol. 2014;52(7):2650–2. [PMC free article: PMC4097725] [PubMed: 24789176]
9.
Zheng H , LiM, ChiB, WuXX, WangJ, LiuDW. IL28B rs12980275 variant as a predictor of sustained virologic response to pegylated-interferon and immunoblotvirin in chronic hepatitis C patients: a systematic review and meta-analysis. Clin Res Hepatol Gastroenterol. 2015;39(5):576–83. [PubMed: 25769643]
10.
Manzano-Robleda Mdel C , Ornelas-ArroyoV, Barrientos-GutierrezT, Mendez-SanchezN, UribeM, Chavez-TapiaNC. Boceprevir and telaprevir for chronic genotype 1 hepatitis C virus infection. A systematic review and meta-analysis. Ann Hepatol. 2015;14(1):46–57. [PubMed: 25536641]
11.
Ambrosino P , LupoliR, TarantinoP, Di MinnoA, TarantinoL, Di MinnoMN. Viral hepatitis and anti-phospholipid antibodies positivity: A systematic review and meta-analysis. Dig Liver Dis. 2015;47(6):478–87. [PubMed: 25835772]
12.
Khodabandehloo M , RoshaniD. Prevalence of hepatitis C virus genotypes in Iranian patients: a systematic review and meta-analysis. Hepat Mon. 2014;14(12):e22915. [PMC free article: PMC4310018] [PubMed: 25685164]
13.
Khodabandehloo M , RoshaniD, SayehmiriK. Prevalence and trend of hepatitis C virus infection among blood donors in Iran: a systematic review and meta-analysis. J Res Med Sci. 2013;18(8):674–82. [PMC free article: PMC3872606] [PubMed: 24379843]
14.
Khuroo MS , KhurooNS, KhurooMS. Diagnostic accuracy of point-of-care tests for hepatitis C virus infection: a systematic review and meta-analysis. PloS One. 2015;10(3):e0121450. [PMC free article: PMC4376712] [PubMed: 25816332]
15.
Shivkumar S , PeelingR, JafariY, JosephL, PantPai N. Accuracy of rapid and point-of-care screening tests for hepatitis C: a systematic review and meta-analysis. Ann Intern Med. 2012;157(8):558–66. [PubMed: 23070489]
16.
Whiting PF , RutjesAW, WestwoodME, MalletS, DeeksJJ, ReitsmaJB, et al. QUADAS-2: a revised tool for the quality assessment of diagnostic accuracy studies. Ann Intern Med. 2011;155(8):529–36. [PubMed: 22007046]
17.
Bossuyt PM , ReitsmaJB, BrunsDE, GatsonisCA, GlasziouPP, IrwigLM, et al. The STARD statement for reporting studies of diagnostic accuracy: explanation and elaboration. Ann Intern Med. 2003;138(1):W1–12. [PubMed: 12513067]
18.
Al-Tahish G , El-BarrawyMA, HashishMH, HeddayaZ. Effectiveness of three types of rapid tests for the detection of hepatitis C virus antibodies among blood donors in Alexandria, Egypt. J Virol Methods. 2013;189(2):370–4. [PubMed: 23541785]
19.
Bonacini M , LinHJ, HollingerFB. Effect of coexisting HIV-1 infection on the diagnosis and evaluation of hepatitis C virus. J Acquir Immune Defic Syndr. 2001;26(4):340–4. [PubMed: 11317075]
20.
Buti M , CotrinaM, ChanH, JardiR, RodriuezF, CostaX, et al. Rapid method for the detection of anti-HCV antibodies in patients with chronic hepatitis C. Rev Esp Enferm Dig. 2000;92(3):140–6. [PubMed: 10799944]
21.
Caudai C , PadulaMG, BastianoniI, ValensinPE, ShyamalaV, HanJ, et al. Antibody testing and RT-PCR results in hepatitis C virus (HCV) infection: HCV-RNA detection in PBMC of plasma viremia-negative HCV-Sseropositive persons. Infection. 1998;26(3):151–4. [PubMed: 9646105]
22.
Cha YJ , ParkQ, KangES, YooBC, ParkKU, KimJW, et al. Performance evaluation of the OraQuick hepatitis C virus rapid antibody test. Ann Lab Med. 2013;33(3):184–9. [PMC free article: PMC3646192] [PubMed: 23667844]
23.
Croom HA , RichardsKM, BestSJ, FrancisBH, JohnsonEIM, DaxEM, et al. Commercial enzyme immunoassay adapted for the detection of antibodies to hepatitis C virus in dried blood spots. J Clin Virol. 2006;36(1):68–71. [PubMed: 16426889]
24.
da Rosa L , Dantas-CorreaEB, Narciso-SchiavonJL, SchiavonLL. Diagnostic performance of two point-of-care tests for anti-HCV detection. Hepat Mon. 2013;13(9):e12274. [PMC free article: PMC3830521] [PubMed: 24282422]
25.
Daniel HD , AbrahamP, RaghuramanS, VivekanandanP, SubramaniamT, SridharanG. Evaluation of a rapid assay as an alternative to conventional enzyme immunoassays for detection of hepatitis C virus-specific antibodies. J Clin Microbiol. 2005;43(4):1977–8. [PMC free article: PMC1081346] [PubMed: 15815036]
26.
Denoyel G , van HeldenJ, BauerR, Preisel-SimmonsB. Performance of a new hepatitis C assay on the Bayer ADVIA Centaur Immunoassay System. Clin Lab. 2004;50(1–2): 75–82. [PubMed: 15000223]
27.
Dokubo EK , EvansJ, WinkelmanV, CyrusS, ToblerLH, AsherA, et al. Comparison of hepatitis C virus RNA and antibody detection in dried blood spots and plasma specimens. J Clin Virol. 2014;59(4):223–7. [PMC free article: PMC4026019] [PubMed: 24529844]
28.
Drobnik A , JuddC, BanachD, EggerJ, KontyK, RudeE. Public health implications of rapid hepatitis C screening with an oral swab for community-based organizations serving high-risk populations. Am J Public Health. 2011;101(11): 2151–5. [PMC free article: PMC3222414] [PubMed: 21940910]
29.
Eroglu C , YildizE, OzturkM, PinarbasiE. A highly sensitive and specific enzyme-linked immunosorbent assay of antibodies to hepatitis C virus. Acta Virol. 2000;44(1):29–33. [PubMed: 10989689]
30.
Feucht HH , ZollnerB, PolywkaS, LaufsR. Study on reliability of commercially available hepatitis C virus antibody tests. J Clin Microbiol. 1995;33(3):620–4. [PMC free article: PMC228001] [PubMed: 7751366]
31.
Hess KL , FisherDG, ReynoldsGL. Sensitivity and specificity of point-of-care rapid combination syphilis-HIV-HCV tests. PloS One. 2014;9(11):e112190. [PMC free article: PMC4223032] [PubMed: 25375138]
32.
Hui AY , ChanFK, ChanPK, TamJS, SungJJ. Evaluation of a new rapid whole-blood serological test for hepatitis c virus. Acta Virol. 2002;46(1):47–8. [PubMed: 12197634]
33.
Ibrahim S , Al AttasSA, MansourGA, OudaS, FallatahH. Accuracy of rapid oral HCV diagnostic test among a Saudi sample. Clin Oral Investig. 2015;19(2):475–80. [PubMed: 24846644]
34.
Ivantes CA , SilvaD, Messias-ReasonI. High prevalence of hepatitis C associated with familial history of hepatitis in a small town of south Brazil: efficiency of the rapid test for epidemiological survey. Braz J Infect Dis. 2010;14(5):483–8. [PubMed: 21221477]
35.
Jewett A , SmithBD, GarfeinRS, Cuevas-MotaJ, TeshaleEH, WeinbaumCM. Field-based performance of three pre-market rapid hepatitis C virus antibody assays in STAHR (Study to Assess Hepatitis C Risk) among young adults who inject drugs in San Diego, CA. J Clin Virol. 2012;54(3):213–7. [PMC free article: PMC5484575] [PubMed: 22560051]
36.
Kant J , MollerB, HeyneR, HerberA, BohmS, MaierM, et al. Evaluation of a rapid on-site anti-HCV test as a screening tool for hepatitis C virus infection. Eur J Gastroenterol Hepatol. 2013;25(4):416–20. [PubMed: 23211286]
37.
Kaur H , DhanaoJ, OberoiA. Evaluation of rapid kits for detection of HIV, HBsAg and HCV infections. Indian J Med Sci. 2000;54(10):432–4. [PubMed: 11262859]
38.
Kim MH , KangSY, LeeWI. Evaluation of a new rapid test kit to detect hepatitis C virus infection. J Virol Methods. 2013;193(2):379–82. [PubMed: 23871756]
39.
Kosack CS , NickS, ShanksL. Diagnostic accuracy evaluation of the Immuno Flow HCV rapid immunochromatographic test for the detection of hepatitis C antibodies. J Virol Methods. 2014;204:6–10. [PubMed: 24726704]
40.
Lakshmi V , ReddyAK, DakshinamurtyKV. Evaluation of commercially available third-generation anti-hepatitis C virus enzyme-linked immunosorbent assay in patients on haemodialysis. Indian J Med Microbiol. 2007;25(2):140–2. [PubMed: 17582185]
41.
Larrat S , BourdonC, BaccardM, GarnaudC, MathieuS, QuesadaJL, et al. Performance of an antigen-antibody combined assay for hepatitis C virus testing without venipuncture. J Clin Virol. 2012;55(3):220–5. [PubMed: 22901327]
42.
Lee SR , KardosK, YearwoodG, KurtzL, RoehlerM, FeissG. Results of a multi-center evaluation of a new rapid test for detection of HCV infection using whole blood, serum, plasma and oral fluid. J Hepatol. 2010;52:S271.
43.
Lee SR , KardosKW, SchiffE, BerneCA, MounzerK, BanksAT, et al. Evaluation of a new, rapid test for detecting HCV infection, suitable for use with blood or oral fluid. J Virol Methods. 2011;172(1–2):27–31. [PubMed: 21182871]
44.
Lee SR , YearwoodGD, GuillonGB, KurtzLA, FischlM, FrielT, et al. Evaluation of a rapid, point-of-care test device for the diagnosis of hepatitis C infection. J Clin Virol. 2010;48(1):15–17. [PubMed: 20362493]
45.
Maity S , NandiS, BiswasS, SadhukhanSK, SahaMK. Performance and diagnostic usefulness of commercially available enzyme linked immunosorbent assay and rapid kits for detection of HIV, HBV and HCV in India. Virol J. 2012;9:290. [PMC free article: PMC3568713] [PubMed: 23181517]
46.
Montebugnoli L , BoreaG, MinieroR, SprovieriG. A rapid test for the visual detection of anti-hepatitis C virus antibodies in whole blood. Clin Chim Acta. 1999;288(1–2):91–6. [PubMed: 10529461]
47.
Mvere D , ConstantineNT, KatsawdeE, TobaiwaO, DambireS, CorcoranP. Rapid and simple hepatitis assays: encouraging results from a blood donor population in Zimbabwe. Bull World Health Organ. 1996;74(1):19–24. [PMC free article: PMC2486854] [PubMed: 8653812]
48.
Nalpas B , ThiersV, PolS, DrissF, ThepotV, BerthelotP, et al. Hepatitis-C viremia and anti-HCV antibodies in alcoholics. J Hepatol. 1992;14(2–3):381–4. [PubMed: 1380027]
49.
Njouom R , TejiokemMC, ZangaMC, PouillotR, AyoubaA, PasquierC, et al. A cost-effective algorithm for the diagnosis of Hepatitis C virus infection and prediction of HCV viremia in Cameroon. J Virol Methods. 2006;133(2):223–6. [PubMed: 16360220]
50.
Nyirenda M , BeadsworthMB, StephanyP, HartCA, HartIJ, MunthaliC, et al. Prevalence of infection with hepatitis B and C virus and coinfection with HIV in medical inpatients in Malawi. J Infect. 2008;57(1):72–7. [PubMed: 18555534]
51.
O’Connell RJ , GatesRG, BautistaCT, ImbachM, EgglestonJC, BeardsleySG, et al. Laboratory evaluation of rapid test kits to detect hepatitis C antibody for use in predonation screening in emergency settings. Transfusion. 2013;53(3):505–17. [PubMed: 22823283]
52.
O’Flynn N , JilgW, McQuillanT, et al. New HCV assay on the Abbott AxSYM random access analyzer. Clin Lab. 1997;43(5):403–9.
53.
Park Y , SeokY, ChoiJ, KimHS. Performance evaluation of the Vitros anti-hepatitis C virus antibody assay for use in clinical laboratories. Clin Biochem. 2012;45(1–2):175–7. [PubMed: 22093968]
54.
Poovorawan Y , TheamboonlersA, ChumdermpadetsukS, ThongCP. Comparative results in detection of HCV antibodies by using a rapid HCV test, ELISA and immunoblot. Southeast Asian J Trop Med Public Health. 1994;25(4):647–9. [PubMed: 7545315]
55.
Prayson RA , ProffittMR, SharpDE, CareyWD. Application of a 2nd-generation recombinant immunoblot assay to assess hepatitis-C infection. Lab Med. 1993;24(11):732–8.
56.
Rihn B , HussenetF, DetryMB, CatelleA, FaouAL. Evaluation of a supplemental assay for the diagnosis of hepatitis C virus infections. Int J Infect Dis. 2000;4(1):42–5. [PubMed: 10689214]
57.
Scalioni Lde P , CruzHM, de PaulaVS, MiguelJC, MarguesVA, Villela-NogueriaCA, et al. Performance of rapid hepatitis C virus antibody assays among high- and low-risk populations. J Clin Virol. 2014;60(3):200–5. [PubMed: 24794796]
58.
Smith BD , DrobeniucJ, JewettA, BransonBM, GarfeinRS, TeshaleE, et al. Evaluation of three rapid screening assays for detection of antibodies to hepatitis C virus. J Infect Dis. 2011;204(6):825–31. [PubMed: 21849279]
59.
Smith BD , TeshaleE, JewettA, WeinbaumCM, NeaigusA, HaganH, et al. Performance of premarket rapid hepatitis C virus antibody assays in 4 national human immunodeficiency virus behavioral surveillance system sites. Clin Infect Dis. 2011;53(8):780–6. [PubMed: 21921221]
60.
Sommese L , IannoneC, CacciatoreF, De IorioG, NapoliC. Comparison between screening and confirmatory serological assays in blood donors in a region of South Italy. J Clin Lab Anal. 2014;28(3):198–203. [PMC free article: PMC6807438] [PubMed: 24478048]
61.
Tagny CT , MbanyaD, MurphyEL, LefrereJJ, LapercheS. Screening for hepatitis C virus infection in a high prevalence country by an antigen/antibody combination assay versus a rapid test. J Virol Methods. 2014;199:119–23. [PMC free article: PMC5042449] [PubMed: 24487098]
62.
Vrielink H , ZaaijerHL, ReesinkHW, Borst-LoefJ, CuypersHT, LeliePN. Performance of a new third-generation anti-hepatitis C virus ELISA (Monolisa anti-HCV new antigens) in various serum panels. Vox Sang. 1995;69(3):257–8. [PubMed: 8578742]
63.
Vrielink H , ZaaijerHL, ReesinkHW, van der PoelCL, CuypersHT, LeliePN. Sensitivity and specificity of three third-generation anti-hepatitis C virus ELISAs. Vox Sang. 1995;69(1):14–7. [PubMed: 7483486]
64.
Yaari A , TovbinD, ZlotnickM, MostoslavskyM, Shemer-AvniY, HanukaN, et al. Detection of HCV salivary antibodies by a simple and rapid test. J Virol Methods. 2006;133(1):1–5. [PubMed: 16360219]
65.
Yang JF , LinYY, HsiehMH, TsaiCH, LiuSF, YuML, et al. Performance characteristics of a combined hepatitis C virus core antigen and anti-hepatitis C virus antibody test in different patient groups. Kaohsiung J Med Sci. 2011;27(7):258–63. [PubMed: 21757142]
66.
Yang R , GuanW, WangQ, LiuY, WeiL. Performance evaluation and comparison of the newly developed Elecsys anti-HCV II assay with other widely used assays. Clin Chim Acta. 2013;426:95–101. [PubMed: 24056023]
67.
Yoo SJ , WangLL, NingHC, TaoCH, HirankarnN, KuakarnS, et al. Evaluation of the Elecsys Anti-HCV II assay for routine hepatitis C virus screening of different Asian Pacific populations and detection of early infection. J Clin Virol. 2015;64:20–7. [PubMed: 25728074]
68.
Yuen MF , HuiCK, YuenJC, YoungJL, LaiCL. The accuracy of SM-HCV rapid test for the detection of antibody to hepatitis C virus. Am J Gastroenterol. 2001;96(3):838–41. [PubMed: 11280561]
69.
Khuroo MS , KhurooNS, KhurooMS. Diagnostic accuracy of point-of-care tests for hepatitis C virus infection: a systematic review and meta-analysis. PloS One. 2015; 10(3). [PMC free article: PMC4376712] [PubMed: 25816332]
70.
Alter MJ , KuhnertWL, FinelliL. Guidelines for laboratory testing and result reporting of antibody to hepatitis C virus. MMWR Recomm Rep. 2003;52(RR–3):1–13. [PubMed: 12585742]
71.
Guidelines for the screening, care and treatment of persons with hepatitis C infection. Geneva: World Health Organization; 2014 (http://apps​.who.int/iris​/bitstream/10665​/111747/1/9789241548755_eng.pdf, accessed 06 June 2016). [PubMed: 25535634]
72.
St John A , PriceCP. Economic evidence and point-of-care testing. Clin Biochem Rev. 2013;34(2):61–74. [PMC free article: PMC3799220] [PubMed: 24151342]
73.
Parisi MR , SoldiniL, VidoniG, MabelliniC, BelloniT, BrignoloL, et al. Point-of-care testing for HCV infection: recent advances and implications for alternative screening. New Microbiol. 2014;37(4):449–57. [PubMed: 25387283]
74.
Schünemann HJ , OxmanAD, BrozekJ, GlasziouP, JaeschkeR, VistGE, et al. Grading quality of evidence and strength of recommendations for diagnostic tests and strategies. BMJ. 2008;336(7653):1106–10. [PMC free article: PMC2386626] [PubMed: 18483053]
75.
Shepard CW , FinelliL, AlterMJ. Global epidemiology of hepatitis C virus infection. Lancet Infect Dis. 2005;5(9):558–67. [PubMed: 16122679]
76.
Leeflang MM , MoonsKG, ReitsmaJB, ZwindermanAH. Bias in sensitivity and specificity caused by data-driven selection of optimal cutoff values: mechanisms, magnitude, and solutions. Clin Chem. 2008;54(4):729–37. [PubMed: 18258670]
77.
Irwig L , MacaskillP, GlasziouP, FaheyM. Meta-analytic methods for diagnostic test accuracy. J Clin Epidemiol. 1995;48(1):119–30. [PubMed: 7853038]
78.
Rothstein HR , SuttonAJ, BorensteinM, editors. Publication bias in meta-analysis: prevention, assessment and adjustments. Hoboken, NJ: John Wiley & Sons; 2005.

Annex 5.5. PICO 3 - Testing strategies (HBV)
Diagnostic strategies for hepatitis B surface antigen detection: a meta-analysis and review of the literature

Authors

; Team lead: ,* ,* , , , , , , and .

Affiliations

1 London School of Hygiene and Tropical Medicine team
* Co-leaders of this review

1. Executive study

Background: Most individuals with chronic HBV infection are not aware of their serostatus, contributing to delayed diagnosis and complications from advanced disease. Chronic HBV infection, defined as persistence of hepatitis B surface antigen (HBsAg) for at least six months, is a major cause of preventable morbidity and mortality worldwide. Advances in hepatitis B virus (HBV) detection technology create new opportunities for enhancing screening, referral, and treatment. This review will look into what is the best testing strategy (diagnostic accuracy, cost, cost–effectiveness, and other resource utilization) for detection of HBsAg.

Methods: A comprehensive literature search algorithm, including Internet searches, using the components hepatitis B, screening, and testing strategies were applied. We reviewed observational and RCT studies that provided original data from patient specimens. Our goal was to compare two broad strategies for HBsAg detection – one-test strategies and two-test strategies.

Results: Our search resulted in 3655 literature review references and 7 additional Internet references for PICO 3. Screening of titles/abstracts resulted in 7 selected articles for possible data extraction. None of these 7 articles met all of the data extraction inclusion criteria so no articles were identified as final selection for PICO 3; comparing the diagnostic accuracy, cost, or effectiveness of two different testing algorithms, where possible. These 7 articles are discussed in more detail – 4 of the articles provided 3 national HBV algorithms (Australia, UK, US); 1 discussed testing strategies for select populations; 2 provided a look at cost– effectiveness of given testing strategies.

Conclusions: No study compared the diagnostic accuracy, cost, or cost–effectiveness of one- versus two-step HBsAg testing strategies. Studies that may provide contextual information about testing strategies were briefly summarized.

2. Background

Hepatitis B virus

An estimated 240 million individuals worldwide1 are chronically infected with hepatitis B virus (HBV) and there are an estimated 4 million acute HBV infections each year. Twenty per cent to 30% of those with chronic hepatitis B infection will develop cirrhosis2 or hepatocellular carcinoma,3 leading to approximately 650 000 deaths each year.4 However, most individuals with chronic HBV infection are not aware of their serostatus, contributing to delayed diagnosis and complications from advanced disease.5 HBV testing is critically important in order to refer infected individuals to HBV treatment and care, to refer uninfected individuals to vaccination, and to mobilize prevention and control efforts.

In March 2015, the World Health Organization published the first guidelines for the prevention, care, and treatment of individuals with chronic HBV infection.5 These guidelines focused on assessment for treatment eligibility, initiation of first-line therapies, switching, and monitoring. These initial guidelines did not include recommendations on testing strategies that included what test to use and how to test. Given the large burden of HBV in low- and middle-income settings where there are limited or no existing HBV testing guidelines, there is a substantial need for HBV testing guidelines.

Description of HBV Ag detection

Chronic HBV infection is defined as persistence of hepatitis B surface antigen (HBSAg) for at least six months. However, interpretation of HBV serologies is complex (Table 1). The serological markers most frequently used for HBV testing include HBsAg, total anti-HBc, and anti-HBs (Table 1).

Table 1Hepatitis B serological marker interpretation

Serological markerInterpretation
HBsAg (hepatitis B surface antigen)Total anti-HBc (antibody to hepatitis B core antigen)IgM anti-HBc (immunoglobulin M to anti-HBc)Anti-HBs (antibody to HBsAg)
Test resultsNever infected and susceptible to infection
++Chronic infection
++Recovered from past infection and immune
+++Acute infection
++Immune by natural infection
+Immune by hepatitis B vaccination
+Immune by natural infection or possible false positive

Source: US Centers for Disease Control and Prevention. (Available at: http://www.cdc.gov/immigrantrefugeehealth/guidelines/domestic/hepatitis-screening-guidelines.html)

One test vs two test serological testing strategy

The most important marker for the diagnosis of chronic hepatitis B infection requiring further assessment or treatment remains HBsAg. The case definition of chronic hepatitis B is the detection of HBsAg twice six months apart.

After an initial positive result for HBsAg, supplementary testing can be undertaken in order to facilitate entry into a care pathway. The detection of HBsAg in blood can include rapid diagnostic tests, or enzyme immunoassays. Confirmation of the specificity of a reactive HBsAg first-line test result is usually carried out by either:

i)

repeating the HBsAg testing in a different assay of similar sensitivity, or

ii)

performing a neutralization test using a specific anti-HBs-containing reagent in the same first-line assay after appropriate dilution of the specimen under test. Specificity is confirmed when this reagent abolishes reactivity in the assay.

WHO recommends standardized testing strategies to maximize the accuracy of hepatitis B and C testing while minimizing cost and increasing simplicity. This PICO question addresses the issue of whether a positive result from a single HBsAg assay has sufficient specificity in order to proceed to supplementary testing and/or entry into a care pathway, or whether confirmatory testing on the same specimen with a different HBsAg assay (or neutralization), performed sequentially after the first assay is required. This is particularly relevant in low prevalence settings where more than one assay may be required to confirm specificity. Two previous reviews6,7 on hepatitis testing focused on the test performance but did not compare testing strategies.

Fig. 1. Options for HBV screening, which may include HBsAg in a one-test strategy (e.g. a single HBsAg using a rapid diagnostic test [RDT] or enzyme immunoassay [EIA]) and two-test strategies (second RDT or EIA or neutralization with EIA).

Fig. 1Options for HBV screening, which may include HBsAg in a one-test strategy (e.g. a single HBsAg using a rapid diagnostic test [RDT] or enzyme immunoassay [EIA]) and two-test strategies (second RDT or EIA or neutralization with EIA)

PICO 3HBsAg testing strategy: Among persons identified for hepatitis B testing, what is the best testing strategy (diagnostic accuracy and other outcomes) for detection of HBsAg? (One-test versus two-test strategy) (Figs 1A, 1B)
PPersons identified for HBV testing
IOne-test strategy; one HBsAg test (Fig. 1A)
CTwo-test strategy; two different HBsAg tests (Fig. 1B)
ODiagnostic accuracy
True negatives (TN), who are screen negative, and do not have HBV infection
False negatives (FN), who are screen negative but have HBV infection. These are incorrectly misclassified, and this may result in missed opportunities to recognize and present progression of liver disease.
True positives (TP), who are screen positive and have HBV infection.
False positives (FP), who are screen positive, but do not truly have HBV infection. These will have additional unnecessary tests and evaluation.
Costs (cost of testing strategy, including lab reagents and running costs, cost of further evaluation of a false positive)
Cost–effectiveness
Acceptability to health-care worker and patients
Other outcomes (missed cases of liver disease because of false negative results, unnecessary referral, investigations and/or treatment in false positives)

3. Objectives

  • To identify quantitative evidence on the sensitivity and specificity of one-test compared to two-test algorithms for detection of HBsAg
  • To evaluate the cost–effectiveness, acceptability, and other outcomes (missed liver disease because of false-negative results, unnecessary referral, investigations) associated with these two types of testing strategies
  • To inform models to optimize hepatitis B screening algorithms.

4. Methods

We reviewed observational studies and randomized controlled trials (RCTs) that provided original data from patient specimens. Our goal was to compare two broad strategies for HBsAg detection – one-test strategies and two-test strategies.

Search algorithm

Literature search strategies were developed by a medical librarian with expertise in systematic review searching. Our search algorithm consisted of the following components: hepatitis B, screening, and testing strategies (Annex 1).

We searched MEDLINE (OVID interface, 1946 onwards), EMBASE (OVID interface, 1947 onwards), the Cochrane Central Register of Controlled Trials (Wiley interface, current issue), Science Citation Index Expanded (Web of Science interface, 1970 onwards), Conference Proceedings Citation Index-Science (Web of Science interface, 1990 onwards), SCOPUS (1960 onwards), Literatura Latino-Americana e do Caribe em Ciências da Saúde (LILACS) (BIREME interface) and WHO Global Index Medicus. The search was supplemented by searching for ongoing studies in WHO’s International Clinical Trials Registry. The literature search was limited to the English language and human subjects.

We formulated a comprehensive and exhaustive search strategy in an attempt to identify all relevant studies. After the MEDLINE strategy was finalized, it was adapted to the syntax and subject headings of the other databases.

In addition to searching databases, we also searched the Internet for any peer-reviewed articles and conference abstracts that might have been missed through our librarian search and also expanded our search to national guidance documents.

5. Results

Study selection

The librarian search resulted in 3655 references for PICO 3. Because of overlap with objectives and search strategies between PICOs 3 and 4, and to expedite the initial screening, PICO 3 references were combined with the 3060 references identified through the librarian search for PICO 4 (HCV); 2388 searches were immediately excluded. The librarian excluded 835 for not being relevant and there were 1553 duplicates. Thus, 4327 remained for screening. Titles/abstracts were screened according to protocol inclusion and exclusion criteria, for both PICOs 3 and 4. Reasons for excluding 4307 reports were noted (Fig. 2).

Fig. 2. PRISMA for PIC0 3 HBV (Diagnostic strategies for hepatitis B surface antigen and hepatitis C antibody detection).

Fig. 2 PRISMA for PIC0 3 HBV (Diagnostic strategies for hepatitis B surface antigen and hepatitis C antibody detection)

From the librarian search, no reports were identified for possible data extraction. The Internet searches resulted in 7 additional reports for possible data extraction. Full documents (manuscripts, abstracts, guidelines, etc.) were obtained and assessed against inclusion criteria. Papers were either accepted or rejected and reasons for rejection were explained.

The following inclusion criteria were used to evaluate the final selection: evaluations of HBV testing strategies; evaluations based on human clinical materials. The following exclusion criteria were used: studies focused only on evaluation of single-test assays without a two-test comparator group; studies focused on two-test strategies that include other types of test (e.g. anti-HBsAg) studies with primary aims other than evaluation of testing strategies; studies related to disease prevalence, drug resistance, genotyping, sequencing, or non-diagnostic purposes; articles in languages other than English, conference abstracts.

Data abstraction and data synthesis

Of the 7 selected for possible data extraction, the following variables were collected, when available: first author, title, year, objective, and exclusion criteria (Table 2).

Table 2Seven reports assessed for eligibility

Author or source yearTitleObjectiveExclusion criteriaConclusions
1.Fan et al. 2014Cost-effectiveness of testing hepatitis B-positive pregnant women for hepatitis B e antigen or viral loadTo estimate cost-effectiveness of testing with hepatitis B (hepatitis B surface antigen [HBsAg]-positive) for hepatitis B e antigen (HBeAg) or hepatitis B virus (HBV) DNADecision tree model to estimate the costs and effects of two sequential testing strategiesEither sequential HBeAg testing or sequential HBV load testing was cost-effective. Sequential HBeAg testing dominated sequential HBV load testing with 1000 QALYs and $6.6 million saved
2.US Preventive Services Task Force, 2014Hepatitis B, non-pregnant adolescents and adults: screening, May 2014To recommend screening for hepatitis B virus (HBV) infection in persons at high risk for infectionNo data/not a study. USPSTF makes recommendations about the effectiveness of specific clinical preventive services for patients without related signs or symptoms.Document makes screening recommendation; not relevant to data synthesis for this report
3.Prepared for the US Preventive Services Task Force by Peter W. Pendergrass and Carolyn DiGuiseppi (Texas Dept State Health and Univ. Colorado), 2014Screening for hepatitis B virus infectionTo develop recommendations for USPSTFNo data/not a studyDocument makes screening recommendation; not relevant to data synthesis for this report
4.Chen et al. 2015Cost-effectiveness of augmenting universal hepatitis B vaccination with immunoglobin treatmentTo compare the costeffectiveness of hepatitis B virus (HBV) control strategies combining universal vaccination with hepatitis B immunoglobulin (HBIG) treatment for neonates of carrier mothersNot testing strategies – vaccination strategiesUniversal vaccination plus screening for hepatitis B surface antigen (HBsAg) and HBIG treatment for HBsAg-positive mothers’ neonates averted the most infections
5.Public Health England (PHE), National Health Service (NHS), 2014UK Standards for Microbiology InvestigationsTo develop a set of standards for hepatitis B diagnostic serology in the immunocompetent (including hepatitis B in pregnancy)No data/not a studyNo conclusions
6.Australian Government, 2012National HBV Testing StrategyTo provide diagnostic strategies for HBVNo data/not a studyNo conclusions
7.Peng et al. 2011Development of an economic and efficient strategy to detect HBsAg: Application of “grey-zones” in ELISA and combined use of several detection assaysTo thoroughly assess the performance of the HBsAg assays and testing algorithm currently used in clinical settingsDoes not compare strategiesCombined use of “grey-zones” in ELISA and several different detection assays can significantly increase the efficiency of HBsAg detection

References found in Annex 2.

None of the reports compared the cost or effectiveness of two different testing algorithms. Of the 13 documents selected, 4 referenced algorithms and are therefore shown in Table 3. Types of tests performed and exclusion criteria are also included.

Table 3Four reports that examined testing strategies

ReferencesTest 1Test 2Test 3Test 4Exclusion criteria
1Fan et al.

2014
Sequential HBeAgDecision tree model to estimate the costs and effects of two sequential testing strategies
Sequential HBV load
2*Public Health England (PHE), National Health Service (NHS),

2014
HBsAgRepeat HBsAgConfirm by neutralizationNo data/not a study
HBsAgRepeat HBsAgAnti-HBcHBV DNA or IgM
3*Australian Government,

2012
HBsAgAnti-HBsAnti-HBcNo data/not a study
4*Peng et al.

2011
ELISAELISACMIAConfirm by HBsAgDoes not compare strategies
*

Algorithm schematics attached (Annex 3)

Extensive review of the literature found no articles, reports, etc. that met all of the eligibility criteria for data extraction to be used to address this question. Most of the literature focused on screening blood donations.

Seven reports were identified that might be useful for modelling exercises to address this PICO question. This short narrative will provide an overview of these 7 articles, also drawing on other informative reviews and personal communications.

Cost

Fan et al. (2014) examined the cost–effectiveness of testing hepatitis B-positive pregnant women for hepatitis B e antigen or viral load. In this select population of mothers of a neonate birth cohort, either sequential HBeAg testing or sequential HBV load testing was found cost– effective. Sequential HBeAg testing dominated sequential HBV load testing with 1000 QALYs and $6.6 million saved. It is important to note that this study used a decision tree model to estimate the costs and effects of two sequential testing strategies.

Chen et al. (2015) also examined cost–effectiveness of three strategies using a cohort of hospital patients in China. In this case, costing was not related to testing strategies but vaccination strategies, specifically universal HBV vaccination with immunoglobulin treatment. Their study found that while screening tests may be cost–effective, they require more infrastructure than is needed for vaccination, including laboratory services and adequate numbers of medical professionals to interpret test results and administer HBIG. As previously mentioned, it appears that vaccination should strongly be taken into account with considering HBV testing strategies.

Quality assessment

Study quality was not evaluated using the QUADAS-2 tool8 and the STARD checklist, as it was not applicable since none of the studies met inclusion criteria.9

6. Discussion

Testing strategies

Although four of the seven reports identified provided national testing algorithms for Australia and the UK, none published data on supporting evidence. This has been confirmed by personal communications.

In general, HBV screening typically includes HBsAg in both the one-test (e.g. HBsAg) and two-test strategies. Beyond this it is unclear how to select other tests. This may depend on findings from PICO 1 to better understand the performance characteristics of HBV tests, and from this to model various testing strategies for feasibility and utility.

The “simplest” testing strategies seemed to include all 3 tests below (as seen in the US and Australia algorithms).

  • hepatitis B surface antigen (HBsAg)
  • hepatitis B core antigen (anti-HBc)
  • hepatitis B surface antibody (anti-HBs)

Public Health England (PHE) provides testing strategies to confirm HBsAg by an alternative assay or neutralization. Without much other evidence to support this, it seems as though confirming with an alternative assay might be a simple, cost–effective approach. It is also important to note that almost all reports reviewed also discussed comparing cost of screening and a testing strategy to cost of vaccination.

Testing recommended for select populations

During domestic medical examination of refugees, CDC screens using the above tests for chronic HBV (HBsAg) for all persons from countries with intermediate (≥2%–7%) or high (≥8%) prevalence of chronic HBV infection. The only exception would be if a negative HBsAg test result is documented on their medical form.

Peng et al. (2011) examined novel strategies to detect HBsAg using ELISA “grey-zones”, in combination with other detection assays. As noted, clinical HBV detection methods differ between countries with high and low levels of endemic HBV infection. This study focused on a select population to test the algorithm currently used in clinical settings in China, specifically assessing the performance of the KHB (Kehua Bio-engineering Co. Ltd., Shanghai, China) and CMIA (Chemiluminescent Micropartical Immunoassay) HBsAg tests. While KHB is one of the most commonly used kits in China, this was a major limitation for the purposes of this systematic review. Yet, they presented a novel approach of combining strategies using ELISA “grey-zones”, which was found to significantly increase the efficiency of HBsAg detection. Although this approach “broadened the range” to allow for increased sensitivity, it may prove to be rather complicated requiring the establishment of numerous population-specific “grey-zones” and complex interpretations.

Again, almost all reports discussed testing based on select populations but this study did not focus on identifying algorithms to be used on select populations.

The choice between a one-test versus two-test strategy depends on the diagnostic accuracy of HBsAg tests. Results from a systematic review of the diagnostic accuracy of HBsAg tests (PICO 1) across 21 studies that evaluated 25 brands of RDTs using 15 EIA reference assays, with 36 919 total samples, including serum, plasma, venous and capillary whole blood, showed that the overall pooled clinical sensitivity and specificity of rapid HBsAg tests were 90.0% (95% CI: 89.1, 90.8) and 99.5% (95% CI: 99.4, 99.5), respectively, compared to laboratory-based immunoassay reference standards. Sensitivities ranged from 50% to 100% with overall pooled sensitivity of 90.0% (95% CI: 89.1, 90.8). Specificities ranged from 69% to 100%, with overall pooled specificity of 99.5% (95% CI: 99.4, 99.5). Pooled positive likelihood ration (PLR) and negative likelihood ratio (NLR) were 117.5 (95% CI: 67.7, 204.1) and 0.095 (95% CI 0.067, 0.136), respectively, with tau-square 3.89, 1.72, respectively, suggestive of significant heterogeneity between studies.

Pooled sensitivity in studies of HIV-positive persons was lower than in known HIV-negative patients; 72.3% (95% CI: 67.9, 76.4) compared to 92.6% (95% CI: 89.8, 94.8), respectively. Pooled sensitivity and specificity in blood donors were 91.6% (95% CI: 90.1, 92.9) and 99.5% (95% CI: 99.5, 99.9), respectively. Samples using whole blood specimens (venous or capillary) were 91.7% (95% CI: 89.1, 93.9) and 99.9% (95% CI: 99.8, 99.9) sensitive and specific compared to serum. The overall pooled clinical sensitivity and specificity of laboratory-based HBsAg tests were 88.9% (95% CI: 87.0, 90.6) and 98.4% (95% CI: 97.8, 98.8) sensitivity and specificity, respectively, compared to state-of-the-art chemiluminescent microparticle enzyme immunoassays.

Although these tests appeared to have excellent specificity and would have required a 2-test strategy, in a low-prevalence setting, even tests that have excellent specificities may produce false-positive results. This would then require the use of a second test to reduce the number of false-positive results. This can be illustrated as follows:

In a hypothetical population of 1000 people where the HBV prevalence is 2%, a test with a sensitivity of 100% and a specificity of 99% may lead to 10 false-positive and 20 true-positive results. This means that 1 in 3 positive results may be a false-positive result.

Table 4Diagnostic accuracy in a low-prevalence setting example

Reference test
+
Index test +201030
Index test –0970970
Total209801000

Sensitivity = 20/20 = 100%; Specificity = 970/980 = 99%; PPV = 20/30 = 67%; NPV = 970/970 = 100%.

The systematic review also showed that HBsAg tests have a lower sensitivity in HIV-positive individuals. A second test may be useful for increasing the performance of testing overall.

Worked example to illustrate the effect of prevalence on predictive values for the two different testing strategies

Assuming the following assay performance characteristics:

  • If Assay 1 has sensitivity of 99% and specificity of 98%
  • If Assay 2 has sensitivity of 99.4 and specificity of 99.5%

Table 5Effect of prevalence on predictive values for the two different testing strategies

Prevalence of analyte
0.1%1%10%
Positive predictive values
Assay 14.7%33.3%84.6%
Assay 1 + Assay 2 (serial)90.7%99%99.9%
Negative predictive values
Assay 199.9%99.99%99.99%

Using the following equation for PPV and NPV that incorporates prevalence more correctly,

PPV=sensitivity×prevalencesensitivity×prevalence+(1specificity)×(1prevalence)
NPV=specificity×(1prevalence)(1sensitivity)×prevalence+specificity×(1prevalence)

Reference

7. Conclusions

No study compared diagnostic accuracy, cost, cost–effectiveness of one- vs two-step testing strategies for the detection of HBsAg. Diagnosis of HBV is very complex and there may not be simple algorithms that will cover all settings. All PICOs related to HBV will need to be looked at together to address PICO 3.

The decision tree model described by Fan et al. may prove to be useful for modelling costs of testing strategies. Vaccination strategies should also be taken into account.

References

1.
Ott JJ , StevensGA, GroegerJ, WiersmaST. Global epidemiology of hepatitis B virus infection: new estimates of age-specific HBsAg seroprevalence and endemicity. Vaccine. 2012;30(12): 2212–9. [PubMed: 22273662]
2.
Ganem D , PrinceAM. Hepatitis B virus infection – natural history and clinical consequences. N Engl J Med. 2004;350(11):1118–29. [PubMed: 15014185]
3.
Fattovich G , StroffoliniT, ZagniI, DonatoF. Hepatocellular carcinoma in cirrhosis: incidence and risk factors. Gastroenterology. 2004;127(5Suppl 1): S35–S50. [PubMed: 15508101]
4.
Lozano R , NaghaviM, ForemanK, LimS, ShibuyaK, ABoyansVet al. Global and regional mortality from 235 causes of death for 20 age groups in 1990 and 2010: a systematic analysis for the Global Burden of Disease Study 2010. Lancet. 2012;380(9859):2095–128. [PubMed: 23245604]
5.
Guidelines for the prevention, care, and treatment of persons with chronic hepatitis B infection. Geneva: WHO; 2015. [PubMed: 26225396]
6.
Hwang SH , OhHB, ChoiSE, et al. [Meta-analysis for the pooled sensitivity and specificity of hepatitis B surface antigen rapid tests]. Korean J Lab Med. 2008; 28(2): 160–8. [PubMed: 18458514]
7.
Shivkumar S , PeelingR, JafariY, JosephL, PaiNP. Rapid point-of-care first-line screening tests for hepatitis B infection: a meta-analysis of diagnostic accuracy (1980–2010). Am J Gastroenterol. 2012;107(9):1306–13. [PubMed: 22641308]
8.
Whiting PF , RutjesAW, WestwoodME, MallettS, DeeksJJ, ReitsmaJBet al. QUADAS-2: a revised tool for the quality assessment of diagnostic accuracy studies. Ann Intern Med. 2011;155(8):529–36. [PubMed: 22007046]
9.
Bossuyt PM , ReitsmaJB, BrunsDE, GatsonisCA, GlasziouPP, IrwigLMet al. The STARD statement for reporting studies of diagnostic accuracy: explanation and elaboration. Ann Intern Med. 2003;138(1):W1–W12. [PubMed: 12513067]

Appendices

Appendix 1. Librarian search

  1. Hepatitis, Viral, Human/
  2. Hepatitis Viruses/
  3. Hepatitis Antibodies/
  4. exp Hepadnaviridae Infections/
  5. Hepatitis B Antibodies/
  6. Hepatitis B virus/
  7. Hepadnaviridae/
  8. Hepatitis B Surface Antigens/
  9. (heptatitis-b or hep-b or (hepatitis adj5 b) or (hep adj5 b) or hbv).ti,ab.
  10. hbsag.ti,ab.
  11. exp Hepatitis C/
  12. Hepacivirus/
  13. Hepatitis C Antibodies/
  14. (heptatitis-c or hep-c or (hepatitis adj5 c) or (hep adj5 c) or hcv or aghcv or hepacivirus*).ti,ab.
  15. hcvab.ti,ab.
  16. or/1–15 [HEP B or HEP C]
  17. exp Mass Screening/
  18. screen*.ti,ab.
  19. 17 or 18 [MASS SCREENING]
  20. (one-test* or two-test*).ti,ab.
  21. (“1-test*” or “2-test*”).ti,ab.
  22. ((one or two or “1” or “2” or strateg* or algorithm* or approach or procedure* or system*) adj5 (test or tests or testing or detect* or diagnos* or kit or kits or assay* or device*)).ti,ab.
  23. or/20–22 [TESTING STRATEGIES]
  24. 16 and 19 and 23
  25. Humans/
  26. Animals/
  27. 25 and 26
  28. 26 not 27
  29. 24 not 28
  30. Limit 29 to English language

Appendix 2. Seven full text articles assessed for eligibility (comparing algorithms, including costing)

Appendix 3. Testing schematics

Public Health England, 2014: hepatitis B virus serology – HBsAg confirmation by alternative assay.

Public Health England, 2014: hepatitis B virus serology – HBsAg confirmation by alternative assay

Public Health England 2014: hepatitis B surface antigen (HBsAg) confirmation by neutralization.

Public Health England 2014: hepatitis B surface antigen (HBsAg) confirmation by neutralization

Public Health England, 2014: hepatitis B surface antigen confirmed reactives.

Public Health England, 2014: hepatitis B surface antigen confirmed reactives

Australia Government, 2012: suspected acute HBV.

Australia Government, 2012: suspected acute HBV

Australia Government 2012: suspected chronic HBV.

Australia Government 2012: suspected chronic HBV

Peng et al. 2011.

Peng et al. 2011

Annex 5.6. PICO 4 - How to test (HCV)
Diagnostic strategies for hepatitis C antibody detection: a meta-analysis and review of the literature

Authors

; Team lead: ,* ,* , , and . and .

Affiliations

1 London School of Hygiene and Tropical Medicine team
2 London School of Hygiene and Tropical Medicine team
* Co-leaders of this review

1. Executive summary

Background: An estimated 130–150 million people have chronic hepatitis C infection worldwide, leading to 350 000–500 000 deaths per year. Although HCV treatment is successful in a majority of people, most HCV-infected individuals remain undiagnosed and untreated. Advances in HCV detection technology create new opportunities for enhancing screening, referral, and treatment.

Methods: A comprehensive literature search algorithm, including Internet searches, using the components hepatitis C, screening, and testing strategies were applied. We reviewed observational studies and randomized controlled trials (RCTs) that provided original data from patient specimens. Our goal was to compare the effects of two broad strategies for hepatitis C antibody detection – one-test strategies and two-test strategies on diagnostic accuracy, costs, and resource utilization.

Results: Our search resulted in 3060 literature review references and 3 additional Internet references for PICO 4. Screening of titles/abstracts resulted in the selection of 8 articles for possible data extraction. Two of these 8 articles met all of the data extraction inclusion criteria so no articles were identified as final selection for PICO 4; comparing the diagnostic accuracy, cost or effectiveness of two different testing algorithms. These 8 articles are discussed in more detail – 1 of the articles provided a comprehensive overview of antibody/antigen testing; 2 articles delved into core antigen testing; 3 articles exemplified other testing such as recombinant immunoblot (IB) tests, signal-to-cut-off ratios, point-of-care tests (POCT), and antibody-based rapid diagnostic tests (RDT); 1 discussed testing strategies; 1 provided a look at comparison and cost–effectiveness of given testing strategies.

Conclusions: Two studies compared the diagnostic accuracy, cost, cost–effectiveness of a 1-test versus 2-test strategy for detection of HCV antibody. One study found that in individuals who are HCV antibody positive, the use of an IB assay with defined signal-to-cut-off ratios can be used to distinguish between those who are viraemic and those who are not. This reduces the number of nucleic acid tests (NATs) required to confirm active infection is a cost–effective strategy. Another study found that screening with a highly sensitive EIA followed by another EIA as confirmation assay in a routine clinical laboratory can be effective in nonimmunocompromised populations. In immunocompromised patients, IB may be more effective as these patients tend to have low antibody levels.

2. Background

Hepatitis C virus

Hepatitis C virus (HCV) causes acute infection which can progress to chronic infection and liver disease.1,2 An estimated 130–150 million people have chronic hepatitis C infection worldwide, leading to 350 000–500 000 deaths per year.13 Approximately 15–45% of individuals who have acute HCV infection will spontaneously clear it without any treatment. Most individuals will go on to develop chronic active HCV infection which is defined by the presence of HCV RNA.13 Although HCV treatment is successful in a majority of people, most HCV-infected individuals remain undiagnosed and untreated.4 As a result, approximately 15–30% of individuals with chronic HCV infection progress to cirrhosis, leading to end-stage liver disease and hepatocellular carcinoma.1,2

The recent introduction of direct-acting antivirals (DAAs) have led to sustained virological response (SVR) in greater than 90% of all individuals5,6 and are recommended by the WHO.7 DAAs will not only improve SVR rates, but also may simplify HCV management algorithms and allow smaller health facilities to manage HCV-infected individuals.8

In April 2014, the World Health Organization published guidelines for the screening, care, and treatment of individuals with HCV infection.9 These guidelines included recommendations on who to screen for HCV and how to confirm HCV infection, but not which tests are optimal for initial screening. A test for HCV antibody (Ab) is an important first step in the diagnosis of hepatitis C infection as the presence of Ab is a marker of exposure to HCV.

After an initial positive result for HCV Ab, supplementary testing can be undertaken in order to confirm active infection and facilitate entry into a care pathway. The detection of HCV Ab in blood can include rapid diagnostic tests, or enzyme immunoassays (EIA). Confirmation of the specificity of a reactive HCV Ab first-line test result can be carried out by repeating the HCV Ab testing in a different assay of similar sensitivity. Specificity is confirmed when this reagent abolishes reactivity in the assay.

WHO recommends standardized testing strategies to maximize the accuracy of hepatitis B and C testing while minimizing cost and increasing simplicity. This PICO question addresses the issue of whether a positive result from a single HCV Ab assay has sufficient specificity in order to proceed to supplementary testing and/or entry into a care pathway, or whether confirmatory testing on the same specimen with a different HCV Ab assay performed sequentially after the first assay is required. This is particularly relevant in low-prevalence settings where more than one assay may be required to confirm specificity.

Description of HCV antibody testing

Antibodies to HCV infection begin during early infection and persist throughout life in most individuals. Hence, an HCV Ab test is the best marker of exposure to HCV but cannot be used to distinguish between active and treated or resolved past infection.

Screening for exposure to HCV is dependent on assays that detect antibodies to HCV (anti-HCV). Once antibody status is confirmed, the patient can undergo supplementary testing to determine the presence of HCV RNA or core antigen (HCVcAg) as markers of active infection. It is important to note that the latest generation of assays designed to detect anti-HCV are combined with cAg to increase the sensitivity of the assay in detecting active infection.

The question this PICO aims to address is whether one or two serological assays (anti-HCV or HCV Ag/Ab combo assays) performed sequentially are required, in terms of specificity and positive predictive value, in order to proceed to supplementary testing.

PICO 4 Among persons identified for hepatitis C testing, what is the best testing strategy (diagnostic accuracy and other outcomes) for detection of HCV antibodies? (One-test versus two-test strategy) (Fig. 1A, 1B)
PPersons identified for HCV testing
I One-test strategy; One HCV Ab test (Fig. 1A)
C Two-test strategy; Two different HCV Ab tests (Fig. 1B)
ODiagnostic accuracy
True negatives (TN), who are screen negative, and do not have HCV infection.
False negatives (FN), who are screen negative but have HCV infection. These are incorrectly misclassified, and this may results in missed opportunity to recognize and prevent progression of liver disease.
True positives (TP), who are screen positive and have HCV infection.
False positives (FP), who are screen positive, but do not truly have HBV infection. These will have additional unnecessary tests and evaluation.
Costs (cost of testing strategy including lab reagents and running costs, cost of further evaluation of a false positive)
Cost–effectiveness
Acceptability to health-care worker and patients
Other outcomes (missed cases of liver disease because of false-negative results, Unnecessary referral, investigations and/or treatment in false positives)

Two systematic reviews on diagnostic performance of different hepatitis C serological assays focused on evaluating point-of-care tests compared to EIAs and other reference tests.10,11 None of the existing reviews compared one-test and two-test strategies for detection of hepatitis C Ab.

Fig. 1What is the best testing strategy for detection of HCVAb? (A. One test, B. Two-test strategy)

Fig. 1a. One-assay testing strategy for exposure to HCV (detection of anti-HCV).

Fig. 1aOne-assay testing strategy for exposure to HCV (detection of anti-HCV)

Fig. 1b. Two-assay testing strategy for diagnosis of HCV (detection of anti-HCV, followed by HCV RNA/core Ag).

Fig. 1bTwo-assay testing strategy for diagnosis of HCV (detection of anti-HCV, followed by HCV RNA/core Ag)

3. Objectives

  • To identify quantitative evidence on the sensitivity and specificity of one-test compared to two-test algorithms for detection of hepatitis C antibody
  • To evaluate the cost–effectiveness, acceptability, and other outcomes (missed liver disease because of false-negative results, unnecessary referral, investigations) associated with these two types of testing strategies
  • To inform models to optimize hepatitis C screening algorithms.

4. Methods

We reviewed observational studies and RCTs that provided original data from patient specimens. Our goal was to compare two broad strategies for hepatitis C antibody detection – one-test strategies and two-test strategies.

Search algorithm

Literature search strategies were developed by a medical librarian with expertise in systematic review searching. Our search algorithm consisted of the following components: hepatitis C, screening, and testing strategies (Annex 1).

We searched MEDLINE (OVID interface, 1946 onwards), EMBASE (OVID interface, 1947 onwards), the Cochrane Central Register of Controlled Trials (Wiley interface, current issue), Science Citation Index Expanded (Web of Science interface, 1970 onwards), Conference Proceedings Citation Index-Science (Web of Science interface, 1990 onwards), SCOPUS (1960 onwards), Literatura Latino-Americana e do Caribe em Ciências da Saúde (LILACS) (BIREME interface) and WHO Global Index Medicus. The search was supplemented by searching for ongoing studies in WHO’s International Clinical Trials Registry. The literature search was limited to the English language and human subjects.

We formulated a comprehensive and exhaustive search strategy in an attempt to identify all relevant studies. After the MEDLINE strategy was finalized, it was adapted to the syntax and subject headings of the other databases.

In addition to searching databases, we also searched the Internet for any peer-reviewed articles and conference abstracts that might have been missed through our librarian search and also expanded our search to national guidance documents.

5. Results

Study selection

The librarian search resulted in 3060 references for PICO 4. Because of overlap with objectives and search strategies between PICOs 3 and 4, and to expedite the initial screening, PICO 4 references were combined with the 3655 references identified through the librarian search for PICO 3 (HBV) for a total of 6715 references. 2388 searches were immediately excluded: the librarian excluded 835 as not relevant and there were 1553 duplicates; 4327 remained for screening. Titles/abstracts were screened according to protocol inclusion and exclusion criteria, for both PICOs 3 and 4; 4307 reports were excluded. Reasons for excluding them were noted (Fig. 2).

From the librarian search, 5 reports were identified for possible data extraction. The Internet searches resulted in 3 additional reports for possible data extraction. Full documents (manuscripts, abstracts, guidelines, etc.) were obtained and assessed against inclusion criteria. Papers were either accepted or rejected and reasons for rejection were explained.

Fig. 2. PRISMA for PIC0 4 HCV (diagnostic strategies for hepatitis C antibody detection).

Fig. 2PRISMA for PIC0 4 HCV (diagnostic strategies for hepatitis C antibody detection)

The following inclusion criteria were used to evaluate the final selection: evaluations of HCV testing strategies; evaluations based on human clinical materials. The following exclusion criteria were used: studies only focused on evaluation of single-test assays without a two-test comparator group; studies focused on two-test strategies that include other types of test (e.g. HCV RNA) studies with primary aims other than evaluation of testing strategies; studies related to disease prevalence, drug resistance, genotyping, sequencing, or non-diagnostic purposes; articles in languages other than English, conference abstracts.

Study characteristics

Of the 8 selected for possible data extraction, the following variables were collected, when available: first author, title, year, objective, and exclusion criteria (Table 2).

Table 2Eight reports assessed for eligibility

Author or source, yearTitleObjectiveExclusion criteriaConclusions
1.Cresswell. et al. 2014Hepatitis C core antigen testing: a reliable, quick and potentially costeffective alternative to hepatitis C polymerase chain reaction in diagnosing acute hepatitis C virus infectionTo compare the utility of HCV core-antigen compared to qRT-PCR in the diagnosis on acute HCV in an HIVpositive cohortNo comparison of testing strategiesHCV core-antigen detection compared to HCV PCR is a quick, simple, cost–effective test in screening for acute HCV
2.Krajden 2000Hepatitis C virus diagnosis and testingTo identify how antiHCV serology and NAT can be combined to provide a definitive answer as to whether or not an individual has been or is actively infectedNo data/not a studyReport describes how antiHCV serology and NAT can be combined to provide a definitive answer as to whether or not an individual has been or is actively infected
3.Njouom 2006A cost-effective algorithm for the diagnosis of hepatitis C virus infection and prediction of HCV viraemia in CameroonTo describe the accuracy of an algorithm that combines two HCV rapid tests to diagnose and predict viraemia of HCV in CameroonNo comparison of testing strategiesA comparison of 2 HCV rapid tests suggests an algorithm using the more sensitive test first to screen followed by the 2nd test to discriminate between viraemic and non-viraemic HCV seropositive subjects. Not relevant for this review as the second test is for HCV RNA
4.Shivkumar 2012Accuracy of rapid and point-of-care screening tests for hepatitis C: a systematic review and meta-analysisTo review evidence on the diagnostic performance of globally available RDTs and POCTs to screen for hepatitis CNo comparison of testing strategiesPOCTs (blood) have highest accuracy, followed by RDTs (serum, plasma) and POCTs (oral fluids). RDTs and POCTs may be useful in expanding first-line screening for hepatitis C
5.Tillmann 2014Hepatitis C virus core antigen testing: role in diagnosis, disease monitoring and treatmentTo review the current knowledge on 4 newer assays with decreased sensitivity, in different scenarios and reflect on their utilityNo comparison of testing strategiesHCV core antigen has relative strong role in a diagnostic algorithm for HCV infection, while it is too insensitive in its present form to substitute for HCV RNA testing in the blood bank setting
6.Barreto 2008Cost–effective analysis of different algorithms for the diagnosis of hepatitis C virus infectionTo compare diagnostic performance and cost–benefit of two new algorithms with the conventional one in Brazilian blood donors who showed positive or inconclusive anti-HCV results in screening testsStudy was performed using blood donorsStudy evaluated and costed 3 algorithms (2 CDC algorithms and Brazilian). The more practical and economical algorithm requires the establishment of a specific level of signal-to-noise ratio to determine the need for reflex supplemental testing (i.e. immunoblot anti-HCV)
7.Vermeersch 2008Validation of a strategy for HCV antibody testing with two enzyme immunoassays in a routine clinical laboratoryTo compare the performance of a strategy using AxSYM HCV 3.0 as screening test and Monolisa Plus anti-HCV version 2 as confirmation to AxSYM-pos sera with PCR and immunoblotComparison of testing strategiesMonolisa Plus can be used as an alternative to immunoblot for the confirmation of AxSYM-positive sera
8.CDC MMWR 2013Testing for HCV infection: an update of guidance for clinicians and laboratoriansTo provide guidance to for clinicians and laboratorians on testing for HCV infectionNo data/not a studyUpdate to CDC guidance for diagnosis of acute hepatitis C: rapid or a laboratory-conducted assay for HCV antibody, reactive followed by NAT for HCV RNA

References listed in Annex 2.

Of the 8 included reports, 6 described algorithms with the types of tests used (Table 3). Reports 1–4 were excluded from the systematic review as they did not compare testing strategies. Two studies, Boretto et al. (2008) and Vermeersch et al. (2008), determined costs and effectiveness.

Table 3Six reports of HCV testing algorithms

ReportTest 1Test 2Test 3Test 4Exclusion Criteria
1Cresswell

2014
HCV coreantigenHCV RNAHCV AbNo comparison of testing strategies
2*Njouom

2006
Anti-HCV EIAHCV RNA PCRNo comparison of testing strategies
Anti-HCV EIAHCV RNA PCRRTRT
3*Tillmann

2014
Anti-HCV testingRIBARNA PCRNo comparison of testing strategies
4*CDC

2013
HCV antibodyHCV RNANo data/not a study
5*Barreto

2008
See schematic below (algorithm depends on a specific level of signal-to-cut-off ratio)Study was performed using blood donors
6VermeerschMEIAConfirm by EIA
MEIAConfirm by PCRConfirm by immunoblot
*

Algorithm schematics shown in Annex 3.

Although the study of Barreto et al. was conducted in a blood donor setting, the study did compare 3 testing strategies and determined cost–effectiveness. In this study the authors recognized that new anti-HCV tests have increased sensitivity but it means that there may be more false-positive results. These tests would be falsely negative in individuals who are newly infected as antibodies are absent or at low levels during this immunological window period. The use of a confirmatory diagnostic assay that targets different antigens can lower the risk of detecting false reactive results. Supplemental testing can be used to ensure a reliable diagnosis but this also means increased costs.

The authors compared 2 CDC algorithms to the national Brazilian algorithm to determine effectiveness and cost–benefit. The figure below depicts the testing of 517 individuals identified as ELISA-positive or inconclusive by anti-HCV test using 3 different algorithms. Algorithms A and B are the CDC recommended algorithms while Algorithm C is the national Brazilian algorithm.

Image annex5f52

The authors found that all three algorithms had similar diagnostic performance, revealing a remarkable agreement in the results obtained by the algorithms. As shown above, PCR was performed to resolve indeterminate results from immunoblots (139 samples from algorithm A and 141 samples from conventional algorithm C).

Algorithm A (CDC) was recommended for populations with a high prevalence of HCV infection. The algorithm showed high concordance with true-positive results. IB testing was required only for weakly reactive samples.

Algorithm B (CDC) used PCR to speed up clinical decision and was found more suitable for the immunosuppressed patient population for whom the IB test could represent a problem because of its low antibody level, leading to occasional false-negative results.

Algorithm C (Brazil) was found to be useful for determining the immune status of the patients against HCV infection and also for confirming the specificity of positive enzyme-linked immunoassay (ELISA) results. It is recommended for low prevalence populations for which false-positive antibody results are usually high. However, in the present study, this algorithm yielded a high frequency of IB-indeterminate results, producing no conclusive diagnosis. This algorithm also did not differentiate between active and past infections.

While algorithms A and B were found to be highly sensitive, the choice of an algorithm must take into account its purpose, the population and the prevalence of HCV infection, as well as the financial and infrastructure conditions of the laboratory. In the end they concluded that algorithm A is the best in terms of cost and feasibility, and particularly suitable for laboratories in resource-limited settings as it minimizes the number of samples requiring supplemental testing. Supplemental PCR tests were still required to detect active infection.

The Vermeersch study also investigated the CDC guidelines, specifically the required confirmation of HCV screening-test-positive sera with a low signal/cut-off (S/CO) ratio by recombinant immunoblot or PCR. The UK Health Protection Agency suggested that a second EIA could be used as an alternative for confirmation in non-immunocompromised patients. A total of 17 936 consecutive in-house sera were evaluated in this study; AxSYM-positive sera were tested by Monolisa Plus and confirmed with IB (per CDC guidelines) or PCR.

This study specifically determined the performance of a strategy using AxSYM as screening test and Monolisa Plus as confirmation assay in a routine clinical laboratory and found that Monolisa Plus can be used as an alternative to immunoblot for the confirmation of AxSYM-positive sera in nonimmunocompromised. Although the study of Barreto et al. was conducted in a blood donor setting, the study did compare 3 testing strategies and determined cost–effectiveness.

Cost

Barreto et al. performed a cost–effective analysis of the two CDC-recommended algorithms compared to the current Brazilian national algorithm for the diagnosis of HCV infection. The cost of each algorithm depended on the number of supplemental tests required.

Algorithm A (CDC)Algorithm B (CDC)Algorithm C (Brazil)
Based on signal-to-cut-off (s/co) ratio of ELISA anti-HCV samples that show s/co ratio ≥95% concordance with immunoblot (IB) positivity.

US$ 21 299.39

This was determined to be the more practical and economical one since it requires supplemental tests for only 54% of the samples
Reflex nucleic acid amplification testing by PCR was required for ELISApositive or -inconclusive samples and IB for PCR-negative samples

US$ 32 397.40

This one provided early information about the presence of viraemia
All positive or inconclusive ELISA samples were submitted to immunoblot

US$ 37 673.79

Quality assessment

Study quality was not evaluated using the QUADAS-2 tool12 and the STARD checklist, as these do not apply to the two studies.13

6. Discussion

Although none of the studies met inclusion criteria, eight references were identified that might be useful for modelling exercises to address this PICO question. This short narrative will provide an overview of these 8 articles, also drawing on other informative reviews and personal communications.

Antibody and antigen tests

In 2000, Krajden described strengths and weaknesses of serological and molecular tests for diagnosing hepatitis C. In general, serological tests detect antibodies to hepatitis C while molecular tests detect or quantify HCV RNA. This combination of an antibody test followed by a confirmatory NAT (RNA) has generally been accepted.

HCV antibody detection by enzyme immunotests (EIA) are simple, inexpensive, and often less time consuming, although they cannot distinguish between acute, active or chronic, non-viraemic HCV infection. In chronically infected persons, EIA sensitivity approaches 97–99% while in acutely infected individuals, EIA sensitivity is as low as 50–70%. The rapid antibody tests are typically more expensive and not designed for testing large batches of specimens. However, in non-clinical (field) settings and laboratories that conduct low-volume testing, adoption of rapid testing can be cost-effective.

Nucleic acid testing (NAT) remains the gold standard for identifying active infection (HCV RNA is detectable in serum or plasma as early as 1 week after exposure) but is costly, requires skilled technicians, extensive equipment and reagents, and a robust transport system to ensure sample integrity. The various forms of NAT testing include polymerase chain reaction (PCR), branched DNA signal amplification, and transcription-mediated amplification. NATs exhibit high specificities of up to 99% across all 6 genotypes of HCV.

Recently, HCV core antigen testing has become widely commercially available. Two of the eight papers selected for this narrative discussed HCV core antigen testing (Cresswell 2014; Tillmann 2014). Tillmann describes the use of core testing as a serological test capable of identifying active infection, and as a possible replacement for NAT as a confirmatory test. Overall, the core test is less sensitive than HCV RNA tests, but as Tillmann reports, more than 50% of anti-HCV positive persons will be HCV core antigen positive making core antigen testing a cost–effective reflex test to confirm infection, and can easily be applied on the same platform.

(Current HCV RNA assays have a lower level of detection between about 5–15 IU/mL. The sensitivity for the currently available HCV core antigen assay by Abbott was improved to about 3.00 fmol/L [0.0 6 pg/mL].)

Cresswell examined the efficacy and cost of HCV core antigen in diagnosing acute HCV in a high-risk, high-prevalence population (HIV-positive cohort of MSM). Compared to HCV NAT PCR, core antigen proved sensitive (100%), specific (97.9%), and cost–effective. In their cohort, they calculated cost per individual tests to be $108 for PCR versus $23.4 for HCV cAg. Their conclusion was that in high-risk, high-prevalence populations, the core test can be used as a quick, simple and cost–effective test in screening for acute HCV.

Other possible tests

Three other possibilities for testing were discussed in the literature and briefly mentioned here; recombinant immunoblot tests, signal-to-cut-off ratios and point-of-care tests (POCT) and antibody-based rapid diagnostic tests (RDT).

IBs are highly specific serological tests. They can be performed on the same sample used in the screening test; however, they are not amenable to routine use, as they do not have high sensitivity, are costly, with a testing procedure that is technically complex, and lengthy. Confirmation of active infection still requires testing for HCV RNA.

The CDC guidelines now include an option to use signal-to-cut-off ratios to limit the number of samples needing supplemental testing. Signal-to-cut-off ratios are test specific and slightly complicated to put in use and interpret. This approach might be better suited in a clinical laboratory setting (reference laboratory) that would use only one test, employ skilled technicians, and have a high volume throughput.

Shivkumar (2012) published a meta-analysis specifically on diagnostic accuracy of POCTs and RDTs to screen for hepatitis C. This analysis showed POCTs of blood (serum, plasma, or whole blood) have the highest accuracy, followed by RDTs of serum or plasma and then by POCTs of oral fluids. More evidence is needed to consider using these newer tests in a diagnostic algorithm.

Testing recommended for select populations

Many of the articles identified through the librarian search did not meet the inclusion criteria because they recommended HCV testing in select populations based on demography, prior exposures, high-risk behaviours, and medical conditions.

For example, one-time HCV testing is recommended for persons born between 1945 and 1965, without prior ascertainment of risk. Smith et al. (2012) note that the cost– effectiveness of one-time birth cohort testing is comparable to that of current risk-based screening strategies. Other major groups discussed under “risk behaviours” or “risk exposures” include injection drug use, children born to HCV-infected women, HIV infection. Because these studies were so specific to populations, they were not included as applicable to PICO 4.

Testing strategies

CDC MMWR (2013) describes CDC guidelines for HCV diagnostic testing: an anti-HCV test, and if the result is positive, active infection should be confirmed by a sensitive HCV RNA test. CDC recommends using US Food and Drug Administration (FDA)-approved tests (laboratory-based tests and POCT) such as OraQuick HCV rapid antibody test which has sensitivity and specificity similar to those of FDA-approved laboratory-based HCV antibody tests). An FDA-approved quantitative or qualitative NAT with a detection level of 25 IU/mL or lower should be used to detect HCV RNA.

Persons positive for an anti-HCV test and negative for HCV PCR RNA are informed that they do not have current (active) HCV infection, with no further testing necessary, unless there are ongoing risk factors for and suspicion of recent infection. In this case, repeat HCV RNA test is recommended.

To determine if the HCV antibody test represents a remote HCV infection that has resolved (true positivity) or a false-positive result (biological false positivity), CDC recommends a second FDA-approved HCV antibody test that is different from the test used for initial antibody testing. A biological false result is not likely to occur with 2 different tests (Vermeersch 2008).

For patients with no apparent risk for HCV infection, the likelihood of a false-positive HCV antibody test is directly related to the HCV prevalence in the tested population; false-positive test results for anti-HCV are most common for populations with a low prevalence of HCV infection.

Njoum et al. (2006) performed a study in Cameroon comparing HCV rapid tests. In this study, using the more sensitive test first to screen followed by the second test to discriminate between viraemic and non-viraemic HCV seropositive proved to be a cost–effective algorithm for the diagnosis of HCV infection and prediction of HCV viraemia in Cameroon. The two rapid tests evaluated were the ImmunoComb® II HCV assay and Hexagon® HCV assay. The ImmunoComb® II HCV test had a higher sensitivity than the Hexagon® HCV assay for detecting anti-HCV.

ImmunoComb IIHexagonReference assay
Sensitivity99.464.0HCV antibody detection
Specificity89.9100.0
Sensitivity100.087.7HCV RNA detection
Specificity2.193.6

Their study did not actually report on cost but mentioned that EIAs are less expensive than PCR technology and in this case a second EIA can be substituted in the algorithm for the confirmatory PCR test.

7. Conclusions and recommendations for research

  • Two studies compared the diagnostic accuracy, cost, cost–effectiveness of a one-test versus two-test strategies for detection of HCV antibody. One study found that in individuals who are HCV antibody positive, the use of an immunoblot assay with a defined signal-to-cut-off ratio can be used to distinguish between those who are viraemic and those who are not. This reduces the number of NATs required to confirm active infection is a cost–effective strategy.
  • The challenge of using immunoblot assays is that they are lengthy and technically complex laboratory procedures, often leading to indeterminate results.
  • Another study found that screening with a highly sensitive EIA followed by another EIA as confirmation assay in a routine clinical laboratory can be effective in nonimmunocompromised populations. In immunocompromised patients, immunoblot is more effective as these patients tend to have low antibody levels.

References

1.
Hepatitis C (No. 164) [Fact sheet]. Geneva: WHO; 2014.
2.
Lavanchy D . The global burden of hepatitis C. Liver Int. 2009;29(s1):74–81. [PubMed: 19207969]
3.
Mohd Hanafiah K , GroegerJ, FlaxmanAD, WiersmaST. Global epidemiology of hepatitis C virus infection: new estimates of age-specific antibody to HCV seroprevalence. Hepatology. 2013;57(4):1333–42. [PubMed: 23172780]
4.
Papatheodoridis G , TsochatzisE, HardkeS, WedemeyerH. Barriers to care and treatment for patients with chronic viral hepatitis in europe: a systematic review. Liver Int. 2014;34(10):1452–63. [PubMed: 24750532]
5.
Feeney ER , ChungRT. Antiviral treatment of hepatitis C. BMJ. 2014;348g3308. [PMC free article: PMC6880951] [PubMed: 25002352]
6.
Pawlotsky JM . New hepatitis C therapies: the toolbox, strategies, and challenges. Gastroenterology. 2014;146(5):1176–92. [PubMed: 24631495]
7.
Guidelines for the screening, care and treatment of persons with hepatitis C infection. Geneva: WHO; 2014. [PubMed: 25535634]
8.
Soriano V , LabargaP, Fernández-MonteroJV, BenitoJM, PovedaE, RallonNet al. The changing face of hepatitis C in the new era of direct-acting antivirals. Antivir Res. 2013;97(1):36–40. [PubMed: 23147192]
9.
Duskova D , DarebnicekL. Nucleic acid testing of hepatitis B virus, hepatitis C virus, and human immunodeficiency virus 1, 2 in blood donors in the General University Hospital, Prague. Acta Virol. 2014;58(2):146–51. [PubMed: 24957719]
10.
Khuroo MS , KhurooNS, KhurooMS. Diagnostic accuracy of point-of-care tests for hepatitis C virus infection: a systematic review and meta-analysis. PloS One. 2015;10(3):e0121450. [PMC free article: PMC4376712] [PubMed: 25816332]
11.
Shivkumar S , PeelingR, JafariY, JosephL, PantPai N. Accuracy of rapid and point-of-care screening tests for hepatitis C: a systematic review and meta-analysis. Ann Intern Med. 2012;157(8):558–66. [PubMed: 23070489]
12.
Whiting PF , RutjesAW, WestwoodME, MallettS, DeeksJJ, ReitsmaJBet al. QUADAS-2: a revised tool for the quality assessment of diagnostic accuracy studies. Ann Intern Med. 2011;155(8):529–36. [PubMed: 22007046]
13.
Bossuyt PM , ReitsmaJB, BrunsDE, GatsonisCA, GlasziouPP, IrwigLMet al. The STARD statement for reporting studies of diagnostic accuracy: explanation and elaboration. Ann Intern Med. 2003;138(1):W1–W12. [PubMed: 12513067]

Appendices

Appendix 1. Librarian search

31.

Hepatitis, Viral, Human/

32.

Hepatitis Viruses/

33.

Hepatitis Antibodies/

34.

exp Hepadnaviridae Infections/

35.

Hepatitis C Antibodies/

36.

Hepatitis B virus/

37.

Hepadnaviridae/

38.

Hepatitis B Surface Antigens/

39.

(heptatitis-b or hep-b or (hepatitis adj5 b) or (hep adj5 b) or hbv).ti,ab.

40.

hbsag.ti,ab.

41.

exp Hepatitis C/

42.

Hepacivirus/

43.

Hepatitis C Antibodies/

44.

(heptatitis-c or hep-c or (hepatitis adj5 c) or (hep adj5 c) or hcv or aghcv or hepacivirus*).ti,ab.

45.

hcvab.ti,ab.

46.

or/1–15 [HEP B or HEP C]

47.

exp Mass Screening/

48.

screen*.ti,ab.

49.

17 or 18 [MASS SCREENING]

50.

(one-test* or two-test*).ti,ab.

51.

(“1-test*” or “2-test*”).ti,ab.

52.

((one or two or “1” or “2” or strateg* or algorithm* or approach or procedure* or system*) adj5 (test or tests or testing or detect* or diagnos* or kit or kits or assay* or device*)).ti,ab.

53.

or/20–22 [TESTING STRATEGIES]

54.

16 and 19 and 23

55.

Humans/

56.

Animals/

57.

25 and 26

58.

26 not 27

59.

24 not 28

60.

limit 29 to english language

Appendix 2. Eight full-text articles assessed for eligibility (comparing algorithms, including costing)

  • Barreto AM , TakeiK, ECS, BellesaMS, SallesNA, BarretoCCet al. Cost-effective analysis of different algorithms for the diagnosis of hepatitis C virus infection. Braz J Med Biol Res. 2008;41(2):126–34. [PubMed: 18235967]
  • Centers for Disease C, Prevention. Testing for HCV infection: an update of guidance for clinicians and laboratorians. MMWR Morb Mortal Wkly Rep. 2013;62(18):362–5. [PMC free article: PMC4605020] [PubMed: 23657112]
  • Cresswell FV , FisherM, HughesDJ, ShawSG, HomerG, Hassan-IbrahimMO. Hepatitis C core antigen testing: a reliable, quick, and potentially cost-effective alternative to hepatitis C polymerase chain reaction in diagnosing acute hepatitis C virus infection. Clin Infect Dis. 2015;60(2):263–6. [PubMed: 25301216]
  • Krajden M . Hepatitis C virus diagnosis and testing. Can J Public Health. 2000;91 (Suppl 1):S34–S39, S6–S42. [PubMed: 11059131]
  • Njouom R , TejiokemMC, ZangaMC, PouillotR, AyoubaA, PasquierCet al. A cost-effective algorithm for the diagnosis of hepatitis C virus infection and prediction of HCV viremia in Cameroon. J Virol Methods. 2006;133(2):223–6. [PubMed: 16360220]
  • Shivkumar S , PeelingR, JafariY, JosephL, PantPai N. Accuracy of rapid and point-of-care screening tests for hepatitis C: a systematic review and meta-analysis. Ann Intern Med. 2012;157(8):558–66. [PubMed: 23070489]
  • Tillmann HL . Hepatitis C virus core antigen testing: role in diagnosis, disease monitoring and treatment. World J Gastroenterol. 2014;20(22):6701–6. [PMC free article: PMC4051911] [PubMed: 24944462]
  • Vermeersch P , Van RanstM, LagrouK. Validation of a strategy for HCV antibody testing with two enzyme immunoassays in a routine clinical laboratory. J Clin Virol. 2008;42(4):394–8. [PubMed: 18448386]

Appendix 3. Testing schematics

Vermeersch et al. 2008.

Vermeersch et al. 2008

Tillman et al 2014.

Tillman et al 2014

Njoum et al. 2006.

Njoum et al. 2006

Baretto et al. 2008.

Baretto et al. 2008

CDC MMWR 2013.

CDC MMWR 2013

Annex 5.7. PICO 6 - How to test (confirmation of HCV viraemia)
Diagnostic accuracy of HCV RNA tests to detect active HCV infection: a meta-analysis and review of the literature

Authors

; Team lead: ,* ,* , , , , , , and .

Affiliations

1 London School of Hygiene and Tropical Medicine team
* Co-leaders of this review

1. Executive summary

Background: Advances in hepatitis C virus detection technology create new opportunities for enhancing screening, referral and treatment. The purpose of this review was to determine the accuracy of qualitative NAT methods versus quantitative NAT methods for HCV RNA for detection and/or quantification to confirm active HCV infection.

Method: A literature search was conducted focused on hepatitis C, diagnostic tests and diagnostic accuracy. Studies were included if they evaluated an assay to determine the sensitivity and specificity of a single qualitative hepatitis C RNA test compared to a quantitative HCV RNA reference among humans. Two reviewers performed a quality assessment of the studies and extracted data for estimating test accuracy.

Results: Traditionally, qualitative nucleic acid amplification (NAT) assays are at least 10 times more sensitive than quantitative assays. This systematic review shows that for HCV, the lower limit of detection of most commercial qualitative assays was in the 10–15 IU/mL range measured against a WHO standard, whereas the lower limit of detection for quantitative assays is at 600–1100 IU/mL. This systematic review shows that the sensitivity of HCV viral quantitative assays range from 87% to 100% compared to qualitative assays.

Conclusions: Although HCV qualitative assays have a lower limit of detection than quantitative assays, the range of sensitivity found in this systematic review demonstrate that HCV viral loads are rarely in the lower range of the limit of detection of these quantitative assays. New technology platforms are now available which have linear range of quantitation between 12 and 108 IU/mL, with the result that there is no longer any difference between the lower limit of detection of a qualitative assay compared to a quantitative assay. New point-of-care (POC) devices for quantitation of HCV viral load will soon be available. These devices are more affordable than the laboratory-based assays and can potentially be used to improve access to HCV detection and treatment monitoring.

2. Background

Hepatitis C is a liver disease caused by the hepatitis C virus (HCV) that causes acute and chronic infection.1,2 An estimated 130–150 million people have chronic hepatitis C infection worldwide, leading to 350 000–500 000 deaths per year.13 Although HCV treatment is successful in a majority of people, most HCV-infected individuals remain undiagnosed and untreated.4 As a result, approximately 15–30% of individuals with chronic HCV infection progress to cirrhosis, leading to end-stage liver disease and hepatocellular carcinoma.1,2

Rapid detection of HCV is essential for prevention of the progression of the disease into the chronic phase. Qualitative nucleic acid testing (NAT) allows for a rapid and sensitive detection of the virus as well as evidence of viral RNA load falling below a clinical threshold.4 Quantitative testing is useful for measuring of viral burden and treatment response.5 Both methods are essential in the detection of active HCV infection, though there is scare research comparing the two NAT methods for this purpose.

In April 2014, the World Health Organization (WHO) published guidelines for the screening, care and treatment of individuals with HCV infection.6 These guidelines included recommendations on who to screen for HCV and how to confirm HCV infection, but not which tests are optimal for initial screening. The World Health Assembly has passed several resolutions highlighting the importance of viral hepatitis for global health.

Advances in HCV detection technology create new opportunities for enhancing screening, referral and treatment. Previous systematic reviews on hepatitis C infection have focused on treatment response,7,8 clinical complications,9 and epidemiology.10,11 Two systematic reviews on hepatitis C testing focused on evaluating point-of-care tests compared to EIAs and other reference tests.12,13 This review instead focuses on individuals with detectable HCV antibodies to evaluate qualitative versus quantitative detection methods to confirm active HCV infection.

The purpose of this review was to identify evidence on the sensitivity and specificity of qualitative HCV RNA tests compared to quantitative HCV RNA tests for the detection of active HCV infection, to summarize the key test characteristics associated with detection of active HCV infection.

PICO 6Among HCV Ab positive patients, what is diagnostic test accuracy of qualitative NAT methods versus quantitative NAT methods for HCV RNA for detection and/or quantification to confirm active HCV infection?
PPersons with detectable HCV antibodies
IQualitative NAT methods
CQuantitative NAT methods
ODiagnostic accuracy:
True negatives (TN), who are screen negative and do not have HCV infection.
False negatives (FN), who are screen negative but have HCV infection, These are incorrectly misclassified and this may results in missed opportunity to recognise and present progression of liver disease.
True positives (TP), who are screen positive and have HCV infection.
False positives (FP), who are screen positive, but do not truly have HCV infection. These will have additional unnecessary tests and evaluation.
Costs (Cost of testing strategy including lab reagents and running costs, cost of further evaluation of a false positive)
Cost–effectiveness
Acceptability to health-care worker and patients

3. Objectives

The purpose of this review was to identify evidence on the sensitivity and specificity of qualitative HCV RNA tests compared to quantitative HCV RNA tests for the detection of active HCV infection and to summarize the key test characteristics associated with detection of active HCV infection.

4. Methodology

We followed standard guidelines and methods for systematic review and meta-analyses of diagnostic tests.14,15 We prepared a protocol for the literature search, article selection, data extraction and assessment of methodological quality.

Selection criteria

Types of studies

We included observational and RCT studies that provide original data from patient specimens, including cross-sectional and case–control studies and studied qualitative NAT tests used to detect HCV RNA compared to a reference standard of quantitative HCV RNA tests.

Participants

Little information on participants was provided in the selection of papers included in the systematic review; therefore, we set a wide inclusion criterion. We included patients of all age groups from all settings and countries as well as all types of specimens.

Index tests

Studies that utilized a commercially available HCV NAT test were eligible for inclusion. The following seven are the index tests included:

  • AMPLICOR HCV test, version 2.0, Roche
  • CAP/CTM, Roche
  • COBAS AMPLICORTM HCV Test v1.0 assay, Roche
  • COBAS AMPLICORTM HCV Test v2.0 assay, Roche
  • COBAS HCM-2, Roche
  • Real-Time Assay, Abbott
  • Versant HCV genotype assay, Bayer.

Reference standard

The reference standards accepted for a definitive diagnosis included tests for detection of HCV RNA by the following quantitative NAT techniques: polymerase chain reaction (PCR), branched-chain DNA (bDNA), or transcription mediated amplification (TMA). The performance characteristics of NATs are very similar above 50 IU/mL; thus all NATs were considered as one reference standard.

Outcome measures

Sensitivity refers to the proportion of samples with true HCV infection diagnosed with positive qualitative NAT tests confirmed with a positive quantitative NAT tests.

Specificity refers to the proportion of samples with negative qualitative NAT tests confirmed with a negative quantitative NAT tests.

Search methods

A database search of LILACS, MEDLINE, EMBASE, PubMed, Scopus, Web of Science, Cochrane and WHO Global Index Medicus was performed through April 2015. No language restriction was applied. The references of published articles found in the above databases were searched for additional pertinent materials.

Study selection proceeded in three stages. First, titles/abstracts were screened by a single reviewer according to standard inclusion and exclusion criteria. Second, full manuscripts were obtained and assessed against inclusion criteria. Papers were accepted or rejected and reasons for rejection were specified. Third, two independent reviewers assessed each manuscript and differences were resolved by a third independent reviewer.

Data extraction

Information on the following variables were extracted by a reviewer if the study met the exclusion and inclusion criteria: first author, total sample size, country (and city) of sampling, sample type (oral fluid, finger-prick, venous blood, etc.), point-of-care (Y/N), eligibility criteria, reference standard, manufacturer, raw cell numbers (true positives, false negatives, false positives, true negatives), sources of funding and reported conflict of interest. We define point-of-care as being able to give a result within 60 min and having the results guide clinical management at the same encounter.

Assessment of methodological quality

Study quality was evaluated using the QUADAS-2 tool,14 the STARD checklist15 and the GRADE method.16 QUADAS includes domains to evaluate bias in the following categories: risk of bias (patient selection, index test, reference standard, flow and timing); applicability concerns (patient selection, index test, reference standard). The GRADE method evaluates the strength of evidence by assessing the risk and probability of bias, imprecision and inconsistency as well as dose-respondent gradient and residual confounding.16

5. Results

PRISMA flowchart

A total of 17 109 citations were identified and 9623 duplicates were removed. Each of the 7486 titles was examined according to pre-specified inclusion and exclusion criteria. A total of 4 research studies were included in the final analysis (Fig. 1 below).

Fig. 1. PRISMA flow diagram outlining study selection examining diagnostic accuracy HCV RNA tests to detect active HCV infection.

Fig. 1PRISMA flow diagram outlining study selection examining diagnostic accuracy HCV RNA tests to detect active HCV infection

Characteristics of included studies

A total of four studies met the PICO criteria and data was extracted from each of these studies. Two of the four studies took place in the United States of America, with the remaining two in Taiwan and Germany. Of these studies only one included a population of patients at risk of HCV infection, while the others were either patients who have an acute or chronic HCV infection. The assays evaluated in these analyses were Abbott Real-Time Assay, AMPLICOR HCV test, v2.0 assay, COBAS AMPLICORTM HCV Test v2.0 assay and Versant HCV genotype assay.

This systematic review shows that for HCV, the lower limit of detection of most commercial qualitative assays was in the 10–15 IU/mL range measured against a WHO standard, whereas the lower limit of detection for quantitative assays is at 600–1100 IU/mL. The sensitivities of qualitative NAT methods reported in the selected articles showed a relatively wide range (87–100%), contrary to the narrow range reported for specificity (97–100%).

A large limitation in the quality of the studies was a lack of information on the populations studied, randomization and sample collection as well as poor standardization in the evaluation of diagnostic test accuracy.

Table 1Description of study design, study population and setting of all studies (n=4)

NoFirst author, countrySample type and numberStudy populationDiagnostic test (quantitative)Reference test (qualitative)SensitivitySpecificity
1Lee, 2000, United States of AmericaSerum N = Not statedPatients at risk of HCV infectionAMPLICOR HCV test, version 2.0 RocheCOBAS AMPLICORTM HCV Test v2.0 assay. Roche94%97%
2Yu 2000, TaiwanSerum N = 215Patients with chronic hepatitis CCOBAS HCM-2 RocheCOBAS AMPLICORTM HCV Test v2.0 assay. Roche95%
3Ferreira-Gonzalez, 2007, United States of AmericaPlasma N = 76Patients with HCV infectionVersant HCV genotype assay, BayerCOBAS AMPLICORTM HCV Test v1.0 assay Roche100%100%
4Sarrazin, 2008, GermanySerum N = 65Patients with HCV infectionVersant HCV genotype assay. Bayer CAP/CTM* RocheAbbott Real-time Assay87%
*

CAP/CTM= Roche Cobas Ampliprep/Cobas Taqman HCV assay

Lee et al. (2000) investigated the performance characteristics of AMPLICOR HCV test, version 2.0 Roche (quantitative assay) and COBAS AMPLICORTM HCV Test v2.0 assay Roche (qualitative assay). This was done by measuring the limit of detection, sensitivity, specificity, linear range, agreement between test formats and genotypic reactivity for both tests. The genotypic reactivity for both tests showed that samples with 10 copies per reaction yielded positive results at least 95% of the time for all genotypes with the exception of genotype 5. When testing for the agreement between test formats, it was shown that the COBAS AMPLICOR v.2 assay format produced values with a range of 0.02–0.13 log10 higher than those obtained for the AMPLICOR assay with samples containing titres within the linear range of the assays.

Yu et al. (2000) investigated the performance characteristics of COBAS HCM-2 (quantitative assay) compared to the COBAS AMPLICORTM HCV Test v2.0 assay (qualitative) and evaluated the clinical utility of COBAS HCM-2. This study looked at quantitative range, reproducibility of COBAS HCM-2 and linearity of HCV RNA quantifications. The quantitative range for the COBAS HCM-2 assay from 1.0 × 10³ to 3.88 × 10⁶ copies/mL and the within-run reproducibility showed serum HCV RNA levels with standard deviations of 0.03, 0.09 and 0.12. The linearity of HCV RNA quantifications ranged from 6.11, 6.44, 6.46 to 6.49 logs for genotypes 1b, 2a, 2b and 1b.

Ferreira-Gonzalez et al. (2007) evaluated the qualitative (COBAS Taqman HCV) against the quantitative (Versant HCV genotype assay, Bayer) using the same clinical specimens. Analytical sensitivity was measured by the ability of a system to detect replicates, both tests were capable of detecting all six replicates with 10 HCV RNA IU/mL and 100% of all replicates with 1.0 Log10 HCV RNA IU/mL.

Sarrazin et al. (2008) focuses on the evaluation and comparison of performance characteristics of HCV qualitative (CAP/CTM Roche Cobas Ampliprep/Cobas Taqman HCV assay, Roche) and quantification (Versant HCV genotype assay, Bayer) methods. The study compared intra-assay variability, analytic sensitivity, limit of detection, HCV WHO standard RNA unitage, genotypic specific assay linearity. The intra-assay variability of the two assays varied from 0.72% to 1.3% for CAP/CTM assay and 1.4–3.02% for Versant HCV genotype assay. For sensitivity, the positive hit rates for WHO HCV RNA standards for the Abbott Real-Time HCV assay were 87% at 15 IU/mL, where as for the CAP/CTM they were 100% at 15 IU/mL. The limit of detection was higher for Real-Time HCV assay at 16.8 (95% CI; 13.1 to 27.9) than for CAP/CTM 10.3 (95% CI; 8.4 to 15.1). HCV WHO standard RNA unitage deviated between – 0.2 log10 IU/mL at 3.2 Log10 for Real-Time HCV assay and –0.3 log10 IU/mL at 3.2 Log10. For Real-Time HCV assay and CAP/CTM assay, the quantification of HCV RNA of five different HCV genotypes was mostly linear between concentrations of 4.0 × 10³ and 1.0 × 10⁶ IU/mL though the sample harbouring genotype 4 showed lower results than expected at concentrations above 1.0 × 10⁴ UI/mL.

Narrative summary of each systematic review’s findings

Traditionally, qualitative nucleic acid amplification (NAT) assays are at least 10 times more sensitive than quantitative assays. This systematic review shows that for HCV, the lower limit of detection of most commercial qualitative assays was in the 10–15 IU/mL range measured against a WHO standard, whereas the lower limit of detection for quantitative assays is at 600–1100 IU/mL.

Though very sensitive for determining the presence of virus, qualitative assays do not allow for determination of viral load. The sensitivity of qualitative assays makes them essential during screening blood donors and monitoring treatment progression as they are used to show the presence of virus as a marker of an on-going HCV infection.1720 This systematic review showed sensitivities as low as 5 IU/mL for HCV NAATs. Verification of the presence of RNA is complicated due to the lack of a standardized commercial HCV assay with sufficient sensitivity that is capable of testing discrepant specimens at such low concentrations.21 This is particularly important when qualitative assays are used prove the absence of HCV-RNA at the end of treatment (ETR) or at the end of follow up (EFU).22 Another use of qualitative assays is to discriminates sustained responders (SRs) from relapsers (RELs).2325

Despite the lower sensitivity, quantitative assays have been found to be a reproducible method to detect and quantify HCV RNA in plasma or serum.25 This systematic review also highlighted potential issues with accuracy as the level of imprecision in a number of quantitative tests (COBAS) AMPLICOR HCV Monitor assay) was seen to be between a factor of 3–5 (0.5–0.7 log10) difference from the actual titre.26 These assays have been proven to be crucial in the measurement of the viral load at the start of therapy and after 12 weeks of treatment to decide about the usefulness of further treatment (stopping rule). These assays have also been proven to have a broad dynamic range of 615–7 700 000 IU/mL ([COBAS] AMPLICOR HCV Monitor assay, Roche). The ability of a quantitative tests to detect viral loads as low as 650 IU/mL allow them to measure early response to treatment as often viral loads drop rapidly at the start of interferon treatment. Viral loads seldom exceed the upper limit of this assay so that retesting of diluted samples is often unnecessary.2728 This explains the reasoning behind laboratories in high-income countries employ HCV RNA quantitative assays in serum or plasma, notwithstanding its higher cost, as it can be used to monitor treatment efficacy and chronic HCV disease progression.2932

Since these studies were published, companies have been steadily improving the sensitivity of quantitative assays. Table 1 shows that currently 5 HCV quantitative assays are commercially available with another two in the pipeline (UNITAID Hepatitis C diagnostic technology landscape report, 2015).39 These assays have linear range of quantitation of 12–108 IU/mL using plasma or serum and the time to result ranges from 70 min to 5–6 h. With these new technology platforms, there is no longer any difference between the lower limit of detection of a qualitative assay compared to a quantitative assay. From this systematic review, the finding of sensitivities of 87–100% for a quantitative assay compared to qualitative assays demonstrates that viral loads are rarely in the lower range of the limit of detection of these older quantitative assays.

These new quantitative assays and the equipment are costly and can be prohibitive to control programmes. However, since other assays such as HIV viral load can be performed on these platforms, HCV control programmes can leverage investments made by HIV programmes for the procurement of these technologies. In resource-limited settings where these assays are not affordable, HCV antigen detection can be considered as a surrogate marker of ongoing virus replication.

Investments in the development of point-of-care (POC) devices that can be used to measure HIV viral load have yielded several technological platforms that can be used to quantitate HCV viral load. Table 2 shows that four companies have developed HCV quantitative assays that would soon be available with another three in the pipeline. These devices cost much less than the laboratory based instruments and can be used outside of laboratory settings as some of them can run on batteries. They are sample in-answer out type of technologies that will require minimal training and all have connectivity capacity so that surveillance for hepatitis C can be automated. The evaluation of these POC platforms will be important to inform countries of whether these devices can be used to improve access to HCV detection and treatment monitoring.

Table 2Qualitative/quantitative HCV RNA platforms currently available (1–5) and soon to be available (6–7)

Image annex5.f58a.jpg

Roche Molecular Systems (1)Abbott Diagnostics (2)Siemens Healthcare Diagnostics (3)Sacace Biotechnologies (4)QIAGEN (5)Beckman Coulter (6)Hologic Inc (7)
Qualitative assaysCOBAS AmpliPrep /COBAS TaqMan HCV Qualitative Test v.2 (LLOD: 15 IU/mL)
Quantitative assaysCOBAS AmpliPrep/COBAS TaqMan HCV Quantitative Test v.2Abbott RealTime HCV AssayVERSANT kPCR HCV RNA AssayHCV Real-TM Quant Dx Assayartus HCV QS-RCQ KitVERIS MDxRT-TMA Technology for the Panther® System
Linear range of quantitation, IU/mL 15–10 8 12–10 8 15–10 8 13–10 8 35–1.77×10 6
Sample type (mL) 0.650 mL plasma/serum 0.5 mL plasma/serum 0.5 mL plasma or serum 1 mL plasma 1 mL plasma plasma, serum 0.24 mL plasma
Cost/test (US$)36–38/43–5113–3572–100>2016–4510–15
Price of instrument (US$)COBAS AmpliPrep: 80 000–100 000
COBAS Taqman 48: 40–50 000
248 000
(45 000 + 162 000 + 80 000)
Pricing for the assay and instrument is available from Siemens113000
(95 000+18 645)
Available from company
# Specimen/run and Time to result24 specimens in 2 h, can process up to 72 samples at one time96 samples at a time in about 3 h89 samples per run with a total time to result of <6 h24 samples/run in 5–6 hContinuous loading in batches of up to 24 samples plus internal controls48 samples can be lined up on 12 racks; DNA tests takes ~70 min and RNA tests ~110 minFirst results available 3 h after loading samples and five results after every 5 min thereafter. Samples can be continuously loaded, with up to 120 samples on the Panther® System

Table 3Point-of-care HCV RNA platforms in the pipeline

AlereMolbio Diagnostics Pvt LtdCepheidUstar Biotechnologies
Quantitative AssaysAlere q HCV VLTruelab Real Time micro PCR SystemGeneXpert
HCV quantitative assay
RT-CPA HCV Viral Load Test
Linear range of quantitation, IU/mL101–108104–106
Sample type (mL)0.5–1 plasma0.1 plasma1 plasma/serum0.1 blood
Cost/test (US$)15–25
14 per chip; 2 per extraction<US$ 20
Price of instrument (US$)800017 000
Time to result (min) <606010520–45 (<500 IU/mL)
Other tests on platformHIV, EbolaMTB, HBV, dengue, chickungunya, HINI, malaria, HIV VL, HCV VLHIV
Image annex5f59

References

A. Reference list of studies that met criteria for inclusion in the analysis

1.
Lee SC , AntonyA, LeeN, LeibowJ, YangJQ, SovieroS, et al. Improved version 2.0 qualitative and quantitative AMPLICOR reverse transcription-PCR tests for hepatitis C virus RNA: Calibration to International Units, Enhanced Genotype Reactivity, and Performance Characteristics. J Clin Microbiol. 2000;38(11):4171–9. [PMC free article: PMC87559] [PubMed: 11060086]
2.
Sábato MF , ShiffmanML, LangleyMR, WilkinsonDS, Ferreira-GonzalezA. Comparison of performance characteristics of three Real-Time reverse transcription-PCR test systems for detection and quantification of hepatitis C virus. J Clin Microbiol. 2007;45(8):2529–36. [PMC free article: PMC1951251] [PubMed: 17567786]
3.
Vermehren J , KauA, GärtnerBC, GöbelR, ZeuzemS, SarrazinC. Differences between two Real-Time PCR-based hepatitis C virus (HCV) assays (Real-Time HCV and Cobas AmpliPrep/Cobas TaqMan) and one signal amplification assay (Versant HCV RNA 3.0) for RNA Detection and Quantification. J Clin Microbiol. 2008;46(12):3880–91. [PMC free article: PMC2593291] [PubMed: 18799708]
4.
Yu ML , ChuangWL, DaiCY, ChenSC, LinZY, HsiehMY, et al. Clinical evaluation of the automated Cobas Amplicor HCV monitor test version 2.0 for quantifying serum hepatitis C virus RNA and comparison to the Quantiplex HCV Version 2.0 Test. J Clin Microbiol. 2000;38(8):2933–9. [PMC free article: PMC87152] [PubMed: 10921954]

B. Reference list from background

1.
WHO. Hepatitis C (No 164) [Fact sheet]. 2014.
2.
Lavanchy D . The global burden of hepatitis C. Liver Int. 2009;29(s1):74–81. [PubMed: 19207969]
3.
Mohd Hanafiah K , GroegerJ, FlaxmanAD, WiersmaST. Global epidemiology of hepatitis C virus infection: new estimates of age-specific antibody to HCV seroprevalence. Hepatology. 2013;57(4):1333–42. [PubMed: 23172780]
4.
Papatheodoridis G , TsochatzisE, HardkeS, WedemeyerH. Barriers to care and treatment for patients with chronic viral hepatitis in europe: a systematic review. Liver Int. 2014;34(10):1452–63. [PubMed: 24750532]
5.
Guidelines for the screening, care and treatment of persons with hepatitis C infection. Geneva: WHO, 2014. [PubMed: 25535634]
6.
Zeuzem S , BergT, MoellerB, HinrichsenH, MaussS, WedemeyerH, SarrazinC, et al. Expert opinion on the treatment of patients with chronic hepatitis. J Viral Hepat. 2009;16(2):75–90. [PMC free article: PMC2759987] [PubMed: 18761607]
7.
Zheng H , LiM, ChiB, WuXX, WangJ, LiuDW. IL28B rs12980275 variant as a predictor of sustained virologic response to pegylated-interferon and ribavirin in chronic hepatitis C patients: a systematic review and meta-analysis. Clin Res Hepatol Gastroenterol. 2015;39(5):576–83. [PubMed: 25769643]
8.
Manzano-Robleda Mdel C , Ornelas-ArroyoV, Barrientos-GutierrezT, Mendez-SanchezN, UribeM, Chavez-TapiaNC. Boceprevir and telaprevir for chronic genotype 1 hepatitis C virus infection. A systematic review and meta-analysis. Ann Hepatol. 2015;14(1):46–57. [PubMed: 25536641]
9.
Ambrosino P , LupoliR, TarantinoP, Di MinnoA, TarantinoL, Di MinnoMN. Viral hepatitis and anti-phospholipid antibodies positivity: a systematic review and meta-analysis. Dig Liver Dis. 2015;47(6):478–87. [PubMed: 25835772]
10.
Khodabandehloo M , RoshaniD. Prevalence of hepatitis C virus genotypes in Iranian patients: a systematic review and meta-analysis. Hepat Mon. 2014;14(12):e22915. [PMC free article: PMC4310018] [PubMed: 25685164]
11.
Khodabandehloo M , RoshaniD, SayehmiriK. Prevalence and trend of hepatitis C virus infection among blood donors in Iran: a systematic review and meta-analysis. J Res Med Sci. 2013;18(8):674–82. [PMC free article: PMC3872606] [PubMed: 24379843]
12.
Khuroo MS , KhurooNS, KhurooMS. Diagnostic Accuracy of point-of-care tests for hepatitis C virus infection: a systematic review and meta-analysis. PLoS One. 2015;10(3):e0121450. [PMC free article: PMC4376712] [PubMed: 25816332]
13.
CRD’s guidance for undertaking reviews in health care. York: Centre for Reviews and Dissemination, 2008
14.
Pai M , MccullochM, GormanJD, PaiNEnanoriaW, KennedyG, et al. Systematic reviews and meta-analyses: an illustrated, step-by-step guide. Natl Med J India. 2004;17(2):86–95. [PubMed: 15141602]
15.
Shivkumar S , PeelingR, JafariY, JosephL, PantPai N. Accuracy of rapid and point-of-care screening tests for hepatitis C: a systematic review and meta-analysis. Ann Intern Med. 2012;157(8):558–66. [PubMed: 23070489]
16.
Whiting PF , RutjesAW, WestwoodME, MallettS, DeeksJJ, ReitsmaJB, et al. QUADAS-2: a revised tool for the quality assessment of diagnostic accuracy studies. Ann Intern Med. 2011;155(8):529–36. [PubMed: 22007046]
17.
Malmivaara A . Methodological considerations of the GRADE method. Ann Med2015;47(1):1–5. [PMC free article: PMC4364259] [PubMed: 25356772]
18.
National Institutes of Health. 2002. Management of hepatitis C: 2002. NIH Consensus and State-of-the-Science Statements19(3):1–46. [PubMed: 14768714]
19.
National Institutes of Health. 2002. Management of hepatitis C: 2002. NIH Consensus and State-of-the-Science Statements19(3):1–46. [PubMed: 14768714]
20.
Krajden M , ZiermannR, KhanA, MakA, LeungK, HendricksD, et al. Qualitative detection of hepatitis C virus RNA: comparison of analytical sensitivity, clinical performance, and workflow of the Cobas Amplicor HCV Test Version 2.0 and the HCV RNA transcription-mediated amplification qualitative assay. J Clin Microbiol. 2002;40(8):2903–07. [PMC free article: PMC120657] [PubMed: 12149349]
21.
Martinot-Peignoux M , MarcellinP, PouteauM, CastelnauC, BoyerN, PoliquinM, et al. Pretreatment serum hepatitis C virus RNA levels and hepatitis C virus genotype are the main and independent prognostic factors of sustained response to interferon alfa therapy in chronic hepatitis C. Hepatology. 1995;22(4 Pt 1):1050–6. [PubMed: 7557850]
22.
McHutchison JG , PoynardT. Combination therapy with interferon plus ribavirin for the initial treatment of chronic hepatitis C. Semin Liver Dis. 1999;19(Suppl. 1):57–65. [PubMed: 10349693]
23.
Morishima C , GretchDR. Clinical use of hepatitis C virus tests for diagnosis and monitoring during therapy. Clin Liver Dis. 1999;3:717–40. [PubMed: 11291247]
24.
Lee SC , AntonyA, LeeN, LeibowJ, YangJQ, SovieroS, et al. Improved version 2.0 qualitative and quantitative AMPLICOR reverse transcription-PCR tests for hepatitis C virus RNA: calibration to international units, enhanced genotype reactivity, and performance characteristics. J Clin Microbiol. 2000;38(11):4171–79. [PMC free article: PMC87559] [PubMed: 11060086]
25.
Orito E , MizokamiM, SuzukiK, OhbaK, OhnoT, MoriM, et al. Loss of serum HCV RNA at week 4 of interferon-alpha therapy is associated with more favorable long-term response in patients with chronic hepatitis C. J Med Virol. 1995;46:109–15. [PubMed: 7636496]
26.
Reichard O , NorkransG, FrydénA, BraconierJH, SonnerborgA, WeilandO. Comparison of 3 quantitative HCV RNA assays – accuracy of baseline viral load to predict treatment outcome in chronic hepatitis C. Scand J Infect Dis. 1998;30:441–6. [PubMed: 10066040]
27.
Van Vlierberghe H , Leroux-RoelsG, AdlerM, BourgeoisN, NevensF, HorsmansY, et al. Daily induction combination treatment with alpha 2b interferon and ribavirin or standard combination treatment in naive chronic hepatitis C patients. A multicentre randomized controlled trial. J Viral Hepat. 2003;10:460–6. [PubMed: 14633181]
28.
Zeuzem S , LeeJH, FrankeA, RüsterB, PrümmerO, HerrmannG, et al. Quantification of the initial decline of serum hepatitis C virus RNA and response to interferon alfa. Hepatology. 1998;27:1149–56. [PubMed: 9537457]
29.
Mancini C , PisaniG, AzziA, LuisaZerbini M, GentiliG, MarioBisso G, et al. Inter-laboratory comparison of qualitative and quantitative detection of hepatitis C (HCV) virus RNA in diagnostic virology: a multicentre study (MS) in Italy. J Clin Virol. 2004;30:313–9. [PubMed: 15163420]
30.
Pawlotsky JM . Molecular diagnosis of viral hepatitis. Gastroenterology. 2002;122:1554–68. [PubMed: 12016423]
31.
Trimoulet P , HalfonP, PohierE, KhiriH, ChêneG, FleuryH. Evaluation of the VERSANT HCV RNA 3.0 assay for quantification of hepatitis C virus RNA in serum. J Clin Microbiol. 2002;40:2031–6. [PMC free article: PMC130754] [PubMed: 12037059]
32.
Anderson JC , SimonettiJ, FischerDG, WilliamsJ, YamamuraY, RodriguezN, et al. Comparison of different HCV viral load and genotyping assays. J Clin Virol. 2003;28(1):27–37. [PubMed: 12927748]
33.
European association for the study of the liver (EASL), 1999. EASL International consensus conference on hepatitis C. Consensus Statement J Hepatol. 30:956–61. [PubMed: 10365827]
34.
Gretch D . Standardization of hepatitis C virus – RNA quantification advances and unfinished business. Hepatology. 2000;31:788–9. [PubMed: 10706575]
35.
Martinot-Peignoux M , BoyerN, Le BretonV, Le GuludecG, CastelauC, AkremiR, et al. A new step toward standardisation of serum hepatitis C virus RNA quantification in patients with chronic hepatitis C. Hepatology. 2000;31:726–9. [PubMed: 10706564]
36.
Lo Re V 3rd , AmorosaVK, LocalioAR, O’FlynnR, TealV, Dorey-SteinZ, et al. Adherence to hepatitis C virus therapy and early virologic outcomes. Clin Infect Dis. 2009;48(2):186–93. [PMC free article: PMC2668718] [PubMed: 19086908]
37.
McHutchinson JG , MannsM, PatelK, PoynardT, LindsayKL, TrepoC, et al. Adherence to combination therapy enhances sustained. Response in genotype-1-infected patients with chronic hepatitis C. Gastroenterology. 2002;123(4):1061–9. [PubMed: 12360468]
38.
UNITAID. Hepatitis C diagnostic technology landscape. 1st edn. Geneva: WHO; 2015. (http://unitaid​.org/images​/marketdynamics​/publications/UNITAID-HCV​_Diagnostic_Landscape-1st_edition​.pdf, accessed 06 June 2016).

Annex 5.8. PICO 5a and PICO 9 - How to test (confirmation of HCV viraemia)
HCV core antigen testing for presence of active HCV infection and monitoring for treatment response and cure: a systematic review

Authors

Team lead: ,1 ,2 ,3 ,4 ,3 ,2,5 ,1,6 and 3,7.

Affiliations

1 HIV Epidemiology and Outcomes Research Unit, Section of Infectious Diseases, Boston Medical Center, Boston, USA
2 Médecins Sans Frontières – Access Campaign, Geneva, Switzerland
3 FIND, Geneva, Switzerland
4 Department of Biostatistics, Boston University School of Public Health, Boston, USA
5 Infectious Diseases Division, University of Pennsylvania, Philadelphia, USA
6 Department of Epidemiology, Boston University School of Public Health, Boston, USA
7 Division of Infectious Diseases, Beth Israel Deaconess Medical Center, Boston, USA

Corresponding author Claudia M. Denkinger, Head of Tuberculosis and Hepatitis Programme, FIND, Geneva, Switzerland, Email: gro.xddnif@regnikned.aidualc, Tel: Office: +41-22-749-2931

Abstract

Background: Chronic hepatitis C virus (HCV) infection with viraemia is prevalent in approximately 1.1% of the world population.1 Current diagnosis of active infection requires a positive HCV antibody (Ab) as well as nucleic acid testing (NAT) to detect HCV ribonucleic acid (RNA) indicative of active replication. HCV core antigen (HCVcAg) testing was developed as an alternative to NAT. This systematic review aims to summarize (1) the diagnostic accuracy of HCVcAg testing in those with and without positive HCV Ab (PICO 5a), (2) inform the best testing strategy for identification of active HCV infection (PICO 5b), and (3) examine the utility of HCVcAg monitoring for those on HCV treatment (PICO 9).

Methods: We performed a literature search in multiple databases for all published and peer reviewed literature without language restriction through March 2015. Studies were included if a commercially available HCV Core Ag test result was compared with NAT in at least 10 independent clinically collected samples. We contacted authors for missing data to complete extraction. We assessed the quality of studies using an adapted QUADAS-2 tool. Data were classified by HCV Core Ag test manufacturer. For PICO 5a, bivariate meta-analyses were performed for the Abbott ARCHITECT, Hunan Jynda, and Ortho ELISA to obtain pooled sensitivity (Se) and specificities (Sp) with 95% confidence intervals (CI). Due to limited number of studies and specificity data descriptive statistics were derived for the Murex EIA, Bio-RAD Monolisa, EIKEN Lumispot and Fujirebio Lumipulse. We assessed non-parametric regression of quantitative data and identified outliers. Due to the absence of published studies to inform PICO 5b, a decision analysis was performed and is reported separately. Only a descriptive analysis was possible on the use of HCV core Ag in treatment monitoring and assessment of SVR (PICO 9).

Results: We identified 50 published studies for inclusion in the analysis of PICO 5a, 1 study relevant to PICO 5b, and 5 studies relevant to PICO 9. For PICO 5a, 7 index tests were included with 30 studies utilizing Abbott ARCHITECT, 5 studies for Bio-RAD Monolisa, 4 for Murex Ag/Ab EIA, 6 for Ortho ELISA-Ag, 2 for EIKEN Lumispot HCV Ag, 1 for Ortho Lumipulse-Ag, and 4 for Hunan Jynda Bioengineering Group HCV Core Ag ELISA. Among these, 1 directly compared the ARCHITECT with the Lumipulse and Lumispot, and 1 compared the Monolisa with the Murex. From bivariate analyses, the pooled sensitivity and specificity with 95% CI were: ARCHITECT 93.4% (88.7, 96.2) and 98.7% (96.9, 99.4), Ortho ELISA 93.2% (81.6, 97.7) and 99.2% (87.9, 100), and Hunan Jynda 59.5% (46% 71.7) and 82.9% (58.6, 94.3). The sensitivity for the Lumipulse was 95% (90.2, 99.8) in one study; specificities could not be calculated. Three studies using the ARCHITECT provided quantitative data. The few points with negative HCVcAg were shown to occur at RNA levels below 3000 IU/mL where loss of linearity was also noted in pooled non-parametric regression. Accuracy of HCVcAg for treatment monitoring and as a test of cure was assessed by descriptive analysis in 5 studies (PICO 9). The sensitivity of ARCHITECT in EVR ranged from 74–100% with specificity from 70% to 100%. SVR was only assessed in 2 studies with 100% sensitivity and specificity ranging from 94% to 100%. Data on accuracy in prediction of SVR were limited and assessed in only 3 small studies.

Conclusions: HCV core antigen assays can have high sensitivity (up to 93.4% for Abbott ARCHITECT HCVcAg test), high specificity, and good correlation with HCV RNA to a detection limit of roughly 3000 IU/mL. The data on core antigen for treatment monitoring and as a test of cure is too limited to reach reliable conclusions.

GRADE summary tables

I. PICO 5a: What is the best strategy (diagnostic accuracy and other outcomes); comparing HCV core Ag test versus NAT for HCV RNA for detection (and/or) quantification to confirm active HCV infection?

SR Outcome: Diagnostic accuracy, sensitivity and specificity

Patients/population: Persons with detectable HCV RNA with or without positive HCV antibody

Setting: Any

Index tests: HCV core antigen assay

Importance: Inform best strategy for HCV diagnosis in a variety of clinical settings and economies

Reference standard: HCV RNA testing

Studies: Cohort, cross-sectional, or randomized controlled trials that use HCV NAT as gold standard reference test compared with a commercially available HCV core Ag index test

A)Strength of evidence

SR outcome: diagnostic accuracyQualityStrength of Evidence
Index testOutcome Measure# Studies
(# samples)
DesignRisk of BiasInconsistencyIndirectnessImprecision
Abbott ARCHITECT HCV Ag AssaySensitivity30 (12,788)Cohort and cross-sectionalLow1Low2Moderate3 (–1)Low4Moderate
ⴲⴲⴲ◯
Specificity20 (11,820)Cohort and cross-sectionalLow1Low2Moderate3 (–1)Low4Moderate
ⴲⴲⴲ◯
Ortho ELISA-AgSensitivity6 (1,423)Cohort and cross-sectionalHigh1 (–2)Moderate2 (–1)Moderate3 (–1)Moderate4 (–1)Very low
ⴲ◯◯◯
Specificity5 (1,177)Cohort and cross-sectionalHigh1 (–2)Moderate2 (–1)Moderate3 (–1)Moderate4 (–1)Very low
ⴲ◯◯◯
Bio-RAD Monolisa HCV
Ag-Ab ULTRA
Sensitivity5 (525)Cohort and cross-sectionalLow1High2 (–2)Moderate (–1)Low4Very low
ⴲ◯◯◯
Specificity1 (337)Cross-sectionalModerate1 (–1)NA2 (–1)Moderate3 (–1)NA4Very low
ⴲ◯◯◯
EIKEN Lumispot HCV AgSensitivity2 (235)Cross-sectionalModerate1 (–1)Low2Moderate3 (–1)Moderate4 (–1)Very low
ⴲ◯◯◯
Specificity0NANANANANANA
Fujirebio Lumipulse Ortho HCV AgSensitivity1 (80)Cross-sectionalModerate1 (–1)NA2 (–1)Moderate3 (–1)NA4Very low
ⴲ◯◯◯
Specificity0NANANANANANA
Hunan Jynda HCV Core Ag ELISASensitivity4 (524)Cohort and cross-sectionalModerate1 (–1)High2 (–2)Moderate3 (–1)Low4Very low
ⴲ◯◯◯
Specificity4 (524)Cohort and cross-sectionalModerate1 (–1)High2 (–2)Moderate3 (–)Low4Very low
ⴲ◯◯◯
DiaSorin S.A. Murex Ag/Ab EIASensitivity4 (770)Cohort and cross-sectionalLow1High2 (–2)Moderate3 (–1)Low4Very low
ⴲ◯◯◯
Specificity3 (658)CohortLow1Moderate2 (–1)Moderate3 (–1)Low4Low
ⴲⴲ◯◯

NA= not applicable

Footnotes:

For each index test, quality of evidence started high when there were several high-quality observational studies (prospective cohort studies, cross-sectional studies with direct comparison of index test results with a reference standard). We then downgraded one point when there was moderate concern identified and two points when a there was a high concern identified in any of the four factors that may decrease the quality of evidence: risk of bias, inconsistency, indirectness, and imprecision.

1

We used QUADAS-2 to assess risk of bias.

  • For ARCHITECT, in half of the studies it was unclear how participants were selected and one study used only healthy blood donors; however, the data from all studies is consistent and unclear selection does not appear to cause bias thus we did not downgrade.
  • For the Ortho ELISA, two studies of five used convenience enrolment for participant selection, and one enrolled only healthy blood donors thus we downgraded 2 points.
  • For the Monolisa, four of five studies had unclear patient selection. For one it was unclear if the index and reference test were performed within 30 days. Given that there were no high-risk concerns for bias we did not downgrade. For specificity, there was only one study with data that had unclear participant selection, thus we downgraded one point, as there were no data from studies with random or consecutive selection to compare to and identify possible selection bias (as was possible with the ARCHITECT).
  • For the Lumispot, both studies had unclear patient selection. As there were no data from studies with random or consecutive selection to compare, we downgraded one point.
  • The Lumipulse only included one study with unclear participant selection and was downgraded 1 point.
  • The Hunan Jynda had one of four studies with unclear participant selection, one in only healthy blood donors, and one for which it was unclear whether the index and reference were performed within 30 days. As the use of only healthy blood donors was considered a high-risk category, in combination with the other unclear factors, we downgraded one point.
  • For the Murex test, three of four studies had unclear participant selection but no other high-risk concerns for bias and thus we did not downgrade.

2

Unexplained heterogeneity in remaining studies may be related to covariates that could not be adjusted for in meta-regression due to limited data (HIV and HBV coinfections, HCV genotype). Additionally, not all studies identified HCV antibody status or stratified by acute and chronic infection thus variability of HCV replication could contribute to higher false negative HCVcAg.

  • There was little heterogeneity noted in the ARCHITECT studies; thus we did not downgrade.
  • For the Ortho ELISA, there was moderate heterogeneity with largely one outlier study, thus we downgraded 1 point.
  • For the Monolisa sensitivity outcome, heterogeneity between studies precluded meta-analysis and thus we downgraded 2 points. For specificity, there is only 1 study and we cannot assess heterogeneity and downgrade 1 point.
  • For the Murex sensitivity outcome there was too much heterogeneity to pool the data, and thus we downgraded 2 points. For specificity, there were not enough studies to perform meta-analysis and heterogeneity could not be formally assessed, however there is a broad range among results and thus we downgraded one point.
  • The EIKEN Lumispot was only used in 2 studies. Sensitivity was similar in both studies suggesting little heterogeneity, thus we did not downgrade.
  • For the Fujirebio Lumipulse, there is only 1 study and we cannot assess heterogeneity and downgrade 1 point.

3

All studies were performed in reference laboratories, and the majorities were in high and middle-income countries. Thus the patient population, the viral population tested (e.g. genotype distribution), and the test users are not representative of the limited-resource settings for which these guidelines are envisioned. All were downgraded 1 point.

4

We considered imprecision as present when the pooled confidence intervals were >10% and when there were fewer than 250 samples in the analysis. As such, we downgrade the Ortho ELISA, and Hunan Jynda one point for wide confidence intervals, and downgraded the Lumispot one point for small sample size. Additionally, imprecision could not be graded for the Monolisa specificity outcome, and the Lumipulse test as these only included one study.

B)Summary of findings, PICO 5a

SR outcome: diagnostic accuracyEffect accuracy (95% confidence interval)Effect likelihood ratio (LR)
Index test# Studies (# samples)Unit of analysisSensitivitySpecificityPositive LRNegative LR
Abbott ARCHITECT HCV Ag Assay20 (11,820)Sample93.4% (88.7, 96.2)98.7% (96.9, 99.4)71.8 (28.6, 160.3)0.07 (0.04, 0.12)
Ortho ELISA-Ag5 (1,177)Sample93.2% (81.6, 97.7)99.2% (87.9, 99.9)116.5 (6.7, 977)0.06 (0.02, 0.07)
Bio-RAD Monolisa HCV Ag-Ab ULTRA5 (525)Sample28.6–95%*94.9% (89.9, 99.8)**NANA
EIKEN Lumispot HCV Ag2 (235)Sample97.5–98.1%*NDNANA
Fujirebio Lumipulse Ortho HCV Ag1 (80)Sample95% (90.2, 99.8)**NDNANA
Hunan Jynda HCV Core Ag ELISA4 (524)Sample59.5% (46, 71.7)82.9% (58.6, 94.3)3.5 (1.1, 12.6)0.28 (0.2, 0.3)
DiaSorin S.A. Murex Ag/Ab EIA4 (730)Sample50–100%*83.8–100%*NANA

ND: no data, NA = not applicable – if sensitivity and specificity results were not available from meta-analysis, likelihood ratios were not calculated.

*

Meta-analysis not possible. Range of results seen across studies reported.

**

Result from one study only.

C)Impact of findings in different prevalence settings

OutcomeEffect per 1000 patients with presumed HCV for varying prevalence settings comparing HCV core Ag against HCV RNA
Prevalence 2%*Prevalence 10%*Prevalence 30%*
Abbott ARCHITECT HCV Ag Assay
True positives (patients with HCV)19 (18, 19)93 (89, 96)279 (267,288)
True negatives (patients without HCV)967 (951, 974)888 (873, 895)691 (697, 696)
False positives (patients incorrectly classified as having HCV)13 (6, 29)12 (5, 27)9 (4, 21)
False negatives (patients incorrectly classified as not having HCV)1 (1, 2)7 (4, 11)21 (12, 33)
Ortho ELISA-Ag
True positives (patients with HCV)19 (16, 20)93 (82, 98)279 (246, 294)
True negatives (patients without HCV)970 (862,980)891 (792, 900)693 (616, 700)
False positives (patients incorrectly classified as having HCV)10 (0, 118)9 (0, 108)7 (0, 84)
False negatives (patients incorrectly classified as not having HCV)1 (0,4)7 (2, 18)21 (6, 54)
Hunan Jynda HCV Core Ag ELISA
True positives (patients with HCV)12 (9, 14)60 (46, 72)179 (138, 216)
True negatives (patients without HCV)813 (578, 921)747 (531, 846)581 (413, 658)
False positives (patients incorrectly classified as having HCV)167 (59, 402)153 (54, 369)119 (42, 287)
False negatives (patients incorrectly classified as not having HCV)8 (6, 11)41 (28, 54)122 (84, 162)
*

Numbers in parentheses consider 95% confidence intervals of accuracy estimate

II. PICO 9: Among patients receiving treatment for HCV, what is the diagnostic accuracy of HCV core Ag test versus NAT for HCV RNA detection (and/or) quantification to confirm successful treatment response with viral clearance?

SR Outcome 1: Diagnostic accuracy, sensitivity and specificity of HCVcAg at SVR

SR Outcome 2: Timing and predictive accuracy of HCVcAg for SVR

Patients/population: Persons with detectable HCV RNA with or without positive HCV antibody

Setting: Any

Index tests: HCV core antigen assay

Importance: Inform best strategy for treatment monitoring and test of cure in a variety of clinical settings and economies

Reference standard: HCV RNA Testing

Studies: Longitudinal cohort or randomized controlled trials that use HCV NAT as gold standard reference test compared with a commercially available HCV core Ag index test

SR outcome 1: Diagnostic Accuracy at SVRQualityEffect*Strength of evidence
Index testOutcome measure# Studies (# samples)DesignRisk of biasInconsistencyIndirectnessImprecision
Abbott ARCHITECT HCV Ag AssaySensitivity2 (67)RCT, cohortLow1Low2Moderate3 (–1)Low4100%*Moderate
ⴲⴲⴲ◯
Specificity2 (67)RCT, cohortLow1Moderate2 (–1)Moderate3 (–1)Low494–100%*Low
ⴲⴲ◯◯
SR outcome 2: Predictive accuracy of SVRQualityEffect*Strength of evidence
Index testOutcome measure# Studies (# individuals)DesignRisk of biasInconsistencyIndirectnessImprecision
Abbott ARCHITECT HCV Ag AssaySensitivity1 (23)CohortLow1NA2 (–1)Moderate3 (–1)NA495.2%**Low
ⴲⴲ◯◯
Specificity1 (23)CohortLow1NA2 (–1)Moderate3 (–1)NA470%**Low
ⴲⴲ◯◯
Fujirebio Lumipulse Ortho HCV AgSensitivity2 (134)CohortModerate1 (–1)Moderate2 (–1)Moderate3 (–1)Moderate4 (–1)57.1–79.4%*Very low
ⴲ◯◯◯
Specificity2 (134)CohortModerate1 (–1)Moderate2 (–1)Moderate3 (–1)Moderate4 (–1)88.5–99.3%*Very low
ⴲ◯◯◯
*

Results reported are range across studies or

**

individual result, NA= not applicable

Footnotes:

For each index test, quality of evidence started high when there were several high quality observational studies (prospective cohort studies, cross-sectional studies with direct comparison of index test results with a reference standard). We then downgraded one point when a serious issue was identified and two points when a very serious issue was identified in any of the four factors that may decrease the quality of evidence: risk of bias, inconsistency, indirectness, and imprecision.

SR outcome 1: diagnostic accuracy at SVR

1

We used QUADAS-2 to assess risk of bias. There were no concerns raised for the two studies that utilized the ARCHITECT assay.

2

The limited number of studies precluded a meta-analysis and formal assessment of heterogeneity. However, the data between studies for sensitivity is consistent thus we did not downgrade. There is some variability seen in the data for specificity, thus we downgrade 1 point.

3

Both studies were performed in reference laboratories in high and middle-income countries, which is not representative of broad use throughout the world thus we downgraded 1 point.

4

The range in specificity results was attributed to possible unexplained heterogeneity and is less likely from verification bias given the excellent reference standard. Given that we already downgraded for heterogeneity, we did not downgrade for imprecision.

SR outcome 2: predictive accuracy of early HCV Ag on SVR

1

We used QUADAS-2 to assess risk of bias. For the ARCHITECT, there were no concerns raised so we did not downgrade. In the 2 Fujirebio Lumipulse studies, participant selection was unclear in one, and one did not include all patients initially enrolled in the analysis so we downgraded 1 point.

2

For the ARCHITECT, there was only one study thus we could not assess heterogeneity and downgrade one point. For the Lumipulse assay, there were only 2 small studies and no formal heterogeneity could be assessed. However, neither study included covariate information aside from genotype and the results between studies are broad, thus we downgraded one point.

3

All studies were performed in reference laboratories in high- and middle-income countries, which is not representative of broad use throughout the world. All were downgraded 1 point.

4

For the ARCHITECT, imprecision could not be graded as there was only one study. There is a broad range of effect between the Fujino studies, which may in part be from unexplained heterogeneity already discussed, but may also be from imprecision as only absolute values of decline in HCVcAg were examined instead of log decline thus we downgraded 1 point.

2. Background

Chronic hepatitis C virus (HCV) infection with viraemia is prevalent in approximately 1.1% of the world population, or 64–103 million people, with an estimated 75% of all cases occurring in low- to middle-income countries (LMICs).1 HCV is a small, enveloped, single stranded ribonucleic acid (RNA) virus belonging to the Flaviviridae family with seven genotypes and more than sixty-seven subtypes.2 The genome is contained in an internal capsid formed by three domains of the HCV core protein, which is highly conserved and antigenic.3,4 During viral assembly, nucleocapsid peptides 22 (p22) are released into plasma5 and can be detected early in the course of infection.

Screening assays to assess for anti-HCV antibodies (HCV Ab) were among the first diagnostic tools developed to identify HCV infection, but can only inform about exposure to the virus and not active replication or ongoing infection. The serological window for conversion to a positive antibody is highly variable with an average of 60 days6 and antibodies may remain persistently negative among patients on haemodialysis and those with poorly controlled HIV infection or other immunocompromised states. Thus, diagnosis of active HCV infection requires antibody testing followed by an assessment for viraemia both for confirmation of true infection in antibody-positive patients and for high-risk antibody negative patients. Confirmatory testing can be based on nucleic acid testing (NAT) to detect HCV-RNA or an antigen testing to detect core antigen.

HCV core antigen (HCVcAg) tests largely targeting p22 have been in development as an alternative to NAT since Tanaka et al. first demonstrated detection of circulating antigen in those with chronic HCV infection in 19957 and the first commercial assay was released in 2000.8 HCVcAg tests have the potential to be less costly and less centralized than NAT.

Detection of HCV viraemia is also important during treatment of chronic HCV infection. Current guidelines recommend virological confirmation pretreatment with the measurement of a baseline viral load with NAT. For interferon-based treatments, viral load is assessed at week 4 of therapy for the “rapid viral response” (RVR) to help predict efficacy of therapy, and repeated at week 6 if elevated at week 4 to see further viral response and guide whether treatment should be continued. NAT is performed again at week 12 (early viral response, EVR), at the end of treatment, and 12 and 24 weeks after therapy is completed to test for cure, “sustained viral response” (SVR). With the development of direct-acting antivirals (DAAs), NAT during therapy may no longer be necessary.9 Additionally, DAA has made treatment for HCV possible in LMICs10 making access to an affordable diagnostic and monitoring test even more important.

This systematic review of the published literature aims to assess the diagnostic accuracy of HCVcAg testing for HCV detection and inform the best testing strategy for identification of chronic HCV infection. Furthermore, the review looks at the utility of HCVcAg for monitoring on HCV treatment and to test for cure.

Tests included in this systematic review

Only commercially available tests were included in the systematic review. The most widely studied is the Abbott ARCHITECT HCV Ag assay, a two-step automated chemiluminescent microparticle immunoassay (CMIA) that allows quantitative determination of HCVcAg in serum or plasma. The assay uses the Abbott ARCHITECT i System (i2000/i2000SR/i1000SR modules), a reference laboratory instrument with ARCHITECT System Software version 5.0 or higher. The Fujirebio Lumipulse Ortho HCV Ag test and EIKEN Lumispot HCV Ag are similar automated chemiluminescent enzyme immunoassays (CLEIA) available in Japan and China.

There are two available Ab–Ag combination enzyme immunoassays (EIA), the DiaSorin S.A. Murex HCV Ag–Ab combination and Bio-RAD MonolisaTM HCV Ag-Ab ULTRA. The Monolisa uses a spectrophotometer to read absorbance values that detects presence or absence of Ab and/or HCVcAg with the colour intensity being proportional to quantity of Ab or Ag to HCV bound on the solid phase. Lastly, there are two enzyme-linked immunosorbent assay (ELISA)-based HCVcAg tests, Hunan Jynda Bioengineering Group HCV Core Ag ELISA and Ortho ELISA-Ag.

3. Objectives

This systematic review addresses predefined PICO questions 5a and 9. Question 5b will be addressed in a separate report.

PICO 5a What is the best strategy (diagnostic accuracy and other outcomes); comparing HCV core Ag test versus NAT for HCV RNA for detection (and/or) quantification to confirm active HCV infection?
PPersons with detectable HCV RNA with or without positive HCV antibody
IHCV core antigen assay
CHCV RNA testing
O
  • Diagnostic accuracy
    1. True negatives (TN), who are screen negative, and do not have HCV infection.
    2. False negatives (FN), who are screen negative but have HCV infection. These are incorrectly misclassified, and this may results in missed opportunity to recognize and present progression of liver disease.
    3. True positives (TP), who are screen positive and have HCV infection.
    4. False positives (FP), who are screen positive, but do not truly have HCV infection. These will have additional unnecessary tests and evaluation.
PICO 5b What is best testing strategy (diagnostic accuracy and other outcomes); between using sequential testing strategy (HCV core Ag followed by NAT if negative) versus NAT alone for diagnosis of active HCV infection?
PPersons with detectable HCV RNA with or without positive HCV antibody
ISequential testing strategy (HCV core Ag followed by NAT if negative) (Fig. 4A)
CStandalone NAT test (Fig. 4B)
O
  • Diagnostic accuracy
    1. True negatives (TN), who are screen negative, and do not have HCV infection.
    2. False negatives (FN), who are screen negative but have HCV infection. These are incorrectly misclassified, and this may results in missed opportunity to recognize and present progression of liver disease.
    3. True positives (TP), who are screen positive and have HCV infection.
    4. False positives (FP), who are screen positive, but do not truly have HCV infection. These will have additional unnecessary tests and evaluation.
PICO 9 Among patients receiving treatment for HCV, what is the diagnostic accuracy of HCV core Ag test versus NAT for HCV RNA detection (and/or) quantification to confirm successful treatment response with viral clearance? (Fig. 5A, 5B)
PPatients receiving treatment for HCV
IHCV core Ag test (Fig. 5A)
CNAT for HCV RNA detection (and/or) quantification (Fig. 5B)
O
  • Diagnostic accuracy
    1. True negatives (TN), who are screen negative, and cleared the HCV infection.
    2. False negatives (FN), who are screen negative but have HCV infection. (These will be misclassified, and treatment will be stopped resulting in disease progression leading to Liver related morbidity (fibrosis, cirrhosis, end-stage liver disease, hepatocellular carcinoma), progression of liver disease, and mortality.
    3. True positives (TP), who are screen positive and truly have HCV infection, this will increase the number of treated cases and cured rate.
    4. False positives (FP), who are screen positive, but do not have HCV infection. (These will continue treatment inappropriately, and will have unnecessary referral).

4. Methods

We followed standard guidelines and methods for systematic review and meta-analyses of diagnostic tests.1415 We prepared a protocol for the literature search, article selection, data extraction, and assessment of methodological quality.

Selection criteria

Types of studies

We included case–control, cross-sectional, cohort studies and randomized trials that used HCV NAT as gold standard reference test compared with a commercially available HCV core Ag index test for the diagnosis of active HCV infection or in the monitoring of HCV infection while on treatment.

Participants

We included patients of all age groups from all settings and countries. Specimen types were limited to whole blood, plasma or serum, and we only included studies that examined at least 10 independent HCV NAT positive samples. Saliva specimens were also considered, but only one study was identified during the search and it did not use NAT as reference test and was thus excluded from further analysis. Commercially prepared reference panel specimens were excluded.

Index tests

Studies that utilized a commercially available HCV Core Ag test were eligible for inclusion. The following seven are the index tests included:

  • Abbott ARCHITECT HCV Ag
  • Bio-RAD MonolisaTM HCV Ag-Ab ULTRA
  • EIKEN Lumispot HCV Ag
  • Fujirebio Lumipulse Ortho HCV Ag
  • Hunan Jynda Bioengineering Group HCV Core Ag ELISA
  • DiaSorin S.A. Murex Ag/Ab EIA
  • Ortho ELISA-Ag

Target conditions
PICO 5a/b
  • Acute HCV infection: the 6-month time period following acquisition of hepatitis C virus. HCV Ab may be positive or negative; the time period between initial infection to seroconversion of antibody is the “window period”. HCV RNA is detectable.
  • Chronic HCV infection: duration of HCV infection more than 6 months from time of acquisition. HCV Ab and RNA are detectable.
PICO 9
  • Monitoring of viral clearance while on treatment with rapid viral response (RVR) at 4 weeks and early viral response (EVR) at 12 weeks and sustained viral response (SVR) at 24 weeks after completion of treatment
Reference standard

The reference standards accepted for a definitive diagnosis included tests for detection of HCV RNA by any of the following NAT techniques: polymerase chain reaction (PCR), branched-chain DNA (bDNA), or transcription mediated amplification (TMA). Tests were noted to be either qualitative or quantitative. The performance characteristics of NATs are very similar above 50 IU/mL, thus all NATs were considered as one reference standard.

Outcome measures

Sensitivity refers to the proportion of samples with true HCV infection diagnosed with positive HCV Core Ag test confirmed with a positive NAT result.

Specificity refers to the proportion of samples with negative HCV Core Ag test and no evidence of active HCV infection confirmed with a negative NAT result.

Search methods

A database search of EMBASE, PubMed, Scopus, Web of Science, and Cochrane was performed through March 2015. No language restriction was applied. The search terms used for each database are outlined in Appendix A.

Two review authors (JMF and TT) independently assessed titles and abstracts identified by the literature search to select potentially eligible studies (screen 1). Any citation identified by either review author during screen 1 was selected for full text-review. Full papers of each potentially eligible article were retrieved. Two review authors (JMF and TT) independently assessed the full text articles for inclusion using the predefined inclusion and exclusion criteria (screen 2). Three articles were excluded because of inability to find appropriate language interpretation. Discrepancies were resolved by discussion between the review authors, and for several studies by the decision of a third review author (CMD). The included studies were divided into those applicable for each PICO question. A list of excluded studies and reasons for exclusion can be found in Appendix D.

Data extraction

We created a data extraction form, pilot-tested the form with a subset of eligible studies, and then finalized the form (Appendix B). Two review authors (JMF and TT) independently extracted data from the included studies with the standardized form and crosschecked to ensure accuracy. Disagreement between review authors on data extraction was resolved by discussion or by a third reviewer (CMD). For studies without complete extraction information available, authors were contacted to request further data. Studies without extractable sensitivity and specificity data were excluded if no further information was acquired after three attempts to contact the study authors.

Assessment of methodological quality

We adapted the QUADAS-2 instrument, a validated tool for diagnostic studies,14 to assess study quality. The information needed to answer QUADAS-2 questions was incorporated in the data extraction sheet. A description of the QUADAS-2 items and the interpretation in the study context can be found in Appendix C.

Statistical analysis and data synthesis

Statistical analyses were performed using STATA (version 14; STATA corporation, College Station, TX). The studies were grouped by type of index test used. QUADAS analysis was performed using Excel (version 14.5.3; Microsoft, Seattle, WA).

Approach to indeterminate index test results

We excluded indeterminate test results from the analyses for determination of sensitivity and specificity, as it was less than 1% for all index tests.

Assessment of publication bias

We did not perform formal assessment of publication bias (tests for funnel plot asymmetry), as these techniques are not recommended for diagnostic test accuracy studies. We reviewed the EASL and AASLD conference abstract books for abstracts of studies that have not been published subsequently and did not find anything between 2010 and 2013. We did not include unpublished data in this review.

Meta-analysis

Meta-analysis for each index test type was performed if at least four studies were available with the same index test with at least ten independent samples in each study. Bivariate random effects meta-analyses were performed for index tests with enough studies that included data to calculate sensitivity, specificity, and 95% confidence intervals for each. Several studies did not contribute to both sensitivity (no true positives and false negatives) and specificity (no false positives and true negatives) but only to one of the two. In such cases, we examined the correlation between sensitivity and specificity visually from a scatter plot of the sensitivity versus 1-specificity across studies. If the correlation was limited, we performed a univariate random effects meta-analysis of the sensitivity and/or specificity estimates separately, so as to make complete use of the available data. We then compared the results from the univariate analysis (including all studies) with the results from the bivariate analysis of the subset of studies that contributed to both sensitivity and specificity estimates. For index tests with data that contributed only to sensitivity but had at least 4 studies, we performed univariate random effects meta-analysis only for sensitivity. A descriptive analysis was performed for index tests with less than four studies available or when substantial heterogeneity was evident on forest plots that precluded a meta-analysis.

We visually assessed forest plots for heterogeneity among the studies within each index test and in the summary plots we examined the variability in estimates and the width of the prediction region, with a wider prediction region suggesting more heterogeneity. We also report an estimate of τ2 (along with its standard error) corresponding to the variance of the logit-transformed specificity and sensitivity, which can be interpreted as a measure of between-study variability.

The initial protocol planned for sensitivity analysis excluding case-control studies, but none were identified amongst the studies included. We anticipated that studies included in the meta-analysis would be heterogeneous in many respects. Therefore, we pre-specified subgroups by antibody status. Furthermore, we planned to examine the effect of specimen condition (fresh vs. frozen), HBV and HIV status and genotype in a meta-regression. Where meta-regression to assess impact of covariates was not possible due to limited data, we showed descriptive statistics for HIV and HBV coinfection and genotype distribution. The impact of specimen condition could not be assessed as all studies either used frozen samples or did not specify condition.

Analysis of quantitative data

Where quantitative data were available from the studies, a locally weighted regression smoother was used to visually assess the correlation between quantitative HCV Ag measured in fmol/L to HCV RNA measured in IU/mL.15 We identified outliers and performed descriptive statistics of these points. There was only enough quantitative data to assess the Abbott ARCHITECT assay.

5. Results

Results of the search

From the literature search, 8146 citations were identified and a total of 313 full-text articles were reviewed: 283 applied to PICO 5a, 11 applied to PICO 5b (reported separately), and 44 applied to PICO 9. For PICO 5a, 50 studies were included. For PICO 9, 4 studies were included. Figure 1ad shows the PRISMA diagram with the flow of studies for each PICO and reasons for exclusion.

Description of studies

Core antigen for HCV detection (PICO 5a) – included studies

Fifty included studies utilized the 7 different HCV cAg assays described above, with two performing direct comparisons between two or more antigen tests.16,17 Four studies were translated from Mandarin,18 1 from German,19 1 from French,20 and 2 from Japanese.21,22 Characteristics for each study are presented in Table 1a.

The Abbott ARCHITECT HCV Ag assay was assessed in 30 studies.5,16,18,19,2349 All study designs were either cross-sectional or cohort, with a broad study population (included patients with HCV disease, and those susceptible to HCV disease) with the exception of one study that evaluated only healthy blood donors.35 Only 20 had enough data to be included in the bivariate analysis.34 Ten did not have enough data to calculate specificity16,17,18,28,31,36,37,41,42,45 and were only included in the univariate pooled sensitivity estimate. All but 3 studies specified positive HCV Ab status of specimens19,25,26 and 4 included data for HCV Ab negative samples.18,24,42,45,48 Demographic data was available in 18 studies, the remainder utilized anonymous specimens and authors were unable to provide further information. HIV status was known in 15 of the studies with 2 including only HIV-coinfected subjects.46,48 HBV status was known in 13 studies and all but 4 excluded patients with HBV coinfection. The study with highest prevalence included 50.5% with HBV coinfection.40 Only 1 study included children.28

The Bio-RAD MonolisaTM HCV Ag-Ab ULTRA was used in 5 studies;17,20,5052 all were cohort or cross-sectional in design with a broad study population. One study had an unknown amount of participants with at least 25 known subjects and an additional 94 samples from an unknown amount of donors.48 Two included only HIV-coinfected adult subjects,20,51 the remaining 3 had unknown subject demographic information.

The EIKEN Lumispot HCV Ag was performed in one cross-sectional study with a broad study population.53 Further demographic information was unavailable.

The EIKEN Lumispot HCV Ag, Fujirebio Lumipulse Ortho HCV Ag, and Abbott ARCHITECT HCV Ag were compared in 1 cross-sectional study,16 with unknown demographic information.

Four studies assessed the Hunan Jynda Bioengineering Group HCV Core Ag ELISA.5457 Two studies had a cohort design, 2 cross-sectional, and 1 assessed a healthy blood donor population56 while the others included broad study populations. HIV and HBV coinfection status was unknown in all studies. One included children,57 and the remaining had unknown age groups included.

The DiaSorin S.A. Murex Ag/Ab EIA was used in 4 articles, 3 adult cohort studies5860 and 1 cross-sectional study that compared performance with the Bio-RAD MonolisaTM HCV Ag-Ab ULTRA;17 this is the same study as above with an unknown total number of participants. One study included 25% HIV-coinfected patients,59 and one included 6.1% HBV co-infected patients.60

Finally, 6 articles utilized the Ortho ELISA-Ag test.6164 All were either cross-sectional or cohort designs in broad study populations except for 1 study performed in healthy blood donors.63 All had unknown demographic information.

Core antigen in best testing strategy for identification of active HCV infection (Pico 5b) – included studies

Only 1 study was found to meet inclusion criteria.43 Given limited data, a decision analysis was performed to address this PICO question and was reported separately.

Core sntigen for treatment monitoring and test of cure (PICO 9) – included studies

Two studies evaluated the Abbott ARCHITECT compared to NAT at baseline, EVR and SVR, one used patients enrolled in a randomized controlled trial65 and one used a cohort design.66 One study used the ARCHITECT to assess correlation of HCVcAg and NAT at EVR only. Three cohort studies evaluated HCVcAg kinetics during EVR to assess predictive accuracy of SVR, but did not compare HCVcAg to NAT at SVR. One used the ARCHITECT,67 and 2 employed the Fujirebio Lumipulse.68,69 None required translation. Characteristics are presented in Table 1b. All studies included patients with active HCV infection who were initiated on interferon based treatment regimens.

Excluded studies

A list of excluded studies for each PICO and the reasons for exclusion is presented in appendix D.

Methodological quality (QUADAS-2)

The overall methodological quality of all included studies for each PICO question organized by QUADAS-2 domain is summarized in Fig. 2 and presented for each individual study in Fig. 3.

Patient selection
PICO 5a

In the “patient selection” domain, we judged 2 studies to have “high risk of bias” because they used convenience sampling of participants for enrolment. Twenty-three studies were judged to be “low risk of bias”. In 25 studies risk of bias was “unclear” with 12 having both unspecified enrolment and prior exclusion strategies and the remaining 13 with a mix of the two. Applicability in this domain was judged to be “high risk” in 3 studies that included only healthy blood donors, and the remaining 47 were determined to be “low risk”. Setting of testing was not considered for this review as currently available tests can only be operated in specialized laboratories.

PICO 9

In the “patient selection” domain, 4 studies were judged to be “low risk of bias” as sampling was consecutive or random. One was judged to be “unclear risk of bias” as patient selection was not specified. Applicability was judged to be “low risk” in all studies as all included patients with active HCV infection.

Index test
PICO 5a

All studies were determined to have “low risk of bias” as all index tests had predefined thresholds of positivity and interpretation does not require judgement thus all were considered blinded with respect to the results of the reference test. Applicability in this domain was assessed by whether or not the index test was performed per recommendations of the manufacturer. In 3 studies, this was unclear and information could not be obtained from the study authors, thus 3 were determined to be “unclear risk” while the remaining 47 were “low risk”.

PICO 9

All studies were determined to have “low risk of bias” as all index tests had predefined thresholds of positivity and interpretation does not require judgement. For applicability, it was unclear in 1 study whether the index test was performed per recommendation of the manufacturer and was thus judged “unclear”. The remaining 4 studies were “low risk”.

Reference standard
PICO 5a and PICO 9

All studies were judged to be “low risk of bias” per our QUADAS-2 rules. Though studies used a variety of NAT techniques, all are considered highly sensitive and results are objective and do not require interpretation. As far as “applicability”, this was also determined to be “low risk” for all studies as circulating virus detected by NAT is by definition associated with active infection and the specificity of the reference standard is high.

Flow and timing
PICO 5a

In the “flow and timing” domain, 42 studies were judged “low risk of bias”. Eight studies were judged to be “unclear risk of bias”. In 7 it could not be determined whether the index and reference tests were performed on the same specimen or within <1 month, and in 1 there were an unknown number of participants so we could not judge if all were included in the final analysis.

PICO 9

Four studies were judged to be “low risk” as index test and reference testing were performed on the same specimens at various time points throughout, and all patients were included in the final analyses. One study was judged to be “high risk” as not all patients enrolled were included in the analysis, only those who completed protocol.

HCV core Ag for diagnosis of active HCV infection

Abbott ARCHITECT

There were 20 studies included in the bivariate analysis with 11 820 total samples. Based on studies reporting paired (sensitivity and specificity) data, the pooled sensitivity regardless of HCV Ab status was 93.4% (95% CI 88.7, 96.2), sensitivity was 98.7% (95% CI 96.9, 99.4), positive likelihood ratio (LR) was 71.8 (95% CI 28.6, 160.3), and negative LR 0.07 (0.04, 0.12) (Table 2, Fig. 4a). The pooled sensitivity estimate from a univariate analysis was 94.1% (95% CI 92.4, 95.7) and included 10 additional studies that only contributed data for sensitivity with a total of 12,788 samples (Table 2, Figure 4b). Among 16 studies with known HCV Ab positive samples, the sensitivity was 92.5% (95% CI 86.9, 95.8) and specificity 97.8% (95% CI 94.7, 99.1) (Table 2, Figure 4c). From 4 studies that analysed HCV Ab negative samples, the pooled sensitivity was 74.4% (95% CI 6.2, 99.2) and specificity was 98.8% (97.2, 99.5) (Table 2, Fig. 4d). Figure 5 presents the pooled sensitivity and specificity estimates (a) regardless of HCV Ab status, (b) for HCV Ab-positive samples only, and (c) for HCV Ab-negative samples. In plots (a) and (b) the summary point approached the upper left corner suggesting good accuracy of the ARCHITECT test for diagnosis of HCV infection. Plot (c) demonstrated the broad 95% confidence interval among Ab-negative specimens.

Heterogeneity was visually assessed in Figs 4 and 5 and with τ2 (Fig. 2). The studies were relatively homogeneous (Fig. 4a). A meta-regression was not possible given the limited amount of data on predefined covariates. There were three outlier studies in respect to sensitivity: Ergünay, Florea and Gu (72%, 74% and 44% sensitivity, respectively). Antibody status was known for Gu and performance was similar across antibody-positive and antibody-negative samples (44.0% and 41.7%, respectively). Other covariates were examined to assess reasons for low sensitivity. In the Ergünay study, HIV and HBV coinfection status were unknown, 60.2% of participants had HCV genotype 1b infection, 2.2% genotype 1a, 0.8% genotypes 3 and 4, and 35.8% were unknown (Table 3). In the Florea study, there were no HIV or HBV infected patients, but genotype status was unknown. For specificity, the results are even more homogeneous with only 1 outlier, the Medici study. There are no demographic data for this study as it was performed on anonymous samples. Overall, genotype distribution was reported for 15 studies (Table 3a) with genotype 1b being the most prevalent and genotypes 5 and 6 minimally studied.

Ortho ELISA-Ag

Five studies were included in the bivariate analysis with 1177 total samples. The pooled sensitivity was 93.2% (95% CI 81.6, 97.7), specificity 99.2% (95% CI 87.9, 100), positive LR 116.5 (95% CI 6.7, 977), and negative LR 0.06 (95% CI 0.02, 0.07) (Fig. 6, Table 2). Univariate analysis with one additional study by Agha resulted in a pooled sensitivity of 90.8% (95% CI 83.5, 98.2) (Table 2). Figure 7 demonstrates the bivariate pooled sensitivity and specificity estimates, with the summary point approaching the upper left corner suggesting good accuracy of the Ortho ELISA-Ag test for diagnosis of HCV infection though the data exhibit some heterogeneity demonstrated by the wide 95% CI. Heterogeneity was also visually assessed in the forest plot (Fig. 6) and with τ2 (Fig. 2) with two outlier studies, Nübling and El-Sayed. Both studies reported unknown HIV or HBV coinfection information, and genotype distribution was unknown for El-Sayed. The genotype distribution in the Nübling study was 11.5% genotype 1 not specified, 42.3% genotype 1a, 19.2% genotype 1b, 11.5% genotype 2, and 15.4% genotype 3. This study was performed in 494 total plasma samples from 52 subjects at various time points during HCV infection with varying levels of HCV RNA. The data were not stratified by antibody status, and the raw quantitative information was no longer available. The authors noted that panels later in the course of infection with higher and more consistent HCV RNA levels had improved correlation with HCVcAg detection but no sensitivity or specificity data were calculated.

Bio-RAD Monolisa HCV Ag-Ab ULTRA

Five studies with 525 total samples were included. Given heterogeneity observed in the forest plot, a pooled analysis was not performed and only descriptive statistics were examined (Fig. 8). The Nastouli and Schnuriger studies have substantially different results – sensitivities of 61.9 (95% CI 38.6, 81.9) and 95% (95% CI 75.1, 99.9), respectively. Each study was performed in participants with 100% HIV coinfection, though the genotype distribution differed with more genotype 1 patients in the Nastouli study, and more genotype 3 and 4 in the Schnuriger study (Table 3). The Tuke study demonstrated the lowest sensitivity of 28.6% (95% CI 20.4, 37.7). This study was performed in pre-seroconversion HCV Ab negative specimens only. Among the HCV genotypes, sensitivity was 33% for genotype 1a, 41% for genotype 1b, 29% for genotype 2, 0% for genotype 3, and 0% for unknown genotype (data not shown, obtained from original article). The authors also noted the sensitivity improved to 71% when limited to specimens with HCV RNA >106 IU/mL, though remained negative in 7 genotype 3 samples with viral load >2 million IU/mL. The Laperche study was also performed in HCV Ab negative specimens with a broad distribution of genotypes: 11.4% genotype 1a, 34.3% genotype 1b, 25.7% genotype 2, 14.3% genotype 3, 5.7% genotype 4, and 2.9% unknown. The sensitivity was 40.9% (95% CI 29.3, 53.2). The Vermeersch study was the largest with 337 samples and was the only with data to calculate specificity. The reported sensitivity was 93.83% (95% CI 90.2, 96.4) and specificity 94.9% (95% CI 89.9, 99.8). The study was done on anonymous samples without known HIV or HBV status or genotype. The reference standard was incomplete as RNA testing was done only on 61 random samples and all samples with discordant Ab and Ag result. Seventy-eight samples were antibody negative. Genotype distribution was unknown.

EIKEN Lumispot HCV Ag

Two studies only utilized the Lumispot assay. The first included 155 samples and the sensitivity reported was 98.1% (95% CI 95.9, 100) (Table 2).53 The majority of samples were genotype 1 (65.2%) with the remaining genotype 2. The second study (Murayama et al.) compared the Lumispot to Fujirebio Lumipulse and Abbott ARCHITECT.16 There were 80 participants, and the reported sensitivity was 97.5% (95% CI 94.1, 100). The Abbott ARCHITECT sensitivity in that study was 100%, suggesting a bias towards better performance. Not enough data were reported to determine specificity in either study.

Fujirebio Lumipulse Ortho HCV Ag

Only one study was performed using the Lumipulse test with 80 participants comparing against Lumispot and Abbott ARCHITECT.16 Sensitivity for the Lumipulse was reported as 95% (95% CI 90.2, 99.8) (Table 2). The Abbott ARCHITECT sensitivity in that study was 100%, suggesting a bias towards better performance. Not enough data was reported to determine specificity.

Hunan Jynda Bioengineering Group HCV Core Ag ELISA

There were 4 studies included in the bivariate analysis with 524 total samples. The pooled sensitivity was 59.5% (95% CI 46, 71.7), specificity 82.9% (95% CI 58.6, 94.3), positive LR 3.5 (95% CI 1.1, 12.6), and negative LR 0.28 (95% CI 0.2, 0.3; Table 2). Both the forest plot (Fig. 9) and bivariate analysis (Fig. 10; Table 2) demonstrated heterogeneity among the four studies, which limited confidence in the pooled estimate. No covariate assessment was performed as HIV status, HBV status and genotype distribution were unknown for all studies.

DiaSorin S.A. Murex Ag/Ab EIA

Four studies with a total sample size of 770 were available; however, given substantial heterogeneity in the forest plot (Fig. 11) a pooled estimate was not calculated. The sensitivity estimates varied between 50% and 100%. Heterogeneity was largely secondary to one outlier study by Tuke where a sensitivity of 50% (95% CI 40.4%, 59.6%) was reported. As reported above, this study was performed in HCV Ab-negative specimens in the “window period” of acute HCV infection. The authors note that when analysis was limited to specimens with viral load HCV RNA >106 IU/mL, there was an increase in sensitivity from 50% to 98% (data not shown). Specificity could not be calculated. The El-Emshaty study is the smallest with 39 participants and reported a sensitivity of 91.3% (95% CI 71.9, 98.9), and specificity of 100% (95% CI 75.9, 100). Genotype distribution was unknown, though the study was performed in Egypt where genotype 4 is most prevalent. The Alzahrani study included 418 samples from 118 female adult participants and reported a sensitivity of 97.4% (95% CI 92.6%, 99.5%) and specificity of 100% (95% CI 98.4, 100). Finally, the Yang study conducted in Taiwan included 201 participants, 25% with HIV coinfection, and unknown genotype distribution. The reported sensitivity was 100% (95% CI 96.5, 100) and specificity 83.8% (95%CI 74.8, 90.2).

Quantitative data

Three studies provided quantitative data for analysis.33,41,44 All used the Abbott ARCHITECT HCV Core Ag Assay in comparison with NAT. Non-parametric regression of these pooled quantitative data was used to visually assess the correlation between HCVcAg and RNA (Fig. 12). The few points with negative HCVcAg were shown to occur at RNA levels < 3000 IU/mL where loss of linearity was also noted. There were two outlier points between 10 000 and 100 000 IU/mL and an additional point on the threshold cut-off for positivity. No further data on genotype or coinfection information was provided to further characterize these points.

HCV core Ag for treatment monitoring

Two studies evaluated HCVcAg compared to NAT at SVR, both using the Abbott ARCHITECT index test.65,66 One additional study assessed the accuracy of HCVcAg compared to NAT at EVR only.67 There were not enough studies to perform a meta-analysis. Results for sensitivity and specificity of the index test compared to NAT at baseline, EVR, and SVR were calculated and summarized in Table 4. These data do not evaluate the accuracy of HCVcAg at EVR to predict SVR but rather assess how the tests correlate at each specific time point and thus shed light on differences in the kinetics of core antigen and RNA. Two additional studies assessed timing of HCVcAg in EVR as a predictor of SVR using the Fujiribio Lumipulse test.68,69 Descriptive statistics of each including demographic data, HIV and HBV coinfection, and HCV genotype distribution are presented in Tables 1b and 3b.

HCV core Ag performance at different time-points during treatment

The Feng study included 32 adults without HIV or HBV coinfection. All participants had genotype 1b chronic HCV infection with viral loads >2000 IU/mL. The sensitivity of HCVcAg at baseline, EVR, and SVR was reported to be 100%, though specificity of EVR was 88.9% (95% CI 68.4, 100). There were 21 patients who achieved SVR, and 11 whose HCVcAg and HCV RNA remained positive 24 weeks after completion of therapy. In all 11 patients, the HCV viral load was >104 IU/mL.

The Loggi-study enrolled 35 adult patients without HIV or HBV coinfection; 20% had genotype 1a, 80% had genotype 1b HCV infection. Seventeen patients achieved sustained virological response. The baseline sensitivity of the HCVcAg was 100% without enough data to calculate specificity. Sensitivity at EVR was 73.5% (95% CI 58.7, 88.4) with 100% specificity. The false negatives occurred in samples with viral loads between 15 and 10 000 IU/mL. For SVR, the sensitivity was 100% with 94.1% specificity (95% CI 82.9, 100).

The Moscato study analysed samples from 23 patients with unknown demographic information and included 4% genotype 1a, 39.1% genotype 1b, 26.1% genotype 2, 21.7% genotype 3, and 8.7% genotype 4. Baseline and SVR data comparing HCVcAg to NAT were not reported. Direct comparison of HCVcAg compared to NAT at 4 weeks for 10 patients had 100% sensitivity with 70% specificity (95% CI 41.6, 98.4). Three false-positive HCVcAg results were obtained: for 1 of which HCVcAg turned negative 1 month later and 2 turned negative 2 months later (12 weeks into therapy). For three patients tested at 12 weeks, correlation between qualitative results of HCVcAg and HCV NAT was complete. In 9 additional patients with unknown demographic data, correlation between quantitative HCV RNA and HCVcAg was assessed in 54 serum specimens collected at various time points during treatment. Among these samples, authors reported 100% sensitivity of cAg, including 9 specimens with low-level viraemia between 100 and 1000 IU/mL.

HCV Core Ag as a predictor of SVR
Abbott ARCHITECT

Included in the Feng study presented above, was an assessment of measurement of HCVcAg for EVR as a predictor of SVR. The study found a sensitivity of 100% with a specificity of 28% of EVR to predict SVR. This translated into a positive predictive value (PPV) 72% and a negative predictive value (NPV) of 100%. At 4 weeks after therapy initiation (RVR), the performance was inversed with a sensitivity of 29% and a specificity of 100%. The best measure was identified to be a log10 reduction in HCVcAg (ΔHCV Ag) at 144 hours with 95% sensitivity and 73% specificity.

Fujirebio Lumipulse

The Takahashi study included 60 genotype 1b patients, and 30 genotype 2 patients with unknown HIV and HBV coinfection status. Serum HCV core Ag was measured at baseline and at 3 days, 1 week, 2 weeks, 4 weeks, and 12 weeks of treatment while qualitative NAT was performed at 12 weeks to assess EVR, and 24 weeks after completion of therapy for SVR. SVR was achieved in 50% of genotype 1b patients, and 90% of genotype 2 patients. In genotype 1b patients, HCVcAg was higher at each time point among the non-SVR group compared to the SVR group, while in genotype 2 patients there was no difference seen in HCVcAg quantity over time between the 3 non-SVR patients and those who achieved SVR, and HCVcAg was below detection limit in all genotype 2 patients by day 14. For genotype 1b, HCVcAg level on day 7 was found to be the best predictor for SVR with sensitivity 79.4%, specificity 88.5%, PPV 90%, NPV 76.7%, and accuracy of 83.3% (Table 5).

In the Fujino study, 49 adult genotype 1b patients were initially enrolled, though 44 completed protocol and were included in the analysis. Patients with HBV were excluded and HIV status was not described. SVR was achieved in 10 patients. HCVcAg and RNA were measured on days 1, 7, and 14 of therapy. Four of the SVR group had negative HCVcAg on day 1 of therapy while all had positive NAT. Negative HCVcAg on day 7 of therapy gave sensitivity 57.1%, specificity 93.3%, PPV 80%, NPV 82.4%, and accuracy of 81.8% in prediction of SVR (Table 5), while undetectable HCV RNA on day 7 yielded sensitivity 100%, specificity 87.2%, PPV 50%, NPV 100%, and accuracy of 88.6%.

6. Discussion

This systematic review addressed diagnostic accuracy of HCV core antigen tests for identification of active HCV infection among those with and without positive HCV antibody through an analysis of 50 published studies (PICO5a) that utilized 7 different index tests. Additionally, accuracy of HCV core antigen tests for treatment monitoring and as a test of cure was assessed in 5 published studies (PICO 9).

The Abbott ARCHITECT HCV Core Antigen test had the highest sensitivity (93.4%), while specificity was similar to that of the Ortho ELISA-Ag (98.7% vs 99.2%). The estimates for both sensitivity and specificity were more precise for the ARCHITECT assay. This was partly because the ARCHITECT was the most extensively studied, with 30 publications included in this review compared to 5 studies included for Ortho, but also partly because of the greater homogeneity among the ARCHITECT studies. The likelihood ratios for both tests were also very favourable with the positive LR >10 indicative of a large increase in probability of disease with a positive result and negative LR <0.1 indicative of a moderate decrease in the probability of disease with a negative result. The EIKEN Lumispot and Fujirebio Lumipulse were designed with the same principle of technology as the ARCHITECT and have similar sensitivity and specificity, though assessment was limited to 1 and 2 studies. Tests such as the Hunan Jynda assay have the lowest sensitivity (59.5%), which supports the notion that signal amplification (as with chemiluminesence) is necessary to achieve adequate detection limits.

Quantitative analysis of data available from 3 studies using the ARCHITECT demonstrated close correlation between HCVcAg and RNA, though the linearity declined around an HCV RNA level of 3000 IU/mL, which is consistent with the analytical limit of detection reported by Abbott.

All studies included with treatment monitoring and SVR data were in patients on interferon (IFN)-based therapies. Data was limited and a meta-analysis was not possible. Descriptive analysis found the sensitivity of ARCHITECT at EVR in comparison to RNA ranging from 74% to 100% with specificity from 70% to 100% and at SVR (only assessed in 2 studies) sensitivity was 100% and specificity ranged from 94% to 100%. HCVcAg predictive accuracy for SVR was described in only 3 studies, 1 using the ARCHITECT and 2 using the Lumipulse. All three included mostly genotype 1b patients, and results indicated best predictive accuracy of core antigen for SVR from the decline or reversion to negative early on in therapy at 6–7 days.

There were limitations in the data summarized in this review. For several index tests, there were not enough studies to derive pooled estimates and descriptive analyses only could be completed. There was substantial heterogeneity among all index tests aside from the ARCHITECT, and there were not enough data to perform planned sensitivity analyses of covariates and meta-regression of subgroups; thus descriptive statistics were substituted. From the limited data available, it is clear that data on core antigen test performance in genotypes 4, 5 and 6 is largely lacking, which limits the conclusions. Most of the studies were performed in high-resource settings and might not be reflective of the population that will be tested if HCVcAg diagnostics are implemented in LMICs. Furthermore, most studies were performed in reference laboratories and test performance might be decreased if tests are applied in routine laboratories.

To assess treatment monitoring, only 2 studies measured HCVcAg in comparison with NAT at SVR and only descriptive analyses could be conducted. Several of the studies found in the search were designed to answer a different question from that of the PICO structure – whether an early decline in HCVcAg could predict SVR and at what time period this was most accurate. These data were also described, though again meta-analysis could not be performed. Additionally, there were no studies using DAA IFN-free treatment regimens, thus the results from this descriptive analysis might not be reflective of the results that are to be expected with DAAs. The timing of this review has also occurred during a rapidly changing landscape; the utility of viral load monitoring while on treatment with these highly effective therapies, and thus utility of HCVcAg as a surrogate of NAT, has been called into question.9

Strengths and limitations of the systematic review

Strengths of this review include the development of an a priori protocol for the literature search, article selection, data extraction, and assessment of methodological quality. The search was performed without language restriction, though ultimately 3 articles were excluded for inability to find appropriate translation for Russian, Korean and Polish. Nevertheless, studies may have been missed in the comprehensive search, and subsequent studies published after the search date could not be included. Article selection and standardized data extraction in accordance with the predefined protocol was ensured by independent reviewers. Authors were contacted for missing data and clarifications, though some studies were excluded due to lack of author response or inability to provide original data. In the analysis, bivariate random effects modeling was used when appropriate to derive pooled estimates and univariate analyses were performed in effort to utilize all available data.

Further research suggested

The data limitations in this review highlight a need for better surveillance data that will inform an understanding of how many patients are missed by assays that have higher limits of detection (e.g. 3000 IU/mL for ARCHITECT). Furthermore, a better understanding is necessary on the outcomes of patients with low viral loads: are these patients more likely to resolve their infection or at least less prone to develop HCV disease, or do they still have notable disease progression that would make them eligible for treatment? Similarly, more information is necessary on patients with high viral loads and negative HCVcAg to inform the optimization of antigen detection. The fluctuation in RNA during the pre-seroconversion phase and correlation of core antigen is also poorly understood.

Additionally, research is required to determine how covariates such as HIV or HBV coinfection or genotype may impact the accuracy of HCVcAg for diagnosing active infection as well as for monitoring treatment outcomes. The kinetics of HCVcAg with treatment also need to be evaluated further, particularly in the context of new DAA regimens.

7. Summary

In summary, this systematic review showed that there are several HCVcAg assays associated with high sensitivity (>90%) and specificity (>98%) compared with NAT. While even those with the highest performance do not reach the sensitivity of NAT, well-performing HCVcAg tests with an analytical sensitivity reaching into the femtomolar range (~3000 IU/mL), which translates into diagnostic sensitivity of about 95%, could serve as a replacement for NAT for HCV detection. This is the case particularly if HCVcAg are more affordable than NAT, which is conceivable from the cost of goods for the test. Furthermore, HCVcAg tests could be applied for a one-step screening test as they turn positive earlier than antibody tests (1–2 days after HCV RNA appears) and have a high specificity, thus not requiring any further confirmatory testing.

For both core antigen tests and NATs to reach a larger population at risk in LMICs, tests with better point-of-care (POC) suitability need to be developed and sample processing and transport mechanisms need to be improved to optimize the use of platforms requiring reference laboratories. HCVcAg tests are possible on a POC platform; however, given the need for signal amplification (as suggested by this review), an instrument-free assay is not conceivable in the near future. Furthermore, sample processing is necessary.

The role for HCVcAg as a substitute for NAT in assessment for SVR remains less clear. While the two studies presented show excellent results, and the quantitative data from PICO5a supports close correlation of HCVcAg with RNA above 3000 IU/mL, the kinetics of HCVcAg with treatment are not fully understood. Particularly, data on the early kinetics of HCVcAg, and the appropriate timing of assessment for predicting SVR are limited.

Acknowledgements

We would like to thank all of the authors of the studies who provided additional data necessary to complete this review. We also wish to thank the following individuals: Kuniaki Arai at the World Health Organization for translation and extraction of articles in Japanese, Jeanne Chauffor at Médecins Sans Frontières and Audrey Albertini at FIND for translation articles in French, Wei Huang at Boston Medical Center for translation and extraction of articles in Mandarin, Joseph Tucker at University of North Carolina for translation of author communication in Mandarin, David Flynn from Boston University School of Medicine Alumni Medical Library, Genevieve Gore from McGill University and Melanie Cedrone from the Biomedical Library at University of Pennsylvania for their help with search terms, and Ranald Sutherland and Martin Brusdeilins from FIND for their input on the technical aspects and commercial availability of HCV Core Ag tests.

References

1.
Gower E , EstesC, BlachS, Razavi-ShearerK, RazaviH. Global epidemiology and genotype distribution of the hepatitis C virus infection. J Hepatol. 2014;61:(1 Suppl):S45–S57. [PubMed: 25086286]
2.
Smith DB , BukhJ, KuikenC, MuerhoffAS, RiceCM, StapletonJT, et al. Expanded classification of hepatitis C virus into 7 genotypes and 67 subtypes: updated criteria and genotype assignment web resource. Hepatology. 2014;59(1):318–27. [PMC free article: PMC4063340] [PubMed: 24115039]
3.
Reed KE , RiceCM. Overview of hepatitis C virus genome structure, polyprotein processing, and protein properties. Curr Top Microbiol Immunol. 2000;242:55–84. [PubMed: 10592656]
4.
ubuisson J . Hepatitis C virus proteins. World J Gastroenterol. 2007;13(17):2406–15. [PMC free article: PMC4146758] [PubMed: 17552023]
5.
Tedder RS , TukeP, WallisN, WrightM, NicholsonL, GrantPR. Therapy-induced clearance of HCV core antigen from plasma predicts an end of treatment viral response. J Viral Hepat. 2013;20(1):65–71. [PubMed: 23231086]
6.
Sanz C , TassiesD, CostaJ, FreireC, PereiraA. The first case of HCV infection detected before seroconversion in blood donors tested by HCV core antigen ELISA. Transfusion. 2002;42(4):505–6. [PubMed: 12076300]
7.
Tanaka E , KiyosawaK, MatsumotoA, KashiwakumaT, HasegawaA, MoriH, et al. Serum levels of hepatitis C virus core protein in patients with chronic hepatitis C treated with interferon alfa. Hepatology. 1996;23(6):1330–3. [PubMed: 8675147]
8.
Tillmann HL . Hepatitis C virus core antigen testing: role in diagnosis, disease monitoring and treatment. World J Gastroenterol. 2014;20(22):6701–6. [PMC free article: PMC4051911] [PubMed: 24944462]
9.
Sidharthan S , KohliA, SimsZ, NelsonA, OsinusiA, MasurH, et al. Utility of hepatitis C viral load monitoring on direct-acting antiviral therapy. Clin Infect Dis. 2015;60(12):1743–51. [PMC free article: PMC4834854] [PubMed: 25733369]
10.
Ford N , SwanT, BeyerP, HirnschallG, EasterbrookP, WiktorS. Simplification of antiviral hepatitis C virus therapy to support expanded access in resource-limited settings. J Hepatol. 2014;61:(1 Suppl):S132–S138. [PubMed: 25443341]
11.
Deville WL , BuntinxF, BouterLM, MontoriVM, de VetHC, van der WindtDA, et al. Conducting systematic reviews of diagnostic studies: didactic guidelines. BMC Med Res Methodol. 2002;2:9. [PMC free article: PMC117243] [PubMed: 12097142]
12.
Pai M , McCullochM, GormanJD, PaiN, EnanoriaW, KennedyG, et al. Systematic reviews and meta-analyses: an illustrated, step-by-step guide. Natl Med J India. 2004;17(2):86–95. [PubMed: 15141602]
13.
Committee on Standards for Systematic Reviews of Comparative Effectiveness Research. In: EdenJ, LevitL, BergA, MortonS, editors. Finding what works in health care: standards for systematic reviews. Washington (DC): National Academy of SCiences; 2011. [PubMed: 24983062]
14.
Whiting PF , RutjesAW, WestwoodME, MallettS, DeeksJJ, ReitsmaJB, et al. QUADAS-2: a revised tool for the quality assessment of diagnostic accuracy studies. Ann Intern Med. 2011;155(8):529–36. [PubMed: 22007046]
15.
Cleveland W . Robust locally weighted regression and smoothing scatterplots. J Am Stat Assoc. 1979;74(368):829–36.
16.
Murayama A , SugiyamaN, WatashiK, MasakiT, SuzukiR, AizakiH, et al. Japanese reference panel of blood specimens for evaluation of hepatitis C virus RNA and core antigen quantitative assays. J Clin Microbiol. 2012;50(6):1943–9. [PMC free article: PMC3372108] [PubMed: 22495557]
17.
Tuke PW , GrantPR, WaiteJ, KitchenAD, EglinRP, TedderRS. Hepatitis C virus window-phase infections: closing the window on hepatitis C virus. Transfusion. 2008;48(4):594–600. [PubMed: 18194388]
18.
Gu J , YuT, LiangZ. Performances of HCV Ag or HCV RNA kits for screening of HCV-infected samples. Chinese Journal of Biologicals. 2014;27(9):1181–84.
19.
van Helden J , WeiskirchenR. [Hepatitis C diagnostics: clinical evaluation of the HCV-core antigen determination]. Z Gastroenterol. 2014;52(10):1164–70. [PubMed: 25313628]
20.
Schnuriger A , DominguezS, ValantinMA, TubianaR, DuvivierC, GhosnJ, et al. Early detection of hepatitis C virus infection using a new combined antigen-antibody detection assay: potential use in HIV co-infected individuals. Pathol Biol (Paris). 2006;54(10):578–86. [PubMed: 17030457]
21.
Ohta H , TakemuraM, FurutaN, AkiyamaM, KatagiriY, OhashiH, et al. Clinical significance and problems in HCV measurement – comparison of CLEIA method with PCR method. Rinsho Byori. 2004;52(10):813–8. [PubMed: 15624496]
22.
Okazaki K , NishiyamaY, SaitouT, ShibataN, YamamotoC, OosagaJ, et al. [Fundamental evaluation of HCV core antigen method comparison with Cobas Amplicor HCV monitor v2.0 (high range method)]. Rinsho Byori. 2008;56(2):95–100. [PubMed: 18402050]
23.
Buket CA , AyseA, SelcukK, SuleymanO, EmelSC. Comparison of HCV core antigen and anti-HCV with HCV RNA results. Afr Health Sci. 2014;14(4):816–20. [PMC free article: PMC4370059] [PubMed: 25834488]
24.
Chevaliez S , SoulierA, PoiteauL, Bouvier-AliasM, PawlotskyJM. Clinical utility of hepatitis C virus core antigen quantification in patients with chronic hepatitis C. J Clin Virol. 2014;61(1):145–8. [PubMed: 24973282]
25.
Descamps V , Op de BeeckA, PlassartC, BrochotE, FrancoisC, HelleF, et al. Strong correlation between liver and serum levels of hepatitis C virus core antigen and RNA in chronically infected patients. J Clin Microbiol. 2012;50(2):465–8. [PMC free article: PMC3264181] [PubMed: 22162563]
26.
Durante-Mangoni E , VallefuocoL, SorrentinoR, IossaD, PernaE, MolaroR, et al. Clinico-pathological significance of hepatitis C virus core antigen levels in chronic infection. J Med Virol. 2013;85(11):1913–8. [PubMed: 23897630]
27.
Thong VD , AkkarathamrongsinS, AvihingsanonA, TheamboonlersA, PoovorawanY, TangkijvanichP. The correlation between hepatitis C core antigen and hepatitis C virus RNA levels with respect to human immunodeficiency virus status, hepatitis C virus genotype and interferon-lambda-4 polymorphism. Intervirology. 2015;58(2):73–9. [PubMed: 25677196]
28.
Ergunay K , SenerB, AlpA, KarakayaJ, HascelikG. Utility of a commercial quantitative hepatitis C virus core antigen assay in a diagnostic laboratory setting. Diagn Microbiol Infect Dis. 2011;70(4):486–91. [PubMed: 21767705]
29.
Florea D , NeagaE, NicolaeI, MaximD, PopaM, OteleaD. Clinical usefulness of HCV core antigen assay for the management of patients with chronic hepatitis C. J Gastrointestin Liver Dis. 2014;23(4):393–6. [PubMed: 25531997]
30.
Garbuglia AR , MonachettiA, GalliC, SabatiniR, FerreriML, CapobianchiMR, et al. HCV core antigen and HCV-RNA in HIV/HCV co-infected patients with different HCV genotypes. BMC Infect Dis. 2014;14:222. [PMC free article: PMC4029812] [PubMed: 24758157]
31.
Hadziyannis E , MinopetrouM, GeorgiouA, SpanouF, KoskinasJ. Is HCV core antigen a reliable marker of viral load? An evaluation of HCV core antigen automated immunoassay. Ann Gastroenterol. 2013;26(2):146–9. [PMC free article: PMC3959936] [PubMed: 24714621]
32.
Heidrich B , PischkeS, HelfritzFA, MederackeI, KirschnerJ, SchneiderJ, et al. Hepatitis C virus core antigen testing in liver and kidney transplant recipients. J Viral Hepat. 2014;21(11):769–79. [PubMed: 24251818]
33.
Kadkhoda K , SmartG. HCV antigen testing for the diagnosis of hepatitis C infection: a cost-efficient algorithm. Clin Lab. 2014;60(4):677–80. [PubMed: 24779304]
34.
Karabay O , ÖğütlüA, AnkaraliH, ÖzdemirF, KarabayM, GozdasH. Comparison of HCV RNA and HCV core antigen in genotype 1 chronic hepatitis C patients. Acta Medica Mediterranea. 2014;30(5):1025–28.
35.
Kesli R , PolatH, TerziY, KurtogluMG, UyarY. Comparison of a newly developed automated and quantitative hepatitis C virus (HCV) core antigen test with the HCV RNA assay for clinical usefulness in confirming anti-HCV results. J Clin Microbiol. 2011;49(12):4089–93. [PMC free article: PMC3233016] [PubMed: 21940466]
36.
Köroğlu M , AkS, AkM, YakupoğullarıY, ÖzerA. Evaluation of diagnostic performance of new antigen-based enzyme immune assay for diagnosis of hepatitis C virus (HCV) infections. Afr J Microbiol Res. 2012;6(4):809–12.
37.
Kuo YH , ChangKC, WangJH, TsaiPS, HungSF, HungCH, et al. Is hepatitis C virus core antigen an adequate marker for community screening?J Clin Microbiol. 2012;50(6):1989–93. [PMC free article: PMC3372126] [PubMed: 22461676]
38.
Li Cavoli G , ZagarrigoC, SchillaciO, ServilloF, TralongoA, CoglitoreM, et al. Hepatitis C virus core antigen test in monitoring of dialysis patients. Hepat Res Treat. 2012;2012:832021. [PMC free article: PMC3523129] [PubMed: 23304475]
39.
Mederacke I , CiesekS, RaupachR, WursthornK, DeterdingK, SteinmannE, et al. Kinetics of HCV core antigen during antiviral treatment of acute and chronic hepatitis C as determined by a novel chemiluminescent microparticle immunoassay. In: The International Liver Congress TM 2009. 44th Annual Meeting of the European Associateion for the Study of the Liver (EASL); Copenhagen, Denmark; 2009 [S129].
40.
Mederacke I , PotthoffA, Meyer-OlsonD, MeierM, RaupachR, MannsMP, et al. HCV core antigen testing in HIV- and HBV-coinfected patients, and in HCV-infected patients on hemodialysis. J Clin Virol. 2012;53(2):110–5. [PubMed: 22177274]
41.
Medici MC , FurliniG, RodellaA, FuertesA, MonachettiA, CalderaroA, et al. Hepatitis C virus core antigen: analytical performances, correlation with viremia and potential applications of a quantitative, automated immunoassay. J Clin Virol. 2011;51(4):264–9. [PubMed: 21621454]
42.
Miedouge M , SauneK, KamarN, RieuM, RostaingL, IzopetJ. Analytical evaluation of HCV core antigen and interest for HCV screening in haemodialysis patients. J Clin Virol. 2010;48(1):18–21. [PubMed: 20233674]
43.
Ottiger C , GygliN, HuberAR. Detection limit of architect hepatitis C core antigen assay in correlation with HCV RNA, and renewed confirmation algorithm for reactive anti-HCV samples. J Clin Virol. 2013;58(3):535–40. [PubMed: 24041472]
44.
Park Y , LeeJH, KimBS, Kimdo Y, HanKH, KimHS. New automated hepatitis C virus (HCV) core antigen assay as an alternative to real-time PCR for HCV RNA quantification. J Clin Microbiol. 2010;48(6):2253–6. [PMC free article: PMC2884480] [PubMed: 20351215]
45.
Reyes-Mendez MA , Juarez-FigueroaL, Iracheta-HernandezP, Medina-IslasY, Ruiz-GonzalezV. Comparison of two diagnostic algorithms for the identification of patients with HCV viremia using a new HCV antigen test. Ann Hepatol. 2014;13(3):337–42. [PubMed: 24756008]
46.
Rouet F , DeleplancqueL, MboumbaBB, SicaJ, Mouinga-OndemeA, LiegeoisF, et al. Usefulness of a fourth generation ELISA assay for the reliable identification of HCV infection in HIV-positive adults from Gabon (Central Africa). PLoS One. 2015;10(1):e0116975. [PMC free article: PMC4305295] [PubMed: 25617896]
47.
Russi S , SansonnoD, MariggioMA, VinellaA, PavoneF, LaulettaG, et al. Assessment of total hepatitis C virus (HCV) core protein in HCV-related mixed cryoglobulinemia. Arthritis Res Ther. 2014;16(2):R73. [PMC free article: PMC4060364] [PubMed: 24636026]
48.
Vanhommerig JW , van de LaarTJ, KootM, van RooijenMS, SchinkelJ, SpeksnijderAG, et al. Evaluation of a hepatitis C virus (HCV) antigen assay for routine HCV screening among men who have sex with men infected with HIV. J Virol Methods. 2015;213:147–50. [PubMed: 25528203]
49.
Vermehren J , SusserS, BergerA, PernerD, PeifferKH, AllwinnR, et al. Clinical utility of the ARCHITECT HCV Ag assay for early treatment monitoring in patients with chronic hepatitis C genotype 1 infection. J Clin Virol. 2012;55(1):17–22. [PubMed: 22698697]
50.
Laperche S , Le MarrecN, GiraultA, BouchardeauF, Servant-DelmasA, Maniez-MontreuilM, et al. Simultaneous detection of hepatitis C virus (HCV) core antigen and anti-HCV antibodies improves the early detection of HCV infection. J Clin Microbiol. 2005;43(8):3877–83. [PMC free article: PMC1234013] [PubMed: 16081925]
51.
Nastouli E , ThomsonEC, KarayiannisP, MainJ, McClureM, MuirD. Diagnosing acute hepatitis C in HIV-infected patients: nucleic acid testing compared with antibody and antigen-antibody detecting methods. J Clin Virol. 2009;44(1):78–80. [PubMed: 18986830]
52.
Vermeersch P , Van RanstM, LagrouK. Evaluation of the use of a combined HCV antigen/antibody assay in routine laboratory practice. Acta Clin Belg. 2010;65(4):245–7. [PubMed: 20954463]
53.
Saito R , YokotaH, TakahashiE, MashigeF, YoneyamaA, NakaharaK, et al. Performance of an automated system for quantitation of hepatitis C virus core antigen. J Virol Methods. 2003;112(1–2):93–7. [PubMed: 12951216]
54.
Lu YC , JiangZY, KuangYL, ChenWS, TanYZ, LiDR. Clinical value of the detection of hepatitis C virus core antigen. Xi Bao Yu Fen Zi Mian Yi Xue Za Zhi. 2007;23(7):635–7. [PubMed: 17618587]
55.
Ouyang Y , TanDM, LiTG, ZhouH, TanC. Qualitative detection of hepatitis C virus core antigen in the serum in patients with chronic hepatitis C. Zhong Nan Da Xue Xue Bao Yi Xue Ban. 2006;31(6):894–6, 905. [PubMed: 17213591]
56.
Zhang HQ , LiSB, WangGH, ChenK, SongXG, FengXY. Detection of hepatitis C virus core antigen for early diagnosis of hepatitis C virus infection in plasma donor in China. World J Gastroenterol. 2007;13(19):2738–42. [PMC free article: PMC4147125] [PubMed: 17569145]
57.
Zhu H , ZhangT, FanC, XiaoX, ZhangF. Clinical significance of testing hepatitis C virus core antigen. Journal of Dalian Medical University. 2010;32(2):211–2, 8.
58.
El-Emshaty WM , RaafatD, ElghannamDM, SaudyN, EltorabyEE, MetwalliAE. Diagnostic performance of an immunoassay for simultaneous detection of HCV core antigen and antibodies among haemodialysis patients. Braz J Microbiol. 2011;42(1):303–9. [PMC free article: PMC3768914] [PubMed: 24031636]
59.
Yang JF , LinYY, HsiehMH, TsaiCH, LiuSF, YuML, et al. Performance characteristics of a combined hepatitis C virus core antigen and anti-hepatitis C virus antibody test in different patient groups. Kaohsiung J Med Sci. 2011;27(7):258–63. [PubMed: 21757142]
60.
Alzahrani AJ . Simultaneous detection of hepatitis C virus core antigen and antibodies in Saudi drug users using a novel assay. J Med Virol. 2008;80(4):603–6. [PubMed: 18297713]
61.
Agha S , TanakaY, SaudyN, KurbanovF, Abo-ZeidM, El-MalkyM, et al. Reliability of hepatitis C virus core antigen assay for detection of viremia in HCV genotypes 1, 2, 3, and 4 infected blood donors: a collaborative study between Japan, Egypt, and Uzbekistan. J Med Virol. 2004;73(2):216–22. [PubMed: 15122795]
62.
el-Sayed Zaki M , el-AdrosyH. Recent approach for diagnosis of early HCV infection. Egypt J Immunol. 2004;11(1):123–9. [PubMed: 15724394]
63.
Letowska M , BrojerE, MikulskaM, GronowskaA, RosiekA. Hepatitis C core antigen in Polish blood donors. Transfusion. 2004;44(7):1067–71. [PubMed: 15225249]
64.
Nubling CM , UngerG, ChudyM, RaiaS, LowerJ. Sensitivity of HCV core antigen and HCV RNA detection in the early infection phase. Transfusion. 2002;42(8):1037–45. [PubMed: 12385416]
65.
Feng B , YangRF, XieQ, ShangJ, KongFY, ZhangHY, et al. Hepatitis C virus core antigen, an earlier and stronger predictor on sustained virological response in patients with genotype 1 HCV infection. BMC Gastroenterol. 2014;14:47. [PMC free article: PMC3995626] [PubMed: 24625322]
66.
Loggi E , CursaroC, ScuteriA, GrandiniE, PannoAM, GalliS, et al. Patterns of HCV-RNA and HCV core antigen in the early monitoring of standard treatment for chronic hepatitis C. J Clin Virol. 2013;56(3):207–11. [PubMed: 23245628]
67.
Moscato GA , GiannelliG, GrandiB, PieriD, MarsiO, GuarducciI, et al. Quantitative determination of hepatitis C core antigen in therapy monitoring for chronic hepatitis C. Intervirology. 2011;54(2):61–5. [PubMed: 20829601]
68.
Fujino T , NakamutaM, AoyagiY, FukuizumiK, TakemotoR, YoshimotoT, et al. Early decline of the HCV core antigen can predict SVR in patients with HCV treated by Pegylated interferon plus ribavirin combination therapy. J Dig Dis. 2009;10(1):21–5. [PubMed: 19236543]
69.
Takahashi M , SaitoH, HigashimotoM, AtsukawaK, IshiiH. Benefit of hepatitis C virus core antigen assay in prediction of therapeutic response to interferon and ribavirin combination therapy. J Clin Microbiol. 2005;43(1):186–91. [PMC free article: PMC540104] [PubMed: 15634970]
70.
Fytili P , TiemannC, WangC, SchulzS, SchafferS, MannsMP, et al. Frequency of very low HCV viremia detected by a highly sensitive HCV-RNA assay. J Clin Virol. 2007;39(4):308–11. [PubMed: 17625963]

Tables

Table 1aCharacteristics of included studies for PICO 5a grouped alphabetically by index test type

Author, yearCountry and income categoryStudy designStudy populati onAge groupNumber of subjectsProportion with HIV infectionProportion with HBV infectionProportion femaleSample typeSample condition
Abbott ARCHITECT HCV Ag
Buket, 2014Kazakhstan (B)CohortBroadAdults115UnknownUnknown56.5%SerumUnknown
Chevaliez, 2014France (A)Cross-sectionalBroadAdults514UnknownUnknown36.6%SerumUnknown
Descamps, 2012France (A)Cross-sectionalBroadAdults22UnknownUnknown40.1%SerumFrozen
Durante-Mangoni, 2013Italy (A)CohortBroadAdults1140 %0%43%SerumFrozen
Duy Thong, 2015Thailand (B)CohortBroadAdults18944.9%0%28.6%SerumFrozen
Ergünay, 2011Turkey (A)CohortBroadMixed272UnknownUnknownUnknownSerumFrozen
Florea, 2014Romania (B)Cross-sectionalBroadAdults760%0%75%SerumFrozen
Garbuglia, 2014Italy (A)CohortBroadAdults292100%3.8%25.9%SerumFrozen
Gu, 2014China (B)Cross-sectionalBroadUnknown304UnknownUnknownUnknownWholeUnknown
Hadziyannis, 2013Greece (A)Cross-sectionalBroadUnknown105UnknownUnknownUnknownSerumFrozen
Heidrich, 2014Germany (A)CohortBroadAdults596UnknownUnknown43%SerumUnknown
Kadkhoda, 2014Canada (A)Cross-sectionalBroadUnknown154UnknownUnknownUnknownSerumUnknown
Kesli, 2011Turkey (A)CohortHealthyAdults212UnknownUnknown57.5%SerumUnknown
Köroglu, 2012Turkey (A)CohortBroadUnknown32UnknownUnknown45.5%SerumUnknown
Kuo, 2012Taiwan (A)CohortBroadAdults405UnknownUnknown52.6%SerumUnknown
Li Cavoli, 2012Italy (A)CohortBroadAdults921.1%2.2%41.3%SerumUnknown
Mederacke. 2009Germany (A)CohortBroadUnknown1180%0%UnknownSerumUnknown
Mederacke, 2012Germany (A)Cross-sectionalBroadUnknown23749.50%50.50%UnknownSerumUnknown
Medici, 2011Italy, Spain (A)Cross-sectionalBroadUnknown1480UnknownUnknown52.6%SerumFrozen
Miedouge, 2010France (A)CohortBroadUnknown2850UnknownUnknownUnknownSerumFrozen
Murayama, 2012Japan (A)Cross-sectionalBroadUnknown80UnknownUnknownUnknownPlasmaFrozen
Ottiger, 2013Switzerland (A)Cross-sectionalBroadAdults976%0%38.1%PlasmaFrozen
Park, 2010South KoreaCohortBroadAdults282UnknownUnknown49.3%SerumUnknown
Reyes-Méndez, 2014Mexico (B)Cross-sectionalBroadUnknown211UnknownUnknownUnknownSerumUnknown
Rouet, 2015Gabon (B)Cross-sectionalBroadAdults54100.00%Unknown70.1%PlasmaFrozen
Russi, 2014Italy (A)CohortBroadAdults1020%0%78.4%SerumFrozen
Tedder, 2013UK (A)CohortBroadUnknown540%0%UnknownPlasmaFrozen
van Helden, 2014Germany (A)Cross-sectionalBroadUnknown35584.40%6.60%UnknownSerumUnknown
Vanhommerig. 2015Netherlands (A)CohortBroadUnknown93100.00%Unknown0%SerumUnknown
Vermehren, 2012Germany (A)CohortBroadAdults1600%0%54%SerumFrozen
Bio-RAD MonolisaTM HCV Ag-Ab ULTRA
Laperche, 2005France (A)CohortBroadUnknown35UnknownUnknownUnknownPlasmaFrozen
Nastouli, 2008UK (A)CohortBroadAdults25100%Unknown0%SerumFrozen
Schnuriger, 2006France (A)CohortBroadAdults20100%UnknownUnknownSerumFrozen
Tuke, 2008UK (A)Cross-sectionalBroadUnknownUnknownUnknownUnknownUnknownPlasmaFrozen
Vermeersch, 2010Belgium (A)Cross-sectionalBroadUnknown337UnknownUnknownUnknownSerumUnknown
EIKEN Lumispot HCV Ag
Saito, 2003Japan (A)Cross-sectionalBroadUnknown155UnknownUnknownUnknownSerumFrozen
Murayama, 2012Japan (A)Cross-sectionalBroadUnknown80UnknownUnknownUnknownPlasmaFrozen
Fujirebio Lumipulse Ortho HCV Ag
Murayama, 2012Japan (A)Cross-sectionalBroadUnknown80UnknownUnknownUnknownPlasmaFrozen
Hunan Jynda Bioengineering Group HCV Core Ag ELISA
Lu, 2007China (B)CohortBroadUnknown191UnknownUnknownUnknownSerumUnknown
Ouyang, 2006China (B)Cross-sectionalBroadUnknown149UnknownUnknownUnknownSerumUnknown
Zhang, 2007China (B)CohortHealthyUnknown11UnknownUnknownUnknownSerumFrozen
Zhu, 2010China (B)Cross-sectionalBroadMixed173UnknownUnknownUnknownSerumUnknown
DiaSorin S.A. Murex Ag/Ab EIA
Alzahrani, 2008Saudi Arabia (A)CohortBroadAdults1180.7%6.1%100%SerumUnknown
El-Emshaty, 2011Egypt (B)CohortBroadAdults39UnknownUnknown69.2%SerumFrozen
Tuke, 2008UK (A)Cross-sectionalBroadUnknownunknownUnknownUnknownUnknownPlasmaFrozen
Yang, 2011Taiwan (A)CohortBroadAdults20125%0%39%SerumFrozen
Ortho ELISA-Ag
Agha, 2004Egypt, Japan, Uzbekistan (AB)CohortBroad
Unknown
246
Unknown

Unknown

Unknown
SerumUnknown
El-Sayed, 2004Egypt (B)Cross-sectionalBroadUnknown50UnknownUnknownUnknownSerumFrozen
Letowska, 2004Poland (A)CohortHealthyUnknown124UnknownUnknownUnknownSerumUnknown
Nübling, 2002USA (A)CohortBroadUnknown52UnknownUnknownUnknownPlasmaFrozen
Ohta, 2004Japan (A)Cross-sectionalBroadUnknown225UnknownUnknownUnknownSerumUnknown
Okazaki, 2008Japan (A)CohortBroadUnknown300UnknownUnknown50.3%SerumUnknown

HCV: hepatitis C virus, HIV: human immunodeficiency virus, HBV: hepatitis B virus, Ag: antigen, Ab: antibody, ELISA: enzyme-linked immunosorbent assay, EIA: enzyme immunoassay, UK: United Kingdom, USA: United States of America, A: high-income countries, B: middle-income countries, C: low-income countries by World Bank List of Economies (July 2015)

Table 1bCharacteristics of included studies for PICO 9 grouped alphabetically by index test type

Author, yearCountry and income categoryStudy designStudy populationAge groupNumber of subjectsProportion with HIV infectionProportion with HBV infectionProportion femaleSample typeSample condition
Abbott ARCHITECT HCV Ag
Feng, 2014China (B)RCTBroadAdults320%0%50%SerumUnknown
Loggi, 2013Italy (A)CohortBroadAdults350%0%34.4%SerumFrozen
Moscato, 2010Italy (A)CohortBroadUnknown23UnknownUnknownUnknownSerumFrozen
Fujirebio Lumipulse Ortho HCV Ag
Fujino, 2009Japan (A)CohortBroadAdults90UnknownUnknown24%SerumUnknown
Takahashi, 2005Japan (A)CohortBroadAdults44Unknown0%31.8%SerumUnknown

HCV: hepatitis C virus, HIV: human immunodeficiency virus, HBV: hepatitis B virus, Ag: antigen, Ab: antibody, RCT: randomized controlled trial, A: high-income countries, B: middle-income countries, C: low-income countries by World Bank List of Economies (July 2015)

Table 2Diagnostic accuracy by HCVcAg index test type for diagnosis of active HCV infection compared to nucleic acid testing as the reference standard. Results from bivariate, univariate, range of studies, and single studies are all reported

Index TestHCV Ab status# Studies (# samples)Sensitivity 95% CISpecificity 95% CIPositive LR 95% CINegative LR 95% CIτ2 [Covariance]
Abbott ARCHITECT1All20 (11,820)93.4%1
(88.7, 96.2)
98.7%1
(96.9, 99.4)
71.8
(28.6, 160.3)
0.07
(0.04, 0.12)
Sens: 1.5 (SE 0.6)
Spec: 2.3 (SE 1.0); [0.03]
Abbott ARCHITECT2All30 (12,788)94.1%2
(92.4, 95.7)
NDNANASens: 14.1
Abbott ARCHITECT1Known Ab positive16 (5,246)92.5%1
(86.9, 95.8)
97.8%1
(94.7, 99.1)
42
(16.4, 106.4)
0.05
(0.03, 0.08)
Sens: 1.4 (SE 0.5)
Spec: 1.7 (SE 1.0); [0.02]
Abbott ARCHITECT2Known Ab positive26 (6,214)93.3%2
(91.2, 95.3)
NDNA*NA*Sens: 19.4
Abbott ARCHITECT1Known Ab negative4 (3,458)74.4%1
(6.2, 99.2)
98.8%1
(97.2, 99.5)
62
(2, 198.5)
0.25
(0.003, 0.94)
Sens: 8.4 (SE 16.6)
Spec: 0.2 (SE 0.6)
Ortho ELISA-Ag1All5 (1,177)93.2%1
(81.6, 97.7)
99.2%1
(87.9, 100)
116.5
(6.7, 977)
0.06
(0.02, 0.07)
Sens: 1.4 (SE 1.0)
Spec: 3.8 (SE 5.1); [–0.4]
Ortho ELISA-Ag2All6 (1,423)90.8%2
(83.5, 98.2)
NDNANA122.0
Bio-RAD MonolisaTM HCV Ag-Ab ULTRA*All5 (525)28.6–95%*94.9%**
(89.9, 99.8)
NANANA
EIKEN Lumispot HCV AgAll2 (235)97.5–98.1%*NDNANANA
Fujirebio Lumipulse Ortho HCV Ag3All1 (80)95%**
(90.2, 99.8)
NDNANANA
Hunan Jynda Bioengineering Group HCV Core Ag ELISA1All4 (524)59.5%1
(46, 71.7)
82.9%1
(58.6, 94.3)
3.5
(1.1, 12.6)
0.28
(0.2, 0.3)
NA+
Murex Ag/Ab EIAAll4 (770)50–100%*83.8–100%*NANANA

HCV: hepatitis C virus, cAg: core antigen, Ab: antibody, CI: confidence interval, LR: likelihood ratio, ELISA: enzyme linked immunosorbent assay, EIA: enzyme immunoassay, τ2: Tau squared, SE: standard error.

1

Determined by bivariate meta-analysis – “metandi” command in STATA,

2

Determined by univariate meta-analysis – “metan” command in STATA,

*

Meta-analysis not possible, range of results seen across studies reported,

**

results from one study only,

ND: no data, NA: not applicable – if sensitivity and specificity results were not available from meta-analysis, likelihood ratios were not calculated;

+

output of τ2 not interpretable given small number of studies

Table 3aAvailable genotype information for studies included in PICO 5a grouped alphabetically by index test type

Author, yearNumber of subjects% G1% G1a% G1b%G2%G3%G4%G5%G6% Other or unknown
Abbott ARCHITECT HCV Ag
Chevaliez, 201451459.3%5%12.3%19.2%1%1.9%1.9%
Descamps, 20122268.2%31.8%
Durante-Mangoni, 201311449%31%20%
Duy Thong, 201518935.4%0%44.9%19.6%
Ergünay, 20112720.8%2.2%60.2%0.4%0.4%35.8%
Garbuglia, 201429217.1%14.5%9.4%1%27.6%15.4%15%
Hadziyannis, 201310536%6%37%21%
Kesli, 2011212100%
Li Cavoli, 20129295%5%
Mederacke. 200911845.8%10%19%24.6%
Miedouge, 201028502%8.2%17.3%15.3%17.3%11.2%8.2%3.1%17.3%
Ottiger, 20139730.9%19.5%10.3%23.7%15.5%30.9%
Russi, 201410250%48.1%1.9%
Tedder, 20135440.7%22.2%20.4%16.7%
Vermehren, 201216019%29%51%
Bio-RAD MonolisaTM HCV Ag-Ab ULTRA
Laperche, 2005355.7%11.4%34.3%25.7%14.3%5.7%2.9%
Nastouli, 20082568%4%4%16%8%
Schnuriger, 20062020%15%5%30%45%
Tuke, 2008*Unknown62%23%15%
EIKEN Lumispot HCV Ag
Saito, 200315565.2%35.80%
Ortho ELISA-Ag
Agha, 200424637%9.8%5.8%47.3%
Nübling, 20025211.5%42.3%19.2%11.5%15.4%

HCV: hepatitis C virus, Ag: antigen, Ab: Antibody, ELISA: enzyme linked immunosorbent assay, G1: genotype 1, G1a: genotype 1a, G1b: genotype 1b, G2: genotype 2, G3: genotype 3, G4: genotype 4, G5: genotype 5, G6: genotype 6

*

Data are the same for DiaSorin S.A. Murex Ag/Ab EIA

Table 3bGenotype information for studies included in PICO 9 grouped alphabetically

Author, yearNumber of subjects% G1% G1a% G1b%G2%G3%G4%G5%G6% Other or unknown
Abbott ARCHITECT HCV Ag
Feng, 201432100%
Loggi, 201335100%20%80%
Moscato, 2010234%39.1%26.1%21.7%8.7%
Fujirebio Lumipulse Ortho HCV Ag
Fujino, 20099066.7%33.3%
Takahashi, 200544100%

HCV: hepatitis C virus, Ag: antigen, Ab: antibody, G1 = genotype 1, G1a = genotype 1a, G1b = genotype 1b, G2 = genotype 2, G3 = genotype 3, G4 = genotype 4, G5 = genotype 5, G6 = genotype 6

Table 4Sensitivity and specificity of Abbott ARCHITECT HCV Ag assay compared to nucleic acid testing (NAT) assessed at baseline, at week 4 of interferon based therapy (early viral response), and at week 24 after completion of treatment (sustained viral response)

BaselineEarly viral response (EVR)Sustained viral response (SVR)
Author, YearNumber of subjectsSe (95% CI)Sp (95% CI)Se (95% CI)Sp (95% CI)Se (95% CI)Sp (95% CI)
Feng, 201432100%NA100%88.9%
(68.4%, 100%)
100%100%
Loggi, 201335100%NA73.5%
(58.7%, 88.4%)
100%100%94.1%
(82.9%, 100%)
Moscato, 201023NANA
100%
70%
(41.6%, 98.4%)

NA

NA

HCV: hepatitis C virus, Ag: antigen, Se: sensitivity, Sp: specificity, CI: confidence interval, NA: not applicable as cannot be calculated from study data

Table 5Sensitivity and specificity of HCV core antigen assay in prediction of sustained viral response (SVR) after initiation of interferon-based treatment

Author, YearNo. of subjects (no.to achieve SVR)Index testTiming of test after treatment startChange in HCVcAgSensitivitySpecificity
Feng, 201432 (21)Abbott ARCHITECT6 daysLog 1095.2%70%
Fujino, 200990 (57)Fujirebio Lumipulse7 daysAbsolute79.4%88.5%
Takahashi, 200544 (10)Fujirebio Lumipulse7 daysAbsolute57.1%93.3%

HCV: hepatitis C virus, No.: number

Figures

Fig. 1a. PRISMA diagram of studies excluded from screen one, and those full papers retrieved for more detailed evaluation.

Fig. 1aPRISMA diagram of studies excluded from screen one, and those full papers retrieved for more detailed evaluation

Fig. 1b. PRISMA diagram of studies included in the review for PICO 5a.

Fig. 1bPRISMA diagram of studies included in the review for PICO 5a

Fig. 1c. PRISMA diagram of studies included in the review for PICO 5b.

Fig. 1cPRISMA diagram of studies included in the review for PICO 5b

Fig. 1d. PRISMA diagram of studies included in the review for PICO 9.

Fig. 1dPRISMA diagram of studies included in the review for PICO 9

QUADAS figures

Fig. 2a. Risk of bias and applicability summary as judged by review authors about each QUADAS-2 domain presented as percentages across the 50 included studies for PICO 5a.

Fig. 2aRisk of bias and applicability summary as judged by review authors about each QUADAS-2 domain presented as percentages across the 50 included studies for PICO 5a

Fig. 2b. Risk of bias and applicability summary as judged by review authors about each QUADAS-2 domain presented as percentages across the 5 included studies for PICO 9.

Fig. 2bRisk of bias and applicability summary as judged by review authors about each QUADAS-2 domain presented as percentages across the 5 included studies for PICO 9

Fig. 3a. Risk of bias and applicability summary as judged by review authors about each QUADAS-2 domain presented by individual study for PICO 5a (PDF, 1.2M)

Fig. 3b. Risk of bias and applicability summary as judged by review authors about each QUADAS-2 domain presented by individual study for PICO.

Fig. 3bRisk of bias and applicability summary as judged by review authors about each QUADAS-2 domain presented by individual study for PICO

Fig. 4a. Forest plot of Abbott ARCHITECT HCV Ag assay sensitivity and specificity for the diagnosis of active HCV infection compared to NAT reference test for all samples regardless of HCV Ab status.

Fig. 4aForest plot of Abbott ARCHITECT HCV Ag assay sensitivity and specificity for the diagnosis of active HCV infection compared to NAT reference test for all samples regardless of HCV Ab status

HCV: hepatitis C virus, Ag: antigen, NAT: nucleic acid testing, Ab: antibody, TP: true positive, FP: false positive, FN: false negative, TN: true negative, CI: confidence interval

Fig. 4b. Univariate analysis of Abbott ARCHITECT HCV Ag Assay sensitivity for the diagnosis of active HCV infection compared to NAT reference test for all studies with sensitivity data regardless of HCV Ab status.

Fig. 4bUnivariate analysis of Abbott ARCHITECT HCV Ag Assay sensitivity for the diagnosis of active HCV infection compared to NAT reference test for all studies with sensitivity data regardless of HCV Ab status

HCV: hepatitis C virus, Ag: antigen, NAT: nucleic acid testing, Ab: Antibody, TP: true positive, FP: false positive, FN: false negative, TN: true negative, CI: confidence interval

Fig. 4c. Forest plot of Abbott ARCHITECT HCV Ag assay sensitivity and specificity for the diagnosis of active HCV infection compared to NAT reference test for known HCV antibody-positive samples.

Fig. 4cForest plot of Abbott ARCHITECT HCV Ag assay sensitivity and specificity for the diagnosis of active HCV infection compared to NAT reference test for known HCV antibody-positive samples

HCV: hepatitis C virus, Ag: antigen, NAT: nucleic acid testing, Ab: antibody, TP: true positive, FP: false positive, FN: false negative, TN: true negative, CI: confidence interval

Fig. 4d. Forest plot of Abbott ARCHITECT HCV Ag assay sensitivity and specificity for the diagnosis of active HCV infection compared to NAT reference test for known HCV antibody-negative samples.

Fig. 4dForest plot of Abbott ARCHITECT HCV Ag assay sensitivity and specificity for the diagnosis of active HCV infection compared to NAT reference test for known HCV antibody-negative samples

HCV: hepatitis C virus, Ag: antigen, NAT: nucleic acid testing, Ab: antibody, TP: true positive, FP: false positive, FN: false negative, TN: true negative, CI: confidence Interval

Fig. 5. Bivariate analysis of Abbot ARCHITECT HCV antigen assay sensitivity and specificity for diagnosis of active HCV infection compared to gold standard nucleic acid testing in (a) all samples regardless of HCV antibody (Ab) status, (b) HCV Ab-positive samples (c) HCV Ab-negative samples. These plots show pooled summary estimates (red squares), the dashed red line represents the 95% confidence region and the dashed green line represents the 95% prediction region. The individual circles represent each study and the size of the circle is proportional to the total sample size.

Fig. 5Bivariate analysis of Abbot ARCHITECT HCV antigen assay sensitivity and specificity for diagnosis of active HCV infection compared to gold standard nucleic acid testing in (a) all samples regardless of HCV antibody (Ab) status, (b) HCV Ab-positive samples (c) HCV Ab-negative samples. These plots show pooled summary estimates (red squares), the dashed red line represents the 95% confidence region and the dashed green line represents the 95% prediction region. The individual circles represent each study and the size of the circle is proportional to the total sample size

Fig. 6. Forest plot Ortho ELISA-Ag sensitivity and specificity for diagnosis of active HCV infection compared to NAT reference test for all samples regardless of HCV Ab status.

Fig. 6Forest plot Ortho ELISA-Ag sensitivity and specificity for diagnosis of active HCV infection compared to NAT reference test for all samples regardless of HCV Ab status

ELISA: enzyme linked immunosorbent assay, Ag: antigen, HCV: hepatitis C virus, NAT: nucleic acid testing, Ab: antibody, TP: true positive, FP: false positive, FN: false negative, TN: true negative, CI: confidence interval

Fig. 7. Bivariate analysis of Ortho ELISA-Ag sensitivity and specificity for diagnosis of active HCV infection compared to gold standard nucleic acid testing in all samples regardless of HCV antibody status. This plot shows pooled summary estimates (red squares), the dashed red line represents the 95% confidence region and the dashed green line represents the 95% prediction region. The individual circles represent each study and the size of the circle is proportional to the total sample size.

Fig. 7Bivariate analysis of Ortho ELISA-Ag sensitivity and specificity for diagnosis of active HCV infection compared to gold standard nucleic acid testing in all samples regardless of HCV antibody status. This plot shows pooled summary estimates (red squares), the dashed red line represents the 95% confidence region and the dashed green line represents the 95% prediction region. The individual circles represent each study and the size of the circle is proportional to the total sample size

Fig. 8. Forest plot of Bio-RAD MonolisaTM HCV Ag-Ab ULTRA sensitivity for diagnosis of active HCV infection compared to NAT reference test for all samples regardless of HCV Ab status.

Fig. 8Forest plot of Bio-RAD MonolisaTM HCV Ag-Ab ULTRA sensitivity for diagnosis of active HCV infection compared to NAT reference test for all samples regardless of HCV Ab status

HCV: hepatitis C virus, Ag: antigen, Ab: antibody, NAT: nucleic acid testing, TP: true positive, FP: false positive, FN: false negative, TN: true negative

Fig. 9. Forest plots of Hunan Jynda HCV Core Ag ELISA sensitivity and specificity for diagnosis of active HCV infection compared to NAT reference test for all samples regardless of HCV Ab status.

Fig. 9Forest plots of Hunan Jynda HCV Core Ag ELISA sensitivity and specificity for diagnosis of active HCV infection compared to NAT reference test for all samples regardless of HCV Ab status

HCV: hepatitis C virus, ELISA: enzyme linked immunosorbent assay, Ag: antigen, NAT: nucleic acid testing, Ab: Antibody, TP: true positive, FP: false positive, FN: false negative, TN: true negative, CI: confidence interval

Fig. 10. Bivariate analysis of Hunan Jynda Bioengineering Group HCV Core Ag ELISA sensitivity and specificity for diagnosis of active HCV infection compared to gold standard nucleic acid testing for all samples regardless of HCV antibody status. This plot shows pooled summary estimates (red squares), the dashed red line represents the 95% confidence region and the dashed green line represents the 95% prediction region. The individual circles represent each study and the size of the circle is proportional to the total sample size.

Fig. 10Bivariate analysis of Hunan Jynda Bioengineering Group HCV Core Ag ELISA sensitivity and specificity for diagnosis of active HCV infection compared to gold standard nucleic acid testing for all samples regardless of HCV antibody status. This plot shows pooled summary estimates (red squares), the dashed red line represents the 95% confidence region and the dashed green line represents the 95% prediction region. The individual circles represent each study and the size of the circle is proportional to the total sample size

Fig. 11. Forest plot of DiaSorin S.A. Murex Ag/Ab EIA sensitivity for diagnosis of active HCV infection compared to NAT reference test for all samples regardless of HCV Ab status.

Fig. 11Forest plot of DiaSorin S.A. Murex Ag/Ab EIA sensitivity for diagnosis of active HCV infection compared to NAT reference test for all samples regardless of HCV Ab status

Ag: antigen, Ab: antibody, EIA: enzyme immunoassay, HCV: hepatitis C infection, NAT: nucleic acid testing, TP: true positive, FP: false positive, FN: false negative, TN: true negative

Fig. 12. Non-parametric regression smoother of pooled quantitative data assessing correlation between Abbott ARCHITECT HCV core Ag measured in log fmol/L and HCV RNA measured in log IU/mL. The red line indicates the positivity threshold of the core antigen index test corresponding to 3 fmol/L.

Fig. 12Non-parametric regression smoother of pooled quantitative data assessing correlation between Abbott ARCHITECT HCV core Ag measured in log fmol/L and HCV RNA measured in log IU/mL. The red line indicates the positivity threshold of the core antigen index test corresponding to 3 fmol/L

HCV = hepatitis C virus, Ag = antigen, RNA = ribonucleic acid

Appendices

Appendix A. Search report for systematic review on HCV Antigen use for diagnostics as well as treatment monitoring

Date of search = March 2015. The following tables shows the sources that have been searched and the hits retrieved from those searches

SourceDate range searchedHits retrieved (before duplicate removal)
Electronic databases
Medline (PubMed)All available2820
CochraneAll available127
EmbaseAll available5501
Web of ScienceAll available2635
ScopusAll available3549
Final number of records in EndNote database after deleting duplicates 8146
Search strategy Embase
  1. ‘hepatitis c antigen’/exp OR ‘hepatitis c antigen’ OR ‘hepatitis c’/exp OR ‘hepatitis c virus’/exp OR ‘hepatitis c virus’
  2. ‘hepatitis c antigen’ OR ‘hepatitis C’ OR hepatitis c virus’ or ‘hcv’
  3. #1 OR #2
  4. ‘antigen’/exp OR ‘antigen’ OR ‘virus antigen’/exp OR ‘virus antigen’
  5. ‘antigen’ OR ‘virus antigen’
  6. #4 OR #5
  7. ‘nucleic acid amplification’/exp OR ‘nucleic acid amplification’ OR ‘virus rna’/exp OR ‘virus rna’ OR ‘rna’/exp OR ‘rna’
  8. ‘nucleic acid amplification’ OR ‘virus rna’ OR ‘rna’ OR ‘nucleic acid test’
  9. #7 OR #8
  10. #3 AND #6 AND #9

‘hepatitis c antigen’/exp OR ‘hepatitis c’/exp OR ‘hepatitis c virus’/exp OR ‘hepatitis c antigen’ OR ‘hepatitis c’ OR ‘hepatitis c virus’ OR ‘hcv’ AND (‘antigen’/exp OR ‘virus antigen’/exp OR ‘antigen’ OR ‘virus antigen’) AND (‘nucleic acid amplification’/exp OR ‘virus rna’/exp OR ‘rna’/exp OR ‘nucleic acid amplification’ OR ‘virus rna’ OR ‘rna’ OR ‘nucleic acid test’

Search strategy Web of Knowledge (SCI-expanded, SSCI, Conference Proceedings science, BIOSIS previews)
  1. Hepatitis C OR HCV (topic)
  2. Antigen* OR core antigen* (topic)
  3. RNA OR NAT or nucleic acid test* (topic)
  4. #1 AND #2 AND #3
Search strategy PubMed

((hepatitis C[MeSH Terms] OR “Hepacivirus”[Mesh] OR “HCV” OR “hepatitis C”) AND (antigen* OR antigens, viral/blood[MeSH Terms] OR hepatitis c antigens[MeSH Terms]) AND (“Nucleic Acid Amplification Techniques”[Mesh] OR nucleic acid test*[tw] OR nucleic acid amplification[tw] OR RNA OR RNA, viral/blood[MeSH Terms]))

Search strategy SCOPUS

(TITLE-ABS-KEY (“Hepatitis C” OR hcv)AND TITLE-ABS-KEY (antigen* OR “core antigen*”)AND TITLE-ABS-KEY (rna OR “nucleic acid test”))AND(LIMIT-TO (DOCTYPE, “ar”)OR LIMIT-TO (DOCTYPE, “ip”))

Search strategy Cochrane
  1. MeSH descriptor: Hepatitis C
  2. MeSH Descriptor: Hepacivirus
  3. MeSH Descriptor: Hepatitis C Antigens
  4. Hepatitis C
  5. HCV
  6. #1 or #2 or #3 or #4 or #5
  7. MeSH Descriptor: Nucleic Acid Amplification Techniques
  8. RNA
  9. Nucleic acid test
  10. #7 or #8 or #9
  11. Antigen
  12. “Core antigen”
  13. #11 or #12
  14. #6 AND #10 AND #13

Appendix B. Data extraction form

ID
First Author
Corresponding author and email
Was author contacted?1 – Yes
2 – No
If yes, dates(s)
Title
Year (of publication)
Year (study start date)
Language1 – English
2 – Other
If other, specify:
HCV Genotypes specified1 – n, % Genotype 1 __
Genotype 1a __
Genotype 1b __
2 – n, % Genotype 2 __
3 – n, % Genotype 3 __
4 – n, % Genotype 4 __
5 – n, % Genotype 5 __
6 – n, % Genotype 6 __
% HIV positive
% HBsAg + (chronic HBV infection)
% Adults/children
Age (mean SD, median IQR, range)
Gender, % Female
Country where study was conducted
Country World Bank Classification (at time of study start date)1 – Middle/Low
2 – High
3 – Both middle/low and high
Study design1 – Randomized trial
2 – Cross-sectional
3 – Cohort
4 – Case Control
5 – Other, specify
9 – Unk/NR
If other, specify:
Participant selection1 – Consecutive
2 – Random
3 – Convenience
4 – Other
9 –Unk/NR
Study population1 – Broad
2 – Healthy persons only
3 – Unk/NR
Comments: ____________________________________________
Direction of study data collection1 – Prospective
2 – Retrospective
9 – Unk/NR
Comments about study design
Were samples excluded based on prior testing of the sample?1 – yes (specify below)
2 – no
9 – Unk/NR
Comments: __________________________________________
Number after screening by exclusion and inclusion criteria_____
9 – Unk/NR
Sample size (total number included in 2/2 table)_____
9 – Unk/NR
Unit of analysis1 – One specimen per patient
2 – Multiple specimens per patient
3 – Unknown number of specimens per patient
9 – NR/Unclear
Describe as in paper, if unclear:
Types of specimen and number1 – Serum ___
2 – Plasma ___
3 – Whole blood____
HCV NAT method used1 – PCR
2 – bDNA
3 – TMA
9 – Unk/NR
HCV NAT method quantitative?1 – Yes
2 – No
9 – Unk/NR
HCV Ag test manufacturer1 – Abbott ARCHITECT
2 – Bio-RAD Mono Lisa
3 – Other: please specify
9 – Unk/NR
HCV Ag method quantitative?1 – Yes
2 – No
9 – Unk/NR
Were reference NAT test and HCV Ag test performed on specimen within 30 days1 – Yes
2 – No
3 – Unk/NR
Was Ag test obtained/repeated while subject was on treatment for HCV infection or after treatment completed?1 – yes (Specify below)
2 – No
Specify timing of Ag Collection
1 – Baseline, prior to treatment
2 – EVR
3 – SVR 12 weeks
4 – SVR 24 weeks
What treatment regimen was used?
1 – Interferon based therapy
2 – Interferon free direct acting antivirals
3- Unk/NR
Did all patients NAT within the study?1 – yes
2 – no
9 – Unk/NR
Comments: __________________________________________
Was index test performed per recommendation of the manufacturer?1 – Yes
2 – No
9 – Unk/NR
Comments: ___________________________________________

Appendix C. QUADAS-2 protocol

Domain 1. Patient selection

Risk of bias: could the selection of patients have introduced bias?

  • Signalling question 1: Was a consecutive or random sample of patients or specimens enrolled? Score “yes” if the study enrolled a consecutive or random sample of eligible patients; “no” if the study selected patients by convenience, and “unclear” if the study did not report the manner of patient selection or unable to tell.
  • Signalling question 2: Was a case–control design avoided? Rate “no” if case–control study, “yes” if prospective or cross-sectional study.
  • Signalling question 3: Did the study avoid inappropriate exclusions? Score “no” if the study excluded samples based on prior testing of the sample and “unclear” if unable to tell.

Risk of Bias is scored as “low risk” if selection was done in a random or consecutive manner and the study was prospective and did not exclude samples based on prior testing; “high risk” if selection was by convenience, from case-control study or excluded samples; and “unclear risk” if the manner of participant selection is unclear and no clinical information is provided.

Applicability: Are there concerns that the included patients and setting do not match the review question?

We are interested in how HCV AG test performs across HCV genotypes and among HIV-infected (immunocompromised) persons. If a study includes only very selected persons, only healthy or blood donors, it would not be relevant to the study question. Setting of testing is not relevant to the review question. We will score “low risk” if broad study population, “high risk” if population is blood donors or healthy persons only, and “unclear risk” if the population is not well characterized.

Domain 2. Index test

Risk of bias: could the conduct or interpretation of the index test have introduced bias?

  • Signalling question 1: Were the index test results interpreted without knowledge of the results of the reference standard? Rate “yes” if results of reference standard were blinded. Rate “no” if reference standard results were unblinded.
  • Signalling question 2: If a threshold was used, was it pre-specified? Answer “yes” for all studies as limit of detection for all commercially available HCV Ag tests are pre-specified.

Score “low risk” for all tests interpreted with blinded results of reference standard. Score “high risk” for antigen tests interpreted with results from reference standard available. Score “unclear risk” if availability of reference test is not specified.

Applicability: Are there concerns that the index test, its conduct, or its interpretation differ from the review question? Variations in test technology, execution, or interpretation may affect estimates of the diagnostic accuracy of a test.

  • Score “low concern” if the test was done as per recommendation of the manufacturer. Score “high concern” if additional processing steps were added. Score “unclear” if not discussed in the study.
Domain 3. Reference standard

Risk of bias: could the reference standard, its conduct, or its interpretation have introduced bias?

  • Signalling question 1: Is the reference standard likely to correctly classify the target condition?
    There are multiple methods of NAT, each with slightly varying sensitivity, however overall the tests are highly sensitive and the verification should be minimal. We will score “yes” for all studies
    Signalling question 2: Were the reference standard results interpreted without knowledge of the results of the index test?
    The reference standard in this case also does not allow for interpretation. Therefore it is unlikely to introduce bias even if reference standard was resulted with knowledge of the index test result.

For risk of bias, score “low risk” for all studies.

Applicability: Are there concerns that the target condition as defined by the reference standard does not match the question?

Judge applicability to be of “low risk” for all studies as circulating virus is by definition associated with active infection and the specificity of the reference standard is high. While the reference standard is not able to differentiate between acute or chronic infection, the core antigen is also not expected to do so. The differentiation will be done based on the constellation of NAT results with serology results. This will be assessed in a stratified analysis.

Domain 4. Flow and timing

Risk of bias: Could the patient flow have introduced bias?

  • Signalling question 1: Was there an appropriate interval between the index test and reference standard? We will limit time between reference and index testing to <1 month. Score “yes” if time between tests is <1 month, score “no” if time between tests is more than 1 month.
  • Signalling question 2: Did all patients in the study receive the same reference standard? Answer “yes” if all patients had NAT, answer “no” if reference standard NAT was not used for all patients, answer “unclear” if it is not specified.
  • Signalling question 3: Were all patients included in the analysis? Determined the answer to this question by comparing the number of patients enrolled with the number of patients included in the two-by-two tables.

For risk of bias, score “low risk” if the number of participants enrolled was clearly stated and corresponded to the number presented in the analysis or if exclusions were adequately described. Score “high risk” if there were participants missing or excluded from the analysis and there was no explanation given; and “unclear risk” if not enough information was given to assess whether participants were excluded from the analysis; usually this means that the number of participants originally enrolled in the study was not explicitly stated.

Appendix D. List of excluded studies and reasons for exclusion organized by PICO

PICO 5a
1.
Alados-Arboledas JC , Calbo-TorrecillasL, Lopez-PrietoMD, de Francisco-RamirezJL, de Miguel-SastreC. Clinical assessment of Monolisa HCV ag-ab ULTRA (Bio-Rad) in a general hospital. Enferm Infecc Microbiol Clin. 2007;25(3):172–6. Inappropriate reference test [PubMed: 17335695]
2.
Allain JP , CoghlanPJ, KenrickKG, WhitsonK, KellerA, CooperGJ, et al. Prediction of hepatitis C virus infectivity in seropositive Australian blood donors by supplemental immunoassays and detection of viral RNA. Blood. 1991;78(9):2462–8. No HCV core antigen performed [PubMed: 1657250]
3.
Alzahrani AJ . Analysis of hepatitis C virus core antigenemia in Saudi drug users. Saudi Med J. 2005;26(10):1645–6. Editorial or comment [PubMed: 16228075]
4.
Alzahrani AJ , ObeidOE, Al-AliA, ImamwardiB. Detection of hepatitis C virus and human immunodeficiency virus in expatriates in Saudi Arabia by antigen-antibody combination assays. J Infect Dev Ctries. 2009;3(3):235–8. Less than 10 independent samples [PubMed: 19759481]
5.
Aoyagi K , IidaK, OhueC, MatsunagaY, TanakaE, KiyosawaK, et al. Performance of a conventional enzyme immunoassay for hepatitis C virus core antigen in the early phases of hepatitis C infection. Clin Lab. 2001;47(3–4):119–27. Non-commercial or off-market assay [PubMed: 11294574]
6.
Aoyagi K , OhueC, IidaK, KimuraT, TanakaE, KiyosawaK, et al. Development of a simple and highly sensitive enzyme immunoassay for hepatitis C virus core antigen. J Clin Microbiol. 1999;37(6):1802–8. Non-commercial or off-market assay [PMC free article: PMC84955] [PubMed: 10325327]
7.
Araujo AC , AstrakhantsevaIV, FieldsHA, KamiliS. Distinguishing acute from chronic hepatitis C virus (HCV) infection based on antibody reactivities to specific HCV structural and nonstructural proteins. J Clin Microbiol. 2011;49(1):54–7. No HCV core antigen performed [PMC free article: PMC3020409] [PubMed: 21084519]
8.
Arrojo IP , ParejaMO, OrtaMDR, LuqueFN, LamasMCH, GordoFS, et al. Detection of a healthy carrier of HCV with no evidence of antibodies for over four years. Transfusion. 2003;43(7):953–7. Less than 10 independent samples [PubMed: 12823756]
9.
Attallah AM , IsmailH, TabllAA, ShibaGE, El-DosokyI. A novel antigen detection immunoassay for field diagnosis of hepatitis C virus infection. J Immunoassay Immunochem. 2003;24(4):395–407. Non-commercial or off-market assay [PubMed: 14677657]
10.
Attallah AM , OmranMM, NasifWA, GhalyMF, El-ShanshouryAERR, AbdallaMS, et al. Diagnostic performances of hepatitis C virus-NS4 antigen in patients with different liver pathologies. Arch Med Res. 2012;43(7):555–62. Non-commercial or off-market assay [PubMed: 23085447]
11.
Attallah AM , ShihaGE, MalakCAA, HagrasHE, Abdel-RazikWS, IsmailH. Utility of a novel HCVNS4 antigen detection immunoassay for monitoring treatment of HCV-infected individuals with pegylated interferon alpha-2a. Hepatol Res. 2004;28(2):68–72. Non-commercial or off-market assay
12.
Attia MA , ZekriAR, GoudsmitJ, BoomR, KhaledHM, MansourMT, et al. Diverse patterns of recognition of hepatitis C virus core and nonstructural antigens by antibodies present in Egyptian cancer patients and blood donors. J Clin Microbiol. 1996;34(11):2665–9. No HCV core antigen performed [PMC free article: PMC229382] [PubMed: 8897161]
13.
Baggett DW , MoroneyS, SaewertM, JaczkoB, ZelechowskiJ, BahiC, et al. Dynamics of circulating HCV core antigen and HCV RNA in the early phase of HCV infection. Transfusion. 2000;40(10):26S. Abstract or poster
14.
Ballardini G , ManzinA, GiostraF, FrancesconiR, GroffP, GrassiA, et al. Quantitative liver parameters of HCV infection: relation to HCV genotypes, viremia and response to interferon treatment. J Hepatol. 1997;26(4):779–86. Non-blood specimen [PubMed: 9126789]
15.
Baranov AV , MaleevVV. Association between HCV RNA level and anti-HCV antibodies during chronic hepatitis C. Zh Mikrobiol Epidemiol Immunobiol. 2009(5):19–22. No HCV Core antigen performed [PubMed: 20063787]
16.
Bdour S . Hepatitis C virus infection in Jordanian haemodialysis units: serological diagnosis and genotyping. J Med Microbiol. 2002;51(8):700–4. No HCV core antigen performed [PubMed: 12171303]
17.
Beer N , ShinarE, NovackL, SafiJ, SolimanH, YaariA, et al. Accuracy of hepatitis C virus core antigen testing in pools among seroconverters. Transfusion. 2006;46(10):1822–8. Noncommercial or off-market assay [PubMed: 17002640]
18.
Berger A . Recent developments in hepatitis C infection (epidemiology, diagnosis and therapy). Laboratoriums Medizin. 2001;25(7–8):218–22. Review article
19.
Berger A , DoerrHW, PreiserW, WeberB. Lack of correlation between different hepatitis C virus screening and confirmatory assays. J Virol Methods. 1996;59(1–2):141–6. No HCV core antigen performed [PubMed: 8793841]
20.
Bochkova G , FominaS, PuzyrevV, ObriadinaA, BurkovA, UlanovaT. The evaluation of the ELISA kit nullDS-EIA-anti-HCVSPECTR-GMnull as supplemental assay for confirmation of anti-HCV screening positive results. Clin Microbiol Infect. 2011;17:S664. Abstract or poster
21.
Bochkova G , FominaS, PuzyrevV, ObriadinaA, BurkovA, UlanovaT. The evaluation of the new ELISA kit “EIA-anti- HCV-SPECTRUM-M” intended for separate detection of anti-IgM to different HCV antigens. J Viral Hepat. 2012;19:5–6. Abstract or poster
22.
Bouvier-Alias M , PatelK, DahariH, BeaucourtS, LarderieP, BlattL, et al. Clinical utility of total HCV core antigen quantification: a new indirect marker of HCV replication. Hepatology. 2002;36(1):211–8. Non-commercial or off market assay [PubMed: 12085367]
23.
Bouzgarrou N , FodhaI, BenOthman S, AchourA, GrattardF, TrabelsiA, et al. Evaluation of a total core antigen assay for the diagnosis of hepatitis C virus infection in hemodialysis patients. J Med Virol. 2005;77(4):502–8. Non-commercial or off market assay [PubMed: 16254976]
24.
Brandao CPU , MarquesBLC, MarquesVA, Villela-NogueiraCA, Do OKMR, de PaulaMT, et al. Simultaneous detection of hepatitis c virus antigen and antibodies in dried blood spots. J Clin Virol. 2013;57(2):98–102. Inappropriate reference test [PubMed: 23518440]
25.
Brody RI , EngS, MelamedJ, MizrachiH, SchneiderRJ, TobiasH, et al. Immunohistochemical detection of hepatitis C antigen by monoclonal antibody TORDJI-22 compared with PCR viral detection. Am J Clin Pathol. 1998;110(1):32–7. Non-blood specimens [PubMed: 9661920]
26.
Brojer E , GronowskaA, MedyńskaJ, GrabarczykP, MikulskaM, LȩtowskaM, et al. The hepatitis C virus genotype and subtype frequency in hepatitis C virus RNA-positive, hepatitis C virus antibody-negative blood donors identified in the nucleic acid test screening program in Poland. Transfusion. 2004;44(12):1706–10. No HCV core antigen performed [PubMed: 15584984]
27.
Brojer E , LiszewskiG, NiznikA, RosiekA, LetowskaM, PetersonJE, et al. Detection of HCV core antigen in HCV RNA positive, anti-HCV negative blood donations from Polish blood donors. Transfusion. 2001;41(2):304. Editorial or comment [PubMed: 11239242]
28.
Brojer E , GronowskaA, RosiekA, MikulskaM, LetowskaM. HCV core antigen detection and quantification of viremia in the “window period” of donors identified by routine HCV RNA screening in Poland. Vox Sang. 2005;89:92. Poster or abstract
29.
Burek V . Hepatitis C viral infection – news in diagnostics. Infektoloski Glasnik. 2002;22(1):27–9. Review article
30.
Busch MP , WrightDJ, HirschkornDF, BaggettD, MaretS, LeeSR, et al. Sensitivity of 1(st) and 2(nd) generation HCV antigen assays versus nucleic acid testing (NAT) for detection of ramp-up phase of HCV infection. Transfusion. 2001;41(9):3S. Abstract or poster
31.
Cagnon L , WagamanP, BartenschlagerR, PietschmannT, GaoTJ, KnetemanNM, et al. Application of the trak-C (TM) HCV core assay for monitoring antiviral activity in HCV replication systems. J Virol Methods. 2004;118(1):23–31. Non-human subjects, non-commercial or off-market assay [PubMed: 15158065]
32.
Cano H , CandelaMJ, LozanoML, VicenteV. Application of a new enzyme-linked immunosorbent assay for detection of total hepatitis C virus core antigen in blood donors. Transfus Med.. 2003;13(5):259–66. Non-commercial or off-market assay [PubMed: 14617336]
33.
Cao H , ZhangK, ShuX, LiG. The effect of hepatitis B virus infection on detection of hepatitis C virus core antigen. Hepatol Int2012;6(1):199. Abstract or poster
34.
Cao H , ZhangK, ShuX, XuQH, LiG. Detection of core antigen of hepatitis virus C in patients infected with hepatitis virus C and B. Zhonghua Gan Zang Bing Za Zhi. 2011;19(10):726–8. Noncommercial or off-market assay [PubMed: 22409841]
35.
Cao H , ZhangK, ShuX, XuQH, LiG. Detection of hepatitis C core antigen in intravenous drug addictions. Zhonghua Shi Yan He Lin Chuang Bing Du Xue Za Zhi. 2011;25(4):304–6. Noncommercial or off-market assay [PubMed: 22097615]
36.
Carabaich A , RuvolettoM, BernardinelloE, TonoN, CavallettoL, ChemelloL, et al. Profiles of HCV core protein and viremia in chronic hepatitis C: possible protective role of core antigen in liver damage. J Med Virol. 2005;76(1):55–60. Non-commercial or off market assay [PubMed: 15778969]
37.
Carney R , MaranaoD, SudraR, ChaytorS, LabbettW, JohnsonM, et al. A hepatitis C virus core antigen assay is a cost-effective, sensitive and specific test in the detection of acute hepatitis C in HIV infected subjects. HIV Med. 2014;15:8. Abstract or poster
38.
Cavazza S , LaggingM. Indeterminate third-generation hepatitis C recombinant immunoblot assay and HCV RNA analysis: isolated reactivity against NS5 associated with HCV viraemia in clinical patients but not blood donors. Scand J Infect Dis. 2005;37(6–7):488–92. No HCV core antigen performed [PubMed: 16012009]
39.
Cetinić Balent N , MikulićR, ĐakovićRode O. Enzyme immunoassay for separate detection of anti-HCV antibodies to individual HCV antigens as a confirmatory assay in diagnostics of HCV infection. Infektoloski Glasnik. 2013;33(3):109–15. No HCV core antigen performed
40.
Chakravarti A , ChauhanMS, DograG, BanerjeeS. Hepatitis C virus core antigen assay: can we think beyond convention in resource limited settings? Braz J Infect Dis. 2013;17(3):369–74. Non-commercial or off market assay [PMC free article: PMC9427406] [PubMed: 23602467]
41.
Challine D , DameronG, LapercheL, LarderieP, RigotP, ClaquinJ, et al. Does HCV core antigen or nucleic acid testing in graft donors improve organ transplantation viral safety? Transfusion. 2001;41(9):3S–4S. Abstract or poster
42.
Chaudhary R , BurresE. Detection of antibody to envelope (E2) antigen of hepatitis C virus. Can J Infect Dis. 1997;8(4):229–31. No HCV core antigen performed [PMC free article: PMC3250881] [PubMed: 22346519]
43.
Choi YJ , HuY, GorisJ, KimE. Histopathology, viral antigen and RNA in hepatitis C virus-associated hepatitis. Lab Invest. 1997;76(1):803.
44.
Cividini A , CerinoA, MuzziA, FurioneM, RebucciC, SegagniL, et al. Kinetics and significance of serum hepatitis C virus core antigen in patients with acute hepatitis C. J Clin Microbiol. 2003;41(5):2144–6. Less than 10 independent samples [PMC free article: PMC154695] [PubMed: 12734263]
45.
Courouce AM , BarinF, BotteC, LunelF, MaisonneuveP, ManiezM, et al. A comparative evaluation of the sensitivity of 7 anti-hepatitis-C virus screening tests. Vox Sang. 1995;69(3):213–6. No HCV core antigen performed [PubMed: 8578733]
46.
Couroucé AM , Le MarrecN, BouchardeauF, RazerA, ManiezM, LapercheS, et al. Efficacy of HCV core antigen detection during the preseroconversion period. Transfusion. 2000;40(10):1198–202. Less than 10 independent samples [PubMed: 11061855]
47.
Craxi A , ValenzaM, FabianoC, MagrinS, FiorentinoG, DiquattroO, et al. Third generation hepatitis C virus tests in asymptomatic anti-HCV-positive blood donors. J Hepatol. 1994;21(5):730–4. No HCV core antigen performed [PubMed: 7890886]
48.
Cresswell F , ShawS, HughesD, YoussefE, HomerG, Hassan-IbrahimM, et al. Hepatitis C antigen testing: a reliable alternative for diagnosing acute hepatitis C infection. HIV Med. 2014;15:137. Abstract or poster
49.
Cucchietti A , ParkerS, OldfieldL, LimasC, GarrodA, McBryneL. Seroconversion sensitivity of elisa screening assays for HCV, HIV and HBV antigens and/or antibodies. Vox Sang. 2011;101:87. Abstract or poster
50.
Daniel HD , VivekanandanP, RaghuramanS, SridharanG, ChandyGM, AbrahamP. Significance of the hepatitis C virus (HCV) core antigen as an alternative plasma marker of active HCV infection. Indian J Med Microbiol. 2007;25(1):37–42. Non-commercial or off-market assay [PubMed: 17377351]
51.
Daniel HDJ , ChandyGM, AbrahamP. Quantitation of hepatitis C virus using an in-house real-time reverse transcriptase polymerase chain reaction in plasma samples. Diagn Microbiol Infect Dis. 2008;61(4):415–20. No HCV core antigen performed [PubMed: 18486403]
52.
Dawson G . The potential role of HCV core antigen testing in diagnosing HCV infection. Antivir Ther. 2012;17(7 PART B):1431–5. Review article [PubMed: 23322590]
53.
Dawson GJ . HCV core antigen and combination (antigen/antibody) assays for the detection of early Seroconversion. J Med Virol. 2007;79:S54–S8. Review article
54.
Dawson GJ . HCV core antigen detection in seropositive samples. J Med Virol. 2007;79:S52–S3. Review article
55.
De Almeida Ponde RA . Enzyme-linked immunosorbent/chemiluminescence assays, recombinant immunoblot assays and nucleic acid tests in the diagnosis of HCV infection. Eur J Clin Microbiol. Infect Dis2013;32(8):985–8. Review article [PubMed: 23666504]
56.
Dickson RC , MizokamiM, OritoE, QianK, LauJYN. Quantification of serum HCV core antigen by a fluorescent enzyme immunoassay in liver transplant recipients with recurrent hepatitis C – clinical and virologic implications. Transplantation. 1999;68(10):1512–6. Non-commercial or off-market assay [PubMed: 10589948]
57.
Dow BC , MunroH, BuchananI, FergusonK, DavidsonF, LycettC, et al. Acute hepatitis C virus seroconversion in a Scottish blood donor: HCV antigen is not comparable with HCV nucleic acid amplification technology screening. Vox Sang. 2004;86(1):15–20. Less than 10 independent samples [PubMed: 14984555]
58.
Dubrous P , HugardL, TerrierF. Screening for HCV core antigen among HIV-positive patients infected by sexual transmission. Med Mal Infect. 2004;34(5):236–8. Less than 10 independent samples [PubMed: 16235605]
59.
Durante-Mangoni E , VallefuocoL, PernaE, IossaD, AndiniR, CaianielloC, et al. Correlates and prognostic value of hepatitis C virus core antigen serum levels during chronic infection and treatment. Clin Microbiol Infect. 2010;16:S317. Abstract or poster
60.
Dwyer E , RileyP, PakianathanM. Analysis of hepatitis C antigen testing in an urban sexual health clinic. HIV Med. 2014;15:111–2. Abstract or poster
61.
Eiras A , FrancoE, MontoroJA, PlanellesD, VillaescusaR. HCV NAT (minipool RT-PCR) and HCV core antigen ELISA. Transfusion. 2003;43(1):118; author reply -9. Editorial or comment [PubMed: 12519441]
62.
El Ekiaby M , LapercheS, MoftahF, BurnoufT, LelieN. The impact of different HCV blood screening technologies on the reduction of transfusion transmitted HCV infection risk in Egypt. Vox Sang. 2009;96:23–4. Abstract or poster
63.
Ellethy AT , SliemHA, HassanGMA. Updated molecular diagnosis of chronic hepatitis C. J Gastroenterol Hepatol Res. 2012;1(8):147–52. Review article
64.
Ergunay K , SenerB, AlpA, KarakayaJ, HascelikG. Quantitative determination of HCV core antigen: A marker for monitoring hepatitis C viraemia. Clin Microbiol Infect. 2011;17:S663. Abstract or poster
65.
Fabrizi F , LunghiG, AucellaF, ManganoS, BarbisoniF, BisegnaS, et al. Novel assay using total hepatitis C virus (HCV) core antigen quantification for diagnosis of HCV infection in dialysis patients. J Clin Microbiol. 2005;43(1):414–20. Non-commercial or off-market assay [PMC free article: PMC540167] [PubMed: 15635003]
66.
Frank K , KarlA. Comparison of different confirmation test methods to anti-HCV used for repeatedly HCV-reactive samples. Infusionsther Transfusionsmed. 2001;28(Suppl. 1):47. No HCV core antigen performed
67.
Galli C . New strategies for the identification of active hepatitis C virus (HCV) infections. Biochim Clin. 2013;37:S137. Abstract or poster
68.
Galli C . New strategies for the screening of hepatitis C virus infection. Vox Sang. 2013;105:181. Abstract or poster
69.
Gaudy C , ThevenasC, TichetJ, MariotteN, GoudeauA, DuboisF. Usefulness of the hepatitis C virus core antigen assay for screening of a population undergoing routine medical checkup. J Clin Microbiol. 2005;43(4):1722–6. Non-commercial or off-market assay [PMC free article: PMC1081371] [PubMed: 15814991]
70.
Gavarro A , CebolleroA, MartinezS, VeraguasA, AcostaA. Evaluation of a new method to determine core antigen of hepatitis C virus and its comparison with the determination of RNAHCV. Clin Chem Lab Med. 2011;49:S522–S. Abstract or poster
71.
Grant PR , SimsCM, TedderRS. Quantification of HCV RNA levels and detection of core antigen in donations before seroconversion. Transfusion. 2002;42(8):1032–6. Non-commercial or off-market assay [PubMed: 12385415]
72.
Gu SJ , LiuJ, ZhangHJ, GuBL, LaiHJ, ZhouHL, et al. Core antigen tests for hepatitis C virus: a meta-analysis. Mol Biol Rep. 2012;39(8):8197–208. Review article [PubMed: 22544611]
73.
Hadziyannis E , VassilopoulosD, GeorgiouA, SpanouF, KoskinasJ. Comparison of a new HCV core antigen automated immunoassay to quantitative HCV RNA measurement in patients with chronic hepatitis C. Hepatology. 2010;52(4):1230A. Abstract or poster
74.
Hayashi K , HasuikeS, KusumotoK, IdoA, UtoH, KenjiN, et al. Usefulness of a new immunoradiometric assay to detect hepatitis C core antigen in a community-based population. J Viral Hepat. 2005;12(1):106–10. Non-commercial or off-market assay [PubMed: 15655057]
75.
Heidrich B , PischkeS, KirschnerJ, SchneiderJ, MederackeI, RaupachR, et al. Performance of HCV-core antigen testing in liver transplanted patients. J Hepatol. 2011;54:S223. Abstract or poster
76.
Higashimoto M , TakahashiM, JokyuR, SyundouH, SaitoH. Improvement of sensitivity in the second generation HCV core antigen assay by a novel concentration method using polyethylene glycol (PEG). Rinsho Byori. 2007;55(11):1008–14. Less than 10 independent samples [PubMed: 18154032]
77.
Hmaïed F , BenMamou M, ArroujiZ, SlimA, BenRedjeb S. Use of combined detection of hepatitis C virus core antigen and antibodies to reduce the serological window-phase. Pathol Biol (Paris). 2007;55(2):121–6. Inappropriate reference test [PubMed: 16631320]
78.
Hosseini-Moghaddam SM , Iran-PourE, RotsteinC, HusainS, LillyL, RennerE, et al. Hepatitis C core Ag and its clinical applicability: potential advantages and disadvantages for diagnosis and follow-up? Rev Med Virol. 2012;22(3):156–65. Review article [PubMed: 22121001]
79.
Icardi G , AnsaldiF, BruzzoneBM, DurandoP, LeeS, de LuigiC, et al. Novel approach to reduce the hepatitis C virus (HCV) window period: clinical evaluation of a new enzyme-linked immunosorbent assay for HCV core antigen. J Clin Microbiol. 2001;39(9):3110–14. Less than 10 independent samples [PMC free article: PMC88305] [PubMed: 11526137]
80.
Icardi G , BruzzoneB, GotaF, TorreF, GianniniE, MassoneL, et al. A new assay for hepatitis C virus (HCV) core antigen detection: an alternative to nucleic acid technologies in positive or indeterminate anti-HCV subjects?Ann Ig. 2003;15(6):863–70. Non-commercial or off market assay [PubMed: 15049543]
81.
Irshad M , DharI, JoshiYK. Significance of hepatitis C virus core protein in the diagnosis of hepatitis C virus infection in different liver diseases. J Investig Med. 2006;54(8):478–83. Duplicate data [PubMed: 17169273]
82.
Irshad M , DharI, Khushboo, SinghS, KapoorS. Comparison of serological and nucleic Acid based assays used to diagnose hepatitis C virus (HCV) infection in acute and chronic liver diseases. Int J Health Sci (Qassim). 2007;1(1):3–10. No extractable data, no response from author [PMC free article: PMC3068650] [PubMed: 21475446]
83.
Ivanov YD , KayshevaAL, FrantsuzovPA, PleshakovaTO, KrohinNV, IzotovAA, et al. Detection of hepatitis C virus core protein in serum by atomic force microscopy combined with mass spectrometry. Int J Nanomedicine. 2015;10:1597–608. Non-commercial or off market assay [PMC free article: PMC4346358] [PubMed: 25759582]
84.
Ivanyi-Nagy R , MakowskaZ, LastraML, DarlixJL. Overview on the properties and functions of the core protein of hepatitis C cvirus (HCV). In: BernhardtLV, editor. Nova Science Publishers; 2010:1–47. Textbook chapter
85.
Kamili S , DrobeniucJ, AraujoAC, HaydenTM. Laboratory diagnostics for hepatitis C virus infection. Clin Infect Dis. 2012;55:S43–S48. Review article [PubMed: 22715213]
86.
Kashiwakuma T , HasegawaA, KajitaT, TakataA, MoriH, OhtaY, et al. Detection of hepatitis C virus specific core protein in serum of patients by a sensitive fluorescence enzyme immunoassay (FEIA). J Immunol Methods. 1996;190(1):79–89. Non-commercial or off-market assay [PubMed: 8601714]
87.
Kenfe FR , UrbaczekAC, SilvaJC, NeóTA, Da SilvaFH, Da CostaPI. Development of diagnostic methods and study of the immunoreactivity of a mixture of recombinant core and E2 proteins fused to GST with control serum positive for hepatitis C. Talanta. 2013;110:32–8. Noncommercial or off-market assay [PubMed: 23618172]
88.
Kesli R , PolatH, TerziY, KurtogluMG, UyarY. Comparison of a newly developed automated and quantitative hepatitis C virus core antigen test with the hepatitis C virus RNA assay for the clinical usefulness of confirming anti-hepatitis C virus results. Clin Microbiol Infect. 2012;18:676. [PMC free article: PMC3233016] [PubMed: 21940466]
89.
Kocazeybek B , YukselP, SaribasS, CaliskanR, ErginS, AslanM, et al. New approaches in in-vitro diagnosis of hepatitis C infections: the diagnostic performance of new hepatitis C virus core antigen detection test. Int J Infect Dis. 2010;14:e228. Abstract or poster
90.
Krajden M , ShivjiR, GunadasaK, MakA, McNabbG, FriesenhahnM, et al. Evaluation of the core antigen assay as a second-line supplemental test for diagnosis of active hepatitis C virus infection. J Clin Microbiol. 2004;42(9):4054–9. Non-commercial or off-market assay [PMC free article: PMC516310] [PubMed: 15364989]
91.
Kuo YH , LuSN. Is HCV core antigen (HCV Ag) an adequate marker for community screening? Hepatol Int. 2012;6(1):201–2. Abstract or poster
92.
Kups J , Wozniakowska-GesickaT. Evaluation of specific humoral response to hepatitis C core antigen in children. Przegl Lek. 2003;60(12):802–5. No HCV core antigen performed [PubMed: 15058020]
93.
Kurtz JB , BoxallE, QusirN, ShirleyJ, ColemanD, ChandlerC. The diagnostic significance of an assay for “total” hepatitis C core antigen. J Virol Methods. 2001;96(2):127–32. Non-commercial or off-market assay [PubMed: 11445143]
94.
Lagging LM , GarciaCE, WestinJ, WejstålR, NorkransG, DhillonAP, et al. Comparison of serum hepatitis C virus RNA and core antigen concentrations and determination of whether levels are associated with liver histology or affected by specimen storage time. J Clin Microbiol. 2002;40(11):4224–9. Non-commercial or off-market assay [PMC free article: PMC139660] [PubMed: 12409402]
95.
Lambert N . Value of HCV antigen-antibody combined HCV assay in hepatitis C diagnosis. Dev Biol (Basel). 2007;127:113–21. Review article [PubMed: 17486884]
96.
Laperche S , ElghouzziMH, MorelP, Asso-BonnetM, Le MarrecN, GiraultA, et al. Is an assay for simultaneous detection of hepatitis C virus core antigen and antibody a valuable alternative to nucleic acid testing?Transfusion. 2005;45(12):1965–72. Non-human subjects or commercial samples [PubMed: 16371051]
97.
Combined detection of hepatitis C virus core antigen and antibody as an alternative to nucleic acid testing in blood screening. Vox Sang. 2005;89:21. Abstract or poster
98.
Laperche S , Le MarrecN, SimonN, BouchardeauF, DeferC, Maniez-MontreuilM, et al. A new HCV core antigen assay based on disassociation of immune complexes: an alternative to molecular biology in the diagnosis of early HCV infection. Transfusion. 2003;43(7):958–62. Noncommercial [PubMed: 12823757]
99.
Laperche S , RougerP, SmiloviciW, HerveP, LefrereJJ. Alternatives to nucleic acid testing in the blood transfusion service. Lancet. 2002;360(9344):1519. Editorial or comment [PubMed: 12433563]
100.
Larrat S , BourdonC, BaccardM, GarnaudC, HilleretMN, QuesadaJL, et al. HCV screening without venipuncture: pointof-care versus laboratory-based antigenantibody combined assay. Hepatology. 2011;54:573A–4A. Abstract or poster
101.
Larrat S , BourdonC, BaccardM, GarnaudC, MathieuS, QuesadaJL, et al. Performance of an antigen-antibody combined assay for hepatitis C virus testing without venipuncture. J Clin Virol. 2012;55(3):220–5. Inappropriate reference test [PubMed: 22901327]
102.
Leary TP , GutierrezRA, MuerhoffAS, BirkenmeyerLG, DesaiSM, DawsonGJ. A chemiluminescent, magnetic particle-based immunoassay for the detection of hepatitis C virus core antigen in human serum or plasma. J Med Virol. 2006;78(11):1436–40. Non-human subjects or commercial samples [PubMed: 16998880]
103.
Lee L , PerrettG, HowardP, MakanjuolaD, ClarkJ. HCV p22 antigen test: Serological response and diagnostic advantages. Gut. 2012;61:A140. Abstract or poster
104.
Lee S , KimYS, JoMJ, JinM, LeeDK, KimS. Chip-based detection of hepatitis C virus using RNA aptamers that specifically bind to HCV core antigen. Biochem Biophys Res Commun. 2007;358(1):47–52. Non-commercial or off-market assay [PubMed: 17475212]
105.
Lee SR , PetersonJ, NivenP, BahlC, PageE, DeLeysR, et al. Efficacy of a hepatitis C virus core antigen enzyme-linked immunosorbent assay for the identification of “window-phase” blood donations. Vox Sang. 2001;80(1):19–23. Non-commercial or off-market assay [PubMed: 11339063]
106.
Leon P , LopezJA, ElolaC, LeeSR, CalmannM, EchevarriaJM. Use of overlapping synthetic peptides to characterize samples from blood donors with indeterminate results to hepatitis C virus core antigen. Vox Sang. 1998;75(1):32–6. No HCV core antigen performed [PubMed: 9745151]
107.
Letowska M , RosiekA, GronowskaA, MikulskaM, GrabarczykP, BrojerE. Hepatitis C virus (HCV) core antigen detection in HCV RNA-positive/anti-HCV-negative Polish blood donors identified by nucleic acid testing. Transfusion. 2009;49(10):2241–2. Editorial or comment [PubMed: 19903286]
108.
Li Cavoli G , ZagarrigoC, SchillaciO, TralongoA, RotoloU. Hepatitis C virus core antigen testing in the monitoring of patients on dialysis. Saudi J Kidney Dis Transpl. 2012;23(5):1056–8. Editorial or comment [PubMed: 22982924]
109.
Li Cavoli G , ZagarrigoC, TralongoA, SchillaciO, RotoloU, Li DestriN, et al. Hepatitis C virus core antigen in virological monitoring of dialysis patients. NDT Plus. 2010;3:iii247. Duplicate data [PMC free article: PMC5477968] [PubMed: 28657071]
110.
Liao WS , ShenCH, TungSY, LeeJH. Detection of NS3 antigen of hepatitis C virus in liver tissue and its relation to serum HCV-RNA. J Gastroenterol Hepatol. 2009;24:A182. Non-blood specimen
111.
Long L , ShenT, GaoJ, DuanZ, LiangH, LuF. Effectiveness of HCV core antigen and RNA quantification in HCV-infected and HCV/HIV-1-coinfected patients. BMC Infect Dis. 2014;14:577. No extractable data, non-response from author [PMC free article: PMC4225041] [PubMed: 25371245]
112.
Long RX , LiH, CuiPF. Stability of three hepatitis C virus markers. Chinese Journal of Biologicals. 2009;22(5):468–9, 473. No HCV core antigen performed
113.
Lorenzo J , CastroA, AguileraA, PrietoE, López-CalvoS, RegueiroB, et al. Total HCV core antigen assay: a new marker of HCV viremia and its application during treatment of chronic hepatitis C. J Virol Methods. 2004;120(2):173–7. Non-commercial or off-market assay [PubMed: 15288960]
114.
Lozano ML , CandelaMJ, LozanoML, CanoH, ZuazuI, VicenteV. Detection of free hepatitis C virus core antigen by enzyme-linked immunosorbent assay is not suitable for screening of granulocyte colony-stimulating factor-mobilized hematopoietic progenitor donors. Transfusion. 2004;44(12):1755–61. Non-commercial or off-market assay [PubMed: 15584991]
115.
Łucejko M , GrzeszczukA, JaroszewiczJ, FlisiakR. [Serum HCV core antigen concentration in HCV monoinfection and HCV/HIV coinfection.] Pol Merkur Lekarski. 2013;35(206):72–6. Unable to translate [PubMed: 24052984]
116.
Lunel F , PivertA, PayanC, CommRS. Comparison of HCV RNA and HCV core antigen kinetics in the follow up of a therapeutic protocol in HCV-HIV co-infected patients (RIBAVIC). J Hepatol. 2004;40:144–5. Abstract or poster
117.
Lunel F , VeillonP. Antigen and viral load. Transfus Clin Biol. 2003;10(2):74–7. Non-commercial or off-market assay [PubMed: 12763148]
118.
Lunel F , VeillonP, PayanC. Evaluation of the ortho total HCV core antigen assay in comparison to methods of detection and quantification for HCV RNA. Hepatology. 2002;36(4):353A. Abstract or poster
119.
Lunel-Fabiani F , PayanC. Virological tools for the diagnosis and follow up of hepatitis C: use and role of new tests. Gastroenterol Clin Biol. 2003;27(8–9):718–26. Review article [PubMed: 14586244]
120.
Ma CX , XieGM, ZhangW, LiangM, LiuB, XiangH. Label-free sandwich type of immunosensor for hepatitis C virus core antigen based on the use of gold nanoparticles on a nanostructured metal oxide surface. Mikrochim Acta. 2012;178(3–4):331–40. Non-commercial or off-market assay
121.
Masalova OV , AtanadzeSN, SamokhvalovEI, PetrakovaNV, KalininaTI, SmirnovVD, et al. Detection of hepatitis C virus core protein circulating within different virus particle populations. J Med Virol. 1998;55(1):1–6. Non-commercial or off-market assay [PubMed: 9580878]
122.
Masalova OV , VishnevskaiaTV, ShkurkoTV, GaranzhaTA, TupolevaTA, FilatovFP, et al. Comparative analysis of hepatitis C virus core protein in the plasma and serum samples from HCV-infected blood donors and patients with hepatitis C. Vopr Virusol. 2007;52(4):11–7. Noncommercial or off-market assay [PubMed: 17722604]
123.
Masopust J , KracíkováJ, NěmečekV, ProcházkováR. [A combined antigen-antibody HCV detection assay.] Transfuze a Hematologie Dnes. 2005;11(4):141–7. Unable to translate
124.
Massaguer A , FornsX, CostaJ, FeliuA, García-RetortilloM, NavasaM, et al. Performance of hepatitis C virus core antigen immunoassay in monitoring viral load after liver transplantation. Transplantation. 2005;79(10):1441–4. Non-commercial or off-market assay [PubMed: 15912117]
125.
Mathur A . Comparative evaluation of anti-HCV-third-generation assay and anti-HCV-fourth-generation assay in blood donor screening. Transfusion. 2014;54:216A–7A. Abstract or poster
126.
Mayerhofer T , DeimelM, AmbrusE, BertschAL, AliskanovicV, Trubert-ExingerD, et al. Evaluation of the clinical performance of the Abbott ARCHITECT HCV core antigen assay. Clinical Chemistry and Laboratory Medicine. 2012;50(4):A86. Abstract or poster
127.
Mederacke I , MeierM, LüthJB, Schmidt-GürtlerH, RaupachR, Horn-WichmannR, et al. Different kinetics of HBV and HCV during haemodialysis and absence of seronegative viral hepatitis in patients with end-stage renal disease. Nephrol Dial Transplant. 2011;26(8):2648–56. Less than 10 independent samples [PubMed: 21273235]
128.
Mederacke I , RaupachR, MannsMP, WedemeyerH, TillmannHL. Quantitative HCV core antigen and HCV-RNA kinetics in HCV infected patients over a period of up to 8 years. Hepatology. 2009;50(4):1070A–1A. Abstract or poster
129.
Medhi S , PotukuchiSK, PolipalliSK, SwargiarySS, DekaP, ChaudharyA, et al. Diagnostic utility of hepatitis C virus core antigen in hemodialysis patients. Clin Biochem. 2008;41(7–8):447–52. Non-commercial or off market assay [PubMed: 18267117]
130.
Meng S , LiX, YinH, LiDF. Establishment of detection test for hepatitis C virus antigen. Zhonghua Shi Yan He Lin Chuang Bing Du Xue Za Zhi. 2001;15(3):287–90. Non-commercial or off-market assay [PubMed: 11986709]
131.
Miceli M , AgrestiA, PalangeM, IudiconeP, PaluzziC, PerretM, et al. A new high sensitive HCV antigen assay for blood donors screening. Vox Sang. 2010;99:300. Abstract or poster
132.
Mihaljevic I . Evaluation of the architect HCV antigen assay for use in organ and tissue donors. Vox Sang. 2009;96:24. Abstract or poster
133.
Moini M , ZiyaeyanM, AghaeiS, SaghebMM, TaghaviSA, MoeiniM, et al. Hepatitis C virus (HCV) infection rate among seronegative hemodialysis patients screened by two methods; HCV core antigen and polymerase chain reaction. Hepat Mon. 2013;13(6). Non-commercial or off-market assay [PMC free article: PMC3768235] [PubMed: 24032048]
134.
Moini M , ZiyaeyanM, AghaeiS, SaghebMM, TaghaviSA, MoeiniM, et al. Hepatitis C virus (HCV) screening using HCV core antigen in hemodialysis patients. Hepatol Int. 2012;6(1):150. Abstract or poster [PMC free article: PMC3768235] [PubMed: 24032048]
135.
Moreno M , Pérez-AlvarezR, RodrigoL, Pérez-LópezR, Suárez-LeivaP. Long-term evolution of serum and liver viral markers in patients treated for chronic hepatitis C and sustained response. J Viral Hepat. 2006;13(1):28–33. Non-commercial or off market-assay [PubMed: 16364079]
136.
Moriya T , SasakiF, TanakaJ, MizuiMa, NakanishiT, TakahashiK, et al. Comparison of HCV core antigen activity by ELISA and amount of HCV RNA by branched DNA assay. International Hepatology Communications. 1994;2(3):175–7. Non-commercial or off-market assay
137.
Morota K , FujinamiR, KinukawaH, MachidaT, OhnoK, SaegusaH, et al. A new sensitive and automated chemiluminescent microparticle immunoassay for quantitative determination of hepatitis C virus core antigen. J Virol Methods. 2009;157(1):8–14. Non-human subjects or commercial samples [PubMed: 19135481]
138.
Muerhoff AS , JiangL, ShahDO, GutierrezRA, PatelJ, GarolisC, et al. Detection of HCV core antigen in human serum and plasma with an automated chemiluminescent immunoassay. Transfusion. 2002;42(3):349–56. Non-commercial or off-market assay [PubMed: 11961241]
139.
Mukomolov S , BarantsevichE, MukomolovaA, BarantsevichN, SchlyakhtoE. Study of sensitivity and specificity of ELISA test system MONOLISA HCV Ag-Ab ULTRA. Clin Microbiol Infect. 2010;16:S298. Abstract or poster
140.
Nayak NC , SatharSA. Immunohistochemical detection of hepatitis C virus antigen in paraffin embedded liver biopsies from patients with chronic liver disease. Acta Histochem. 1999;101(4):409–19. Non-blood specimens [PubMed: 10611929]
141.
Netski DM , WangXH, MehtaSH, NelsonK, CelentanoD, ThongsawatS, et al. Hepatitis C virus (HCV) core antigen assay to detect ongoing HCV infection in Thai injection drug users. J Clin Microbiol. 2004;42(4):1631–6. Non-commercial or off-market assay [PMC free article: PMC387596] [PubMed: 15071017]
142.
Nuovo GJ , HollyA, WakelyP, FrankelW. Correlation of histology, viral load, and in situ viral detection in hepatic biopsies from patients with liver transplants secondary to hepatitis C infection. Hum Pathol. 2002;33(3):277–84. Non-blood specimens [PubMed: 11979367]
143.
Oliva JA , ErcillaG, MallafreJM, BrugueraM, CarrioJ, PereiraBJ. Markers of hepatitis C infection among hemodialysis patients with acute and chronic infection: implications for infection control strategies in hemodialysis units. Int J Artif Organs. 1995;18(2):73–7. No HCV core antigen performed [PubMed: 7558399]
144.
Orito E , MizokamiM, TanakaT, LauJYN, SuzukiK, YamauchiM, et al. Quantification of serum hepatitis C virus core protein level in patients chronically infected with different hepatitis C virus genotypes. Gut. 1996;39(6):876–80. Non-commercial or off-market assay [PMC free article: PMC1383464] [PubMed: 9038674]
145.
Ottiger C , GygliN, HuberAR. Detection limit of architect hepatitis C Core antigen assay in correlation with HCV-PCR viral load. Clinical Chemistry and Laboratory Medicine. 2012;50(5):A171. Abstract or poster
146.
Pawelczyk A , KubisaN, JablonskaJ, Bukowska-OskoI, CaraballoCortes K, FicM, et al. Detection of hepatitis C virus (HCV) negative strand RNA and NS3 protein in peripheral blood mononuclear cells (PBMC): CD3+, CD14+ and CD19+. Virol J. 2013;10:346. No HCV core antigen performed [PMC free article: PMC4222874] [PubMed: 24279719]
147.
Pawlotsky JM . Use and interpretation of virological tests for hepatitis C. Hepatology. 2002;36(5):S65–S73. Review article [PubMed: 12407578]
148.
Pawlotsky JM . Use and interpretation of hepatitis C virus diagnostic assays. Clin Liver Dis. 2003;7(1):127–37. Review article [PubMed: 12691462]
149.
Pessôa MG , AlvesVAF, WakamatsuA, GomesJG, MaertensG, van der BorghtB, et al. Post-transplant recurrent hepatitis C: immunohistochemical detection of hepatitis C virus core antigen and possible pathogenic implications. Liver Int. 2008;28(6):807–13. Non-blood specimens [PubMed: 18422936]
150.
Peterson J , GreenG, IidaK, CaldwellB, KerrisonP, BernichS, et al. Detection of hepatitis C core antigen in the antibody negative “window” phase of hepatitis C infection. Vox Sang. 2000;78(2):80–5. Non-commercial or off-market assay [PubMed: 10765142]
151.
Pham BN , Martinot-PeignouxM, RipaultMP, BoyerN, LevyV, MarcellinP. Quantitative measurement of hepatitis C virus core antigen is affected by the presence of cryoglobulins. Clin Exp Immunol. 2006;146(2):211–17. Non-commercial or off-market assay [PMC free article: PMC1942051] [PubMed: 17034572]
152.
Pivert A , PayanC, LunelF, Conseil scientifique R. Comparison of hepatitis C viral RNA and core antigen kinetics in the therapeutic follow up of hepatitis C virus and human immunodeficiency virus co-infected patients, treated by bitherapy interferon-ribavirin, within the framework of RIBAVIC protocol. Pathol Biol (Paris). 2004;52(9):522–8. Duplicate data [PubMed: 15531116]
153.
Podesta MA , CancariniG, CucchiariD, MontanelliA, BadalamentiS, GrazianiG. Diagnosis and follow-up of HCV infection in hemodialysis patients and renal transplant recipients: HCV core antigen and IgM anti-HCV. Nephrol Dial Transplant. 2014;29:iii514. Abstract or poster
154.
Poljak M , LepejSZ, RodeOA. Recent developments in serologic and molecular diagnosis of hepatitis B and C. Acta Med Croatica. 2013;67(4):281–90. Review article [PubMed: 24984327]
155.
Pontisso P , CarabaichA, BernardinelloE, BoccatoS, ChemelloL, GattaA, et al. Correlation of HCV RNA to total HCV core antigen in chronic hepatitis C patients. Hepatology. 2002;36(4):546A. Abstract or poster
156.
Pradat P , MaynardM, BerthillonP, BaillyF, BordesI, TillmannHL, et al. Baseline HCV core antigen/HCV RNA ratio: association with treatment responses. Hepatology. 2004;40(4):326A. Abstract or poster
157.
Raffaele L , SpreaficoM, FoglieniB, GuarnoriI, AlessandraB, GalliC, et al. Performance evaluation of fully automated quantitative HCV-core antigen assay. Transfusion. 2010;50:202A. Abstract or poster
158.
Raker CA , TaborE, OkayamaA, YuMYW, KoharaM, MuellerNE, et al. HCV core antigen as an alternative to NAT to detect HCV viremia. Transfusion. 2004;44(2):307–8. Editorial or comment [PubMed: 14962325]
159.
Ravera G , BottaroLC, FranceschiniM, MorandoA, De PoloM, ZareM, et al. Reliability and diagnostic use of a test for the search of the hepatitis C virus Ag (AgHCV). Hepatogastroenterology. 2006;53(71):753–6. Non-commercial or off-market assay [PubMed: 17086882]
160.
Rebucci C , CerinoA, CividiniA, TimoL, FurioneM, MondelliMU. Monitoring response to antiviral therapy for patients with chronic hepatitis C virus infection by a core-antigen assay. J Clin Microbiol. 2003;41(8):3881–4. Less than 10 independent samples [PMC free article: PMC179816] [PubMed: 12904409]
161.
Reddy AK , DakshinamurtyKV, LakshmiV. Utility of HCV core antigen ELISA in the screening for hepatitis C virus infection in patients on hemodialysis. Indian J Med Microbiol. 2006;24(1):55–7. Less than 10 independent samples [PubMed: 16505558]
162.
Rehany U , ChaikovskyI, Kra-OzZ, SatingerJ, BersudskyV, CohenI. The expression of hepatitis-C virus antigen by immunohistochemical stain and polymerase chain reaction in corneas of seropositive corneal donors. Cell Tissue Bank. 2002;3(2):139–44. Non-blood specimens [PubMed: 15256891]
163.
Romano L , ZanettiAR, BrunettoM, CiccorossiP, LeeSR, CalmannM, et al. Correlation of total HCV core antigen ELISA to HCV RNA in liver transplant patients. Hepatology. 2002;36(4):654A. Abstract or poster
164.
Ross RS , ViazovS, SalloumS, HilgardP, GerkenG, RoggendorfM. Analytical performance characteristics and clinical utility of a novel assay for total hepatitis C virus core antigen quantification. J Clin Microbiol. 2010;48(4):1161–8. No extractable data, no response from author [PMC free article: PMC2849592] [PubMed: 20107102]
165.
Sabry AA , SobhMA, IrvingWL, GrabowskaA, WagnerBE, FoxS, et al. A comprehensive study of the association between hepatitis C virus and glomerulopathy. Nephrol Dial Transplant. 2002;17(2):239–45. Non-blood specimens [PubMed: 11812873]
166.
Saeed M , SuzukiR, KondoM, AizakiH, KatoT, MizuochiT, et al. Evaluation of hepatitis C virus core antigen assays in detecting recombinant viral antigens of various genotypes. J Clin Microbiol. 2009;47(12):4141–3. Non-human subjects or commercial samples [PMC free article: PMC2786616] [PubMed: 19812276]
167.
Sansonno D , IacobelliAR, CornacchiuloV, IodiceG, DammaccoF. Detection of hepatitis C virus (HCV) proteins by immunofluorescence and HCV RNA genomic sequences by non isotopic in situ hybridization in bone marrow and peripheral blood mononuclear cells of chronically HCV-infected patients. Clin Exp Immunol. 1996;103(3):414–21. Non-blood specimens [PMC free article: PMC2200370] [PubMed: 8608640]
168.
Sansonno D , LaulettaG, DammaccoF. Detection and quantitation of HCV core protein in single hepatocytes by means of laser capture microdissection and enzyme-linked immunosorbent assay. J Viral Hepat. 2004;11(1):27–32. Non-blood specimens [PubMed: 14738555]
169.
Sansonno D , LaulettaG, MontroneM, GrandalianoG, SchenaFP, DammaccoF. Hepatitis C virus RNA and core protein in kidney glomerular and tubular structures isolated with laser capture microdissection. Clin Exp Immunol. 2005;140(3):498–506. Non-blood specimens [PMC free article: PMC1809381] [PubMed: 15932511]
170.
Sansonno D , LaulettaG, NisiL, GattiP, PesolaF, PansiniN, et al. Non-enveloped HCV core protein as constitutive antigen of cold-precipitable immune complexes in type II mixed cryoglobulinaemia. Clin Exp Immunol. 2003;133(2):275–82. Non-commercial or off-market assay [PMC free article: PMC1808767] [PubMed: 12869035]
171.
Sansonno L , LaulettaG, RussiS, DammaccoF. In situ simultaneous detection of hepatitis C virus RNA and hepatitis C virus-related antigens in hepatocellular carcinoma. Cancer Treatment Reviews. 2010;36:S98. Abstract or poster [PubMed: 9210705]
172.
Sarov B , NovackL, BeerN, SafiJ, SolimanH, PliskinJS, et al. Feasibility and cost-benefit of implementing pooled screening for HCVAg in small blood bank settings. Transfus Med. 2007;17(6):479–87. Does not apply to study question [PubMed: 17727618]
173.
Sarrazin C . Advances in diagnosis and management of virus c hepatitis. Biochim Clin. 2013;37:S60–S1. Review article
174.
Schiano TD , GutierrezJA, WalewskiJL, FielMI, ChengB, BodenheimerJrH, et al. Accelerated hepatitis C virus kinetics but similar survival rates in recipients of liver grafts from living versus deceased donors. Hepatology. 2005;42(6):1420–8. Does not apply to study question, noncommercial or off-market assay [PubMed: 16317672]
175.
Schiano TD , GutierrezJA, WalewskiJL, FielMI, ChengB, NelsonC, et al. HCV RNA, core antigen, ALT values, and histology after liver transplantation: two year follow-up of CDLT versus LDLT. Hepatology. 2004;40(4):164A. Abstract or poster
176.
Schmidt AJ , FalcatoL, ZahnoB, BurriA, RegenassS, MüllhauptB, et al. Prevalence of hepatitis C in a Swiss sample of men who have sex with men: Whom to screen for HCV infection? BMC Public Health. 2014;14:3. Less than 10 independent samples [PMC free article: PMC3890510] [PubMed: 24393532]
177.
Schüttler CG , ThomasC, DischerT, FrieseG, LohmeyerJ, SchusterR, et al. Variable ratio of hepatitis C virus RNA to viral core antigen in patient sera. J Clin Microbiol. 2004;42(5):1977–81. Non-commercial or off-market assay [PMC free article: PMC404599] [PubMed: 15131157]
178.
Seiskari T , HorstiJ, AittoniemiJ. The value of HCV antigen test with reference to PCR in confirming infection in cases with indefinite antibody test result. J Clin Virol. 2011;51(1):90–1. Editorial or comment [PubMed: 21377410]
179.
Seme K , PoljakM, BabicDZ, MocilnikT, VinceA. The role of core antigen detection in management of hepatitis C: a critical review. J Clin Virol. 2005;32(2):92–101. Review article [PubMed: 15653411]
180.
Sentjens RE , van BaalK, VerhoevenG, LeeS, PieksmaF, NivenP, et al. Comparison of first and second generation HCV core antigen test with qualitative and quantitative HCV-RNA PCR. Hepatology. 2000;32(4):548A. Abstract or poster
181.
Serdarevic N . Detection of hepatitis C in serum using anti HCV and HCV Ag. Clinical Chemistry and Laboratory Medicine. 2014;52:S975. Abstract or poster
182.
Shah DO , ChangC, GutierrezR, ChengKY, JiangLX, SalbillaV, et al. Hepatitis C virus antibody test on a chemiluminescence automated analyzer as an aid in the diagnosis of HCV infection and for blood screening. Transfusion. 2010;50:203A–4A. Abstract or poster
183.
Shah DO , ChangCD, JiangLX, ChengKY, MuerhoffAS, GutierrezRA, et al. Combination HCV core antigen and antibody assay on a fully automated chemiluminescence analyzer. Transfusion. 2003;43(8):1067–74. Non-commercial or off-market assay [PubMed: 12869112]
184.
Shah O , ChangD, GutierrezA, ChengY, DesaiM, DawsonJ. Hepatitis C virus antibody assay on a chemiluminescence automated analyzer as an AID in the diagnosis of HCV infection and for blood screening. Vox Sang. 2010;99:297–8. Abstract or poster
185.
Shaw SG , CresswellF, HomerG, Hassan-IbrahimM, FisherM. Hepatitis C antigen testing: a reliable alternative for diagnosing acute HCV infection. Top Antivir Med. 2014;22(e–1):312. Abstract or poster
186.
Shen T , ChenX, ZhangW, XiY, CaoG, ZhiY, et al. A higher correlation of HCV core antigen with CD4+ T cell counts compared with HCV RNA in HCV/HIV coinfected patients. Hepatol Int. 2012;6(1):150. Abstract or poster [PMC free article: PMC3155566] [PubMed: 21858166]
187.
Shepherd SJ , AitkenC, WalkowiczM, McOwanJ, CameronSO, CarmanWF. HCV antigen testing in a busy diagnostic laboratory. Clin Microbiol Infect. 2012;18:676–7. Abstract or poster
188.
Shi HB , XieL, HuangDZ, HeLX. Detection of HCV antigen in the serum by immunodotting. Xi Bao Yu Fen Zi Mian Yi Xue Za Zhi. 2006;22(3):336–8. Non-commercial or off market assay [PubMed: 16643794]
189.
Song D , KangJE, KimSY, HwangSH, KimHH, LeeEY, et al. [Evaluation of ARCHITECT HCV core antigen assay.] [Article in Korean] Korean J Lab Med. 2010;30(6):654–9. Unable to translate [PubMed: 21157153]
190.
Syed SI , SadiqS. Immunohistochemical detection of hepatitis C virus (HCV) in liver biopsies of hepatitis C patients. J Pak Med Assoc. 2011;61(12):1198–201. Non-blood specimens [PubMed: 22355966]
191.
Tagny CT , MbanyaD, MurphyEL, LefrèreJJ, LapercheS. Screening for hepatitis C virus infection in a high prevalence country by an antigen/antibody combination assay versus a rapid test. J Virol Methods. 2014;199:119–23. Inappropriate reference test [PMC free article: PMC5042449] [PubMed: 24487098]
192.
Takahashi K , OkamotoH, KishimotoS, MunekataE, TachibanaK, AkahaneY, et al. Demonstration of a hepatitis C virus-specific antigen predicted from the putative core gene in the circulation of infected hosts. J Gen Virol. 1992;73(Pt 3):667–72. No HCV core antigen performed [PubMed: 1312124]
193.
Tanaka E , KiyosawaK, MatsumotoA, KashiwakumaT, HasegawaA, MoriH, et al. Serum levels of hepatitis C virus core protein in patients with chronic hepatitis C treated with interferon alfa. Hepatology. 1996;23(6):1330–3. Non-commercial or off-market assay [PubMed: 8675147]
194.
Tanaka E , OhueC, AoyagiK, YamaguchiK, YagiS, KiyosawaK, et al. Evaluation of a new enzyme immunoassay for hepatitis C virus (HCV) core antigen with clinical sensitivity approximating that of genomic amplification of HCV RNA. Hepatology. 2000;32(2):388–93. Non-commercial or off market assay [PubMed: 10915747]
195.
Tanoue Y , MaekawaH, InoueT, WatanabeT, ShimodaH, KurodaT, et al. The Cobas AmpliPrep/Cobas TaqMan real-time polymerase chain reaction assay produced false-negative results in two patients with hepatitis C virus genotype 2. Kanzo. 2013;54(7):507–8. Less than 10 independent samples
196.
Teo CG . Changing strategies for hepatitis C testing. Antivir Ther. 2012;17(7):1391–5. Review article [PubMed: 23322655]
197.
Thong V , AkkarathamrongsinS, AvihingsanonA, PoovorawanY, TangkijvanichP. The correlation between hepatitis C core antigen and HCV RNA levels with respect to HIV status, HCV genotype and IFNL4 polymorphism. J Viral Hepat. 2014;21:21. Abstract or poster
198.
Tillmann HL . Hepatitis C virus core antigen testing: role in diagnosis, disease monitoring and treatment. World J Gastroenterol. 2014;20(22):6701–6. Review article [PMC free article: PMC4051911] [PubMed: 24944462]
199.
Tillmann HL , WiegandJ, GlombI, JelineckA, PicchioG, WedemeyerH, et al. Diagnostic algorithm for chronic hepatitis C virus infection: role of the new HCV-Core antigen assay. Z Gastroenterol. 2005;43(1):11–6. Non-commercial or off-market assay [PubMed: 15650966]
200.
Tobler LH , StramerSL, LeeSR, BaggettD, WrightD, HirschkornD, et al. Performance of ORTHO (R) HCV core antigen and trak-C (TM) assays for detection of viraemia in pre-seroconversion plasma and whole blood donors. Vox Sang. 2005;89(4):201–7. Non-commercial or off-market assay [PubMed: 16262752]
201.
Tokita H , KaufmannGR, MatsubayashiM, OkudaI, TanakaT, HardaH, et al. Hepatitis C virus core mutations reduce the sensitivity of a fluorescence enzyme immunoassay. J Clin Microbiol. 2000;38(9):3450–2. Non-commercial or off-market assay [PMC free article: PMC87404] [PubMed: 10970401]
202.
Tsutsumi M , UrashimaS, TakadaA, DateT, TanakaY. Detection of antigens related to hepatitis C virus RNA encoding the NS5 region in the livers of patients with chronic type C hepatitis. Hepatology. 1994;19(2):265–72. Non-blood specimens [PubMed: 7507461]
203.
Valcavi P , MediciMC, CasulaF, ArcangelettiMC, De ContoF, PinardiF, et al. Evaluation of a total hepatitis C virus (HCV) core antigen assay for the detection of antigenaemia in anti-HCV positive individuals. J Med Virol. 2004;73(3):397–403. Non-commercial or off-market assay [PubMed: 15170635]
204.
Vanhommerig JW , Van De LaarTJW, Van RooijenMS, De VriesHJ, SpeksnijderAGCL, PrinsM, et al. Hepatitis c virus (HCV) core antigen assay for detection of active HCV infection among HIV-infected men who have sex with men attending an STI clinic. J Hepatol. 2014;60(1):S312. Duplicate data
205.
Vargas V , KrawczynskiK, CastellsL, MartinezN, EstebanJ, AllendeH, et al. Recurrent hepatitis C virus infection after liver transplantation: Immunohistochemical assessment of the viral antigen. Liver Transpl Surg. 1998;4(4):320–7. Non-blood specimens [PubMed: 9649647]
206.
Veillon P , PayanC, PicchioG, Maniez-MontreuilM, GuntzP, LunelF. Comparative evaluation of the total hepatitis C virus core antigen, branched-DNA, and amplicor monitor assays in determining viremia for patients with chronic hepatitis C during interferon plus ribavirin combination therapy. J Clin Microbiol. 2003;41(7):3212–20. Non-commercial or off-market assay [PMC free article: PMC165326] [PubMed: 12843066]
207.
Vrielink H , VanderpoelCL, ReesinkHW, LeliePN. Comparison of two anti-hepatitis C virus enzyme-linked immunosorbent assays: Wellcozyme-VK45 and Ortho-2.0. Infusionsther Transfusionsmed. 1995;22(3):164–7. No HCV core antigen performed [PubMed: 7543783]
208.
Vucetic D , TrkuljicM, BalintB, BorovcaninN, LjubenovM, JovicicD. Evaluation of immunoassays for hepatitis C Virus antigen and antibody combined detection in Reactive serum samples among blood donors. Vox Sang. 2009;96:95. Abstract or poster
209.
Waldenström J , KonarJ, EkermoB, NorderH, LaggingM. Neonatal transfusion-transmitted hepatitis C virus infection following a pre-seroconversion window-phase donation in Sweden. Scand J Infect Dis. 2013;45(10):796–9. Less than 10 independent samples [PubMed: 23746339]
210.
Wang C , ZhangL, ShenX. Development of a nucleic acid lateral flow strip for detection of hepatitis C virus (HCV) core antigen. Nucleosides Nucleotides Nucleic Acids. 2013;32(2):59–68. Non-commercial or off-market assay [PubMed: 23448141]
211.
Wang F , WangS, JinL. Detections of hepatitis C virus RNA and NS3 antigen and their relation to liver histopathology. Zhonghua Yi Xue Za Zhi. 1995;75(11):670–2, 709–10. Non-blood specimens [PubMed: 8697087]
212.
Wang FC , ShiZY, CaiJ, SuJ. Evaluation on the use of detection of hepatitis C core antigen for screening blood donor. Zhonghua Shi Yan He Lin Chuang Bing Du Xue Za Zhi. 2007;21(4):389–90. Less than 10 independent samples [PubMed: 18322613]
213.
Watanabe J , MatsumotoC, FujimuraK, ShimadaT, YoshizawaH, OkamotoH, et al. Predictive value of screening tests for persistent hepatitis C virus infection evidenced by viraemia. Japanese experience. Vox Sang. 1993;65(3):199–203. No HCV core antigen performed [PubMed: 7504373]
214.
Widell A , MolnegrenV, PieksmaF, CalmannM, PetersonJ, LeeSR. Detection of hepatitis C core antigen in serum or plasma as a marker of hepatitis C viraemia in the serological window-phase. Transfus Med. 2002;12(2):107–13. Non-commercial or off-market assay [PubMed: 11982963]
215.
Willems M , LerutJ, RoskamsT, DonataccioM, CiccarelliO, HabetsW, et al. Detection of HCV antigen and HCV-RNA in liver biopsies of patients with chronic hepatitis-C undergoing liver-transplantation – a close correlation. Hepatology. 1993;18(4):A262–A. Non-blood specimens
216.
Wong JSJ , KaramalakisD. Evaluation of automated hepatitis C core antigen assay in occupational exposure. Pathology. 2013;45(5):529–31. Editorial or comment [PubMed: 23856850]
217.
Wu RH . [Detection of hepatitis C virus antigen in hemodialysis patients]. Zhonghua Shi Yan He Lin Chuang Bing Du Xue Za Zhi. 2009;23(3):232–4. Review article [PubMed: 20104788]
218.
Xie L , GuangYP, LiuF, ShiHB, YanL, LouJL. A magnetic microparticle-based immunoassay for hepatitis C virus NS3 antigen. Afr J Microbiol Res. 2011;5(1):28–33. Non-commercial or off-market assay
219.
Xie L , HuangDZ, ChenHL, HeLX, WangJ, HanDK. The clinical application and analysis of hepatitis C virus NS 3 antigen detection by ELISA in human serum. Chinese Journal of Microbiology and Immunology. 2009;29(1):88–92. No extractable data, non-response from author [PubMed: 17374280]
220.
Xie L , WuXD, HuangDZ, ChenHL, HeLX, WangJ, et al. Clinical application and analysis of hepatitis C virus NS3 antigen detection by ELISA in human serum. Chin Med J (Engl). Duplciate data2007;120(4):294–9. [PubMed: 17374280]
221.
Yagci S , PadalkoE. Comparison of monolisa HCV Ag/Ab ULTRA with two anti-HCV assays for the detection of HCV infection in hospital setting. Curr Microbiol. 2012;64(2):148–51. Inappropriate reference test [PubMed: 22076114]
222.
Yan F , HaoF, ZhaoL. Study of expression of hepatitis C virus antigens and viral replication in extrahepatic tissues. Zhonghua Gan Zang Bing Za Zhi. 2000;8(1):40–2. Non-blood specimens [PubMed: 10712785]
223.
Yan FM , ChenAS, HaoF, ZhaoXP, GuCH, ZhaoLB, et al. Hepatitis C virus may infect extrahepatic tissues in patients with hepatitis C. World J Gastroenterol. 2000;6(6):805–11. Non-blood specimens [PMC free article: PMC4728266] [PubMed: 11819700]
224.
Yang RF , WeiL. Identifying factors that may influence utility of HCV core antigen assay. Hepatol Int. 2014;8(1):S200. Abstract or poster
225.
Yang Z , QiZB, YuY. Evaluation of A kit for determination of total hepatitis C virus core antigen. Chinese Journal of Biologicals. 2008;21(1):51–3. Non-commercial or off-market assay
226.
Yao RN , ZhangJH, HuangXJ, YangQ, CaoQ, JiangXC. Technique of detection of hepatitis C core antigen used in safety blood transfusion. Zhongguo Shi Yan Xue Ye Xue Za Zhi. 2006;14(3):617–8. Non-commercial or off-market assay [PubMed: 16800955]
227.
Yap SH , WillemsM, Van den OordJ, HabetsW, MiddeldorpJM, HellingsJA, et al. Detection of hepatitis C virus antigen by immuno-histochemical staining: a histological marker of hepatitis C virus infection. J Hepatol. 1994;20(2):275–81. Non-blood specimens [PubMed: 7516360]
228.
Yokosuka O , KawaiS, SuzukiY, FukaiK, ImazekiF, KandaT, et al. Evaluation of clinical usefulness of second-generation HCV core antigen assay: comparison with COBAS AMPLICOR HCV MONITOR assay version 2.0. Liver Int. 2005;25(6):1136–41. Non-commercial or off-market assay [PubMed: 16343063]
229.
You E , LeeW, LeeM, KimM, KangS. Comparison of HCV RNA with the positive pattern of RIBA. J Mol Diagn. 2013;15(6):888. Abstract or poster
230.
Yousaf MZ , IdreesM, SaleemZ, RehmanIU, AliM. Expression of core antigen of HCV genotype 3a and its evaluation as screening agent for HCV infection in Pakistan. Virol J. 2011;8. Noncommercial or off-market assay [PMC free article: PMC3152539] [PubMed: 21787436]
231.
Zhang C , ZhouY, WangC. Detection of hepatitis C virus RNA and C33c antigen in the liver tissue from hepatitis C virus infection patients with chronic liver disease. Zhonghua nei ke za zhi. 1995;34(3):176–9. Non-blood specimens [PubMed: 7648939]
PICO 5b
1.
Bruhn R , LelieN, BuschM, KleinmanS. Relative efficacy of nucleic acid amplification testing and serologic screening in preventing hepatitis C virus transmission risk in seven international regions. Transfusion. 2015;55(6):1195–205. Does not apply to study question [PubMed: 25727549]
2.
Galli C . New strategies for the identification of active hepatitis C virus (HCV) infections. Biochimica Clinica. 2013;37:S137. Abstract or poster
3.
Galli C . New strategies for the screening of hepatitis C virus infection. Vox Sang. 2013;105:181. Abstract or poster
4.
Hosseini-Moghaddam SM , Iran-PourE, RotsteinC, HusainS, LillyL, RennerE, et al. Hepatitis C core Ag and its clinical applicability: potential advantages and disadvantages for diagnosis and follow-up?Rev Med Virol. 2012;22(3):156–65. Review article [PubMed: 22121001]
5.
Kadkhoda K , SmartG. HCV antigen testing for the diagnosis of hepatitis C infection: a cost-efficient algorithm. Clin Lab. 2014;60(4):677–80. Does not apply to study question [PubMed: 24779304]
6.
Marwaha N , SachdevS. Current testing strategies for hepatitis C virus infection in blood donors and the way forward. World J Gastroenterol. 2014;20(11):2948–54. Review article [PMC free article: PMC3961983] [PubMed: 24659885]
7.
Reyes-Mendez MA , Juarez-FigueroaL, Iracheta-HernandezP, Medina-IslasY, Ruiz-GonzalezV. Comparison of two diagnostic algorithms for the identification of patients with HCV viremia using a new HCV antigen test. Ann Hepatol. 2014;13(3):337–42. Does not apply to study question [PubMed: 24756008]
8.
Tagny CT , MbanyaD, MurphyEL, LefrèreJJ, LapercheS. Screening for hepatitis C virus infection in a high prevalence country by an antigen/antibody combination assay versus a rapid test. J Virol Methods. 2014;199:119–23. Inappropriate reference test [PMC free article: PMC5042449] [PubMed: 24487098]
9.
Teo CG . Changing strategies for hepatitis C testing. Antivir Ther2012;17(7):1391–5. Review article [PubMed: 23322655]
10.
Tillmann HL , WiegandJ, GlombI, JelineckA, PicchioG, WedemeyerH, et al. Diagnostic algorithm for chronic hepatitis C virus infection: Role of the new HCV-Core antigen assay. Z Gastroenterol. 2005;43(1):11–6. Does not apply to study question [PubMed: 15650966]
PICO 9
1.
Alsio A , LagenlandN, PedersenC, FarkkilaMA, BuhlM, MorchK, et al. Importance of HCV core antigen below 0.2 PG/ML day 3 in short-term Peg-interferon therapy for chronic genotype2/3 infection. Hepatology. 2010;52:813A. Abstract or poster
2.
Attallah AM , ShihaGE, MalakCAA, HagrasHE, Abdel-RazikWS, IsmailH. Utility of a novel HCV-NS4 antigen detection immunoassay for monitoring treatment of HCV-infected individuals with pegylated interferon alpha-2a. Hepatol Res. 2004;28(2):68–72. Non-commercial or off-market assay
3.
Buti M , MendezC, SchaperM, SauledaS, ValdesA, Rodriguez-FriasF, et al. Hepatitis C virus core antigen as a predictor of non-response in genotype 1 chronic hepatitis C patients treated with peginterferon α-2b plus ribavirin. J Hepatol. 2004;40(3):527–32. Non-commercial or off-market assay [PubMed: 15123370]
4.
Colombatto P , MoriconiF, OliveriF, CavalloneD, CiccorossiP, CocoB, et al. Early HCV core antigen kinetics predict sustained virologic response in chronic hepatitis C patients treated with standard of care. Hepatol Int. 2013;7:S433. Abstract or poster
5.
Feng B , YangR, KongF, ZhangH, RaoH, JinQ, et al. Earlier kinetics of serum HCV core antigen predict sustained virologic response in genotype 1 CHC patients during antiviral treatment. Hepatol Int. 2013;7:S420–1. Abstract or poster
6.
Gonzalez V , PadillaE, DiagoM, GimenezMD, SolaR, MatasL, et al. Clinical usefulness of total hepatitis C virus core antigen quantification to monitor the response to treatment with peginterferon alpha-2a plus ribavirin. J Viral Hepat. 2005;12(5):481–7. Non-commercial or off-market assay [PubMed: 16108762]
7.
Gonzalez V , PlanasR, PadillaE, PerezC, GimenezD, MatasL, et al. Total HCV core antigen correlates with HCV RNA, and predicts sustained virological response (SVR) to peginterferon alfa 2-a (PEG-IFN) and ribavirin (RIB) therapy in chronic hepatitis C (CHC). J Hepatol. 2004;40:142. Abstract or poster
8.
Higashimoto M , TakahashiM, JokyuR, SaitoH. Clinical benefit of HCV core antigen assay in patients receiving interferon and ribavirin combination therapy. Rinsho Byori. 2006;54(2):111–5. No extractable data, non-response from author [PubMed: 16548229]
9.
Higashimoto M , TakahashiM, JokyuR, SyundouH, SaitoH. Improvement of sensitivity in the second generation HCV core antigen assay by a novel concentration method using polyethylene glycol (PEG). Rinsho Byori. 2007;55(11):1008–14. Less than 10 independent samples [PubMed: 18154032]
10.
Kim MN , ParkJY, KimHS, KimDY, AhnSH, HanKH. Benefit of hepatitis C virus core antigen assay in prediction of therapeutic response. Hepatology. 2011;54:845A. Abstract or poster
11.
Lindh M , LaggingM, WestinJ, WejstålR, NorkransG. Monitoring treatment response by the hepatitis C virus core antigen assay. Eur J Clin Microbiol Infect Dis. 2005;24(3):230–2. Noncommercial or off market assay [PubMed: 15772819]
12.
Lunel F , VeillonP. Antigen and viral load. Transfus Clin Biol. 2003;10(2):74–7. Non-commercial or off market assay [PubMed: 12763148]
13.
Maynard M , PradatP, BerthillonP, PicchioG, VoirinN, MartinotM, et al. Clinical relevance of total HCV Core antigen testing for hepatitis C monitoring and for predicting patients” response to therapy. J Viral Hepat. 2003;10(4):318–23. Non-commercial or off-market assay [PubMed: 12823600]
14.
Mederacke I , CiesekS, RaupachR, WursthornK, DeterdingK, SteinmannE, et al. Kinetics of HCV core antigen during antiviral treatment of acute and chronic hepatitis C as determined by a novel chemiluminescent microparticle immunoassay. J Hepatol. 2009;50:S129. Abstract or poster
15.
Nakamuta M , ShimohashiN, TadaS, KinukawaN, EnjojiM, UchimuraK, et al. Serum levels of HCV RNA and core protein before and after incubation at 37°C for 24 h. Hepatol Res. 2001;19(3):254–62. Does not apply to study question [PubMed: 11251308]
16.
Padilla E , PlanasR, GonzalezV, PerezC, GimenezD, MatasL, et al. Total HCV core antigen correlates with HCV RNA, and predicts response to PEGinterferon alfa 2-a (PEG-IFN) and ribavirin (Rib) therapy in chronic hepatitis C. Hepatology. 2003;38(4):626A. Abstract or poster
17.
Pivert A , PayanC, LunelF, Conseil scientifique R. [Comparison of hepatitis C viral RNA and core antigen kinetics in the therapeutic follow up of hepatitis C virus and human immunodeficiency virus co-infected patients, treated by bitherapy interferon-ribavirin, within the framework of RIBAVIC protocol.] Pathologie Biologie (Paris). 2004;52(9):522–8. Duplicate data [PubMed: 15531116]
18.
Pivert A , PayanC, MorandP, Fafi-KremerS, DeshayesJ, CarratF, et al. Comparison of serum hepatitis C virus (HCV) RNA and core antigen levels in patients coinfected with human immunodeficiency virus and HCV and treated with interferon plus ribavirin. J Clin Microbiol. 2006;44(2):417–22. Non-commercial or off-market assay [PMC free article: PMC1392678] [PubMed: 16455894]
19.
Pradat P , MaynardM, BerthillonP, BaillyF, BordesI, TillmannHL, et al. Baseline HCV core antigen/HCV RNA ratio: association with treatment responses. Hepatology. 2004;40(4):326A. Abstract or poster
20.
Pradat P , MaynardM, ButiM, BerthillonP, PicchioG, TillmannHL, et al. The predictive value of core antigen testing for the management of hepatitis C patients receiving pegylated interferon/ribavirin treatment. J Med Virol. 2004;73(3):392–6. Non-commercial or off-market assay [PubMed: 15170634]
21.
Rebucci C , CerinoA, CividiniA, TimoL, FurioneM, MondelliMU. Monitoring response to antiviral therapy for patients with chronic hepatitis C virus infection by a core-antigen assay. J Clin Microbiol. 2003;41(8):3881–4. Less than 10 independent samples [PMC free article: PMC179816] [PubMed: 12904409]
22.
Ricco G , MoriconiF, ColombattoP, OliveriF, CavalloneD, CiccorossiP, et al. Early prediction of sustained virologic response by HCV core ag kinetics in chronic hepatitis c patients treated with peginterferon plus ribavirin. Dig Liver Dis. 2014;46:e46. Abstract or poster
23.
Ross RS , ViazovS, SalloumS, HilgardP, GerkenG, RoggendorfM. Analytical performance characteristics and clinical utility of a novel assay for total hepatitis C virus core antigen quantification. J Clin Microbiol. 2010;48(4):1161–8. No extractable data, non-response from author [PMC free article: PMC2849592] [PubMed: 20107102]
24.
Russi S , SansonnoD, MariggioMA, VinellaA, PavoneF, LaulettaG, et al. Assessment of total hepatitis C virus (HCV) core protein in HCV-related mixed cryoglobulinemia. Arthritis Res Ther. 2014;16(2):R73. Does not apply to study question [PMC free article: PMC4060364] [PubMed: 24636026]
25.
Sasase N , KimSR, KimKI, TaniguchiM, ImotoS, MitaK, et al. Usefulness of a new immunoradiometric assay of HCV core antigen to predict virological response during PEGIFN/RBV combination therapy for chronic hepatitis with high viral load of serum HCV RNA genotype 1b. Intervirology. 2008;51:70–5. Non-commercial or off-market assay [PubMed: 18544951]
26.
Schnuriger A , DominguezS, ValantinMA, TubianaR, DuvivierC, GhosnJ, et al. Early detection of hepatitis C virus infection using a new combined antigen-antibody detection assay: potential use in HIV co-infected individuals. Pathologie Biologie (Paris). 2006;54(10):578–86. Does not apply to study question [PubMed: 17030457]
27.
Shakado S , TanakaT, InomataS, AnanA, MatsumotoT, HananoT, et al. [Serum HCV core antigen level is a useful prediction marker of serum HCV RNA negative at 24-week-treatment with peginterferon and ribavirin in patients with chronic hepatitis C.] [Article in Japanese] Kanzo. 2006;47(8):411–2. Abstract or poster
28.
Shiratori Y , KatoN, YokosukaO, HashimotoE, HayashiN, NakamuraA, et al. Cut-off values of HCV core “antigen” and HCV RNA levels for prediction of viral eradication by interferon treatment. Gastroenterology. 1996;110(4):A1324. Abstract or poster
29.
Soffredini R , RumiMG, ParraviciniML, RonchiG, Del NinnoE, RussoA, et al. Serum levels of hepatitis C virus core antigen as a marker of infection and response to therapy. Am J Gastroenterol. 2004;99(9):1738–43. Non-commercial or off-market assay [PubMed: 15330912]
30.
Takayanagi M , TanakaA, KomuraN, KurodaM, MiyazawaY, KuriharaY, et al. Availability of “high-range” HCV-RNA monitoring and HCV-core antigen quantification for the prediction of the efficacy of IFN and ribavirin combination treatment. Teikyo Medical Journal. 2005;28(3):191–7. Does not apply to study question
31.
Tanaka E , KiyosawaK, MatsumotoA, KashiwakumaT, HasegawaA, MoriH, et al. Serum levels of hepatitis C virus core protein in patients with chronic hepatitis C treated with interferon alfa. Hepatology. 1996;23(6):1330–3. Non-commercial or off-market assay [PubMed: 8675147]
32.
Tanaka E , OhueC, AoyagiK, YamaguchiK, YagiS, KiyosawaK, et al. Evaluation of a new enzyme immunoassay for hepatitis C virus (HCV) core antigen with clinical sensitivity approximating that of genomic amplification of HCV RNA. Hepatology. 2000;32(2):388–93. Non-commercial or off-market assay [PubMed: 10915747]
33.
Tedder RS , TukeP, WallisN, WrightM, NicholsonL, GrantPR. Therapy-induced clearance of HCV core antigen from plasma predicts an end of treatment viral response. J Viral Hepat. 2013;20(1):65–71. No extractable data, author unable to provide further data [PubMed: 23231086]
34.
Tillmann HL . Hepatitis C virus core antigen testing: role in diagnosis, disease monitoring and treatment. World J Gastroenterol. 2014;20(22):6701–6. Review article [PMC free article: PMC4051911] [PubMed: 24944462]
35.
Veillon P , PayanC, PicchioG, Maniez-MontreuilM, GuntzP, LunelF. Comparative evaluation of the total hepatitis C virus core antigen, branched-DNA, and amplicor monitor assays in determining viremia for patients with chronic hepatitis C during interferon plus ribavirin combination therapy. J Clin Microbiol. 2003;41(7):3212–20. Non-commercial or off market assay [PMC free article: PMC165326] [PubMed: 12843066]
36.
Vermehren J , SusserS, BergerA, PernerD, PeifferKH, ZeuzemS, et al. Clinical utility of the architect HCV Ag assay for early treatment response monitoring in patients with chronic Hepatitis C genotype 1 infection. J Hepatol. 2012;56:S461. Does not apply to study question [PubMed: 22698697]
37.
Yang R , RaoH, WeiL. Hepatitis C virus core antigen was correlated with RNA load and had similar dynamics during treatment for chronic hepatitis C. Hepatol Int. 2011;5(1):220. Abstract or poster
38.
Zanetti AR , RomanoL, BrunettoM, ColomboM, BellatiG, TackneyC. Total HCV core antigen assay: a new marker of hepatitis C viremia for monitoring the progress of therapy. J Med Virol. 2003;70(1):27–30. Non-commercial or off-market assay [PubMed: 12629640]
39.
Zhang YZ , WuWJ, JinH, LiuYY, HuYW, ZhangYX. Clinical relevance of serum HCV core antigen level and antiviral therapy response. Int J Infect Dis. 2010;14:S68. Abstract or poster

Annex 5.9.1. PICO 7 - Dried blood spots
Dried blood spots as a sample collection method for hepatitis B surface antigen serological testing

Authors

; Team lead: , , , , and .1

Affiliations

1 Médecins Sans Frontières, Geneva, Switzerland

A systematic review and meta-analysis

1. Abstract

Introduction: Several expert organizations recommend screening of individuals living in high or even intermediate prevalence of hepatitis B. Despite this, few countries have or implement such screening recommendations. In high-prevalence low- and middle-income countries, there is a need for improved HBV screening, especially in decentralized settings. The use of dried blood spots (DBS) sent to centralized lab facilities may be useful in certain contexts. A systematic review and meta-analysis were performed to address the question: Among persons identified for hepatitis B testing, what is the diagnostic accuracy and impact of detecting HBsAg from DBS samples versus venous sample?

Methods: Following an a priori protocol, PubMed, MEDLINE, WHO Global Index Medicus, Web of Science, MSF, Cochrane, EMBASE, CABS Abstracts and LILACS databases were searched by two reviewers in duplicate. Data were extracted with the primary outcome of HBsAg DBS test accuracy using the gold standard of a venous sample. For analysis of sensitivity and specificity, a bivariate analysis using a maximum likelihood estimate and 95% confidence intervals was used. Likelihood ratios were calculated directly from the pooled sensitivity and specificity. QUADAS-2 was used to assess bias and a GRADE evaluation was performed to evaluate the quality of included studies.

Results: Two hundred forty studies were obtained for consideration, of which 10 met the criteria for inclusion in the review and 9 provided sufficient data for inclusion in the meta-analysis. The meta-analysis revealed a sensitivity of 92.9% (upper bound–lower bound 86.2–96.5) and specificity of 99.0% (upper bound–lower bound 96.2–99.7). From the pooled sensitivity and specificity, the positive likelihood ratio is 92.9 and the negative likelihood ratio is 0.072. As heterogeneity was identified on the forest plots, stratified analyses were done by storage temperature and test cut-off values. The analysis stratified by storage temperature revealed a sensitivity of 78.7% (upper bound–lower bound 70.3–85.2) and 96.1% (upper bound–lower bound 91.9–98.2) for cold chain versus ambient temperature or higher, and a specificity of 98.6% (upper bound–lower bound 68.0–100) and 99.7% (upper bound–lower bound 98.3–100) for cold chain versus ambient temperature or higher. The analysis stratified by test cut-off revealed a sensitivity of 88.0% (upper bound–lower bound 74.0–95.0) and 95.6% (upper bound–lower bound 91.2–97.8) for standard and lowered cut-off, respectively, and a specificity of 98.6% (upper bound– lower bound 89.5–99.8) and 99.1% (upper bound–lower bound 96.6–99.8), respectively. The assessment for risk of bias revealed some risk due to patient selection and interpretation of index test. The GRADE analysis showed the included studies to provide evidence of moderate quality to assess sensitivity and specificity.

Discussion: This review includes evidence of moderate quality that supports acceptable accuracy of DBS for testing HBSAg as compared to use of plasma samples and suggests that DBS may be used where there is limited access to venepuncture or inadequate technology to prepare and transport plasma samples. It is important to note that use of DBS may require changing cut-offs to determine test positivity. As there are relatively little data on accuracy of DBS in real-life conditions (including high humidity), operational research will be needed in real-life conditions.

2. Introduction

According to the World Health Organization’s latest data, an estimated 240 million people are chronically infected with the hepatitis B virus (HBV) and more than 780 000 people die every year due to complications of hepatitis B.1 In 20–30% of chronically infected individuals, hepatitis B progresses to liver cancer and/or cirrhosis.2 For some individuals, acute hepatitis shortly after infection can cause fatal liver failure. Hepatitis B disproportionately affects populations in low- and middle-income countries: adult chronic infection prevalence in sub-Saharan Africa and East Asia is 5–10% (similar high rates affect populations in the Amazon and south-east and south-central Europe), and of 2–5% in the Middle East and India.3

Several organizations such as the US Centers for Disease Control and Prevention (CDC), the European Association for the Study of the Liver (EASL) and the American Association for the Study of Liver Diseases (AASLD) recommend screening of individuals living in high or even intermediate prevalence. Despite this, few countries have or implement such screening recommendations and a very large number of individuals living with HBV are not diagnosed. In high-prevalence low- and middle-income countries, there is a need for improved HBV screening, especially in decentralized settings. While commercial rapid tests exist, the use of dried blood spots (DBS) sent to centralized lab facilities may be useful in certain contexts.

There are a number of HBsAg serological tests used, including rapid diagnostic tests (RDTs) and enzyme immunoassays (EIAs). Among RDTs, there are numerous options, such as the Determine HBsAg RDT. A recent meta-analysis of accuracy of hepatitis B RDTs demonstrated that the pooled sensitivity was 94.76% (95% credible interval [CrI] 90.08–98.23%) and specificity was 99.54% (95% CrI 99.03–99.95%).4

Use of DBS

Hepatitis B surface antigen (HBsAg) is the screening test for HBV. Use of DBS for HBV screening may simplify sample collection and preparation (e.g. through collection of finger-prick blood samples) and improve the ability to store and transport samples for testing.5,6 Starting with the sample collection method, blood can easily be collected from pricking a finger or a heel, thus reducing the need for more highly-trained health-care workers. For DBS, less blood volume is required than in conventional venepuncture, and sample preparation is simple (it does not require electrical power, or a centrifuge), and inexpensive. Furthermore, once collected, the handling of the samples is rendered more easy: samples are less cumbersome, and can be transported in little space and at room temperature thus reducing or eliminating need for cold chain. Finally, individuals conducting the tests on the samples have a reduced risk of contamination once the blood has dried. This technique has already had success in diagnosing other infections such as HIV and is being developed for screening of other diseases such as hepatitis C.7 It has also been used since decades for the mass screening of congenital disorders and neonatal diseases, such as hypothyroidism and phenylketonuria (Guthrie test).

In March 2015, WHO published the first guidelines for the prevention, care, and treatment of individuals with chronic HBV infection. These guidelines focused on assessment for treatment eligibility, initiation of first-line therapies, switching, and monitoring, and did not include screening recommendations. WHO is now undertaking guidelines for testing for chronic hepatitis B and C infection in low- and middle-income settings. A topic for consideration in these guidelines is the potential use of DBS for serological and molecular testing for HBV and HCV to facilitate access to and uptake of testing.

In order to better evaluate the sensitivity and specificity of DBS for testing for HBsAg, the following PICOT question was developed for HBsAg. Among persons identified for hepatitis B testing, what is the diagnostic accuracy and impact of detecting HBsAg from DBS samples versus venous sample?

  • Population: Samples for serology (HBsAg) for HBV
  • Intervention: Using DBS samples
  • Comparisons: Using plasma or serum from venous samples
  • Outcomes: Diagnostic accuracy (Sensitivity, Specificity, Positive likelihood ratio, Negative likelihood ratio, TN, TP, FN, and FP)

3. Methods

A protocol was prepared for the literature search, article selection, data extraction and assessment of methodological quality.

a. Search strategy and selection criteria

Types of studies

Case–control, cohort, and cross-sectional and randomized trials were included and articles were selected that compared DBS HBsAg testing against the gold standard of HBsAg testing using serum, and reported specificity and sensitivity or sufficient data to calculate sensitivity and specificity.

Participants

No date, geographical or population demographic exclusions were used. Patients of all age groups were included.

Target conditions

For use in screening for or diagnosing hepatitis B

Reference standard

Testing for HBsAg in serum using any commercially available test

Outcome measures

Sensitivity refers to the proportion of samples with true HBV infection diagnosed with a positive HBsAg test using DBS confirmed with a positive HBsAg in serum.

Specificity refers to the proportion of samples with negative HBsAg using DBS and no evidence of HBV infection confirmed with a negative HBsAg in serum.

Search methods

We searched English language manuscripts from PubMed, MEDLINE, WHO Global Index Medicus, Web of Science, MSF, Cochrane, EMBASE, CABS Abstracts and LILACS databases using the search terms contained in Annex 1. The search was conducted between April and June 2015.

Title, abstract and full-text review was done in duplicate using pre-defined eligibility criteria with a third reviewer serving as a tie-breaker for inclusion disagreements. The reference lists for articles selected for inclusion were also reviewed for additional manuscripts to review. Additional data and clarifications were sought by contacting study authors. Two articles were excluded because of inability to locate the full text of these articles.

b. Data extraction

All the studies were subject to the same data extraction procedure and form based on the following parameters: author, publication and study dates, country and their World Bank economic category (high, middle/low income, or both high and middle/low income), percentage of HIV-positive participants, percentage of children and adults, age range, gender distribution, study design, participant selection, direction of study (prospective vs retrospective), type of specimen used for DBS, specimen used as gold standard (plasma or serum), test used, and whether or not the tests were administered following the recommendations from the manufacturer. Two reviewers independently extracted data. Studies without extractable sensitivity or specificity data were excluded from the meta-analysis.

c. Statistical data analysis

Statistical analysis of the data was performed using OpenMeta [Analyst]. For analysis of sensitivity and specificity, a bivariate analysis using maximum likelihood estimate and 95% confidence intervals was used. Likelihood ratios were calculated directly from the pooled sensitivity and specificity. We used forest plots to visually assess heterogeneity. Stratified analysis was performed by studies that used the standard manufacturer-recommended cut-off value and those that used a lower cut-off, and by studies that stored DBS in the cold chain (refrigerated or frozen) and those that stored the DBS samples at ambient temperatures or higher.

d. Risk of bias and quality assessment

The QUADAS-2 tool was used to assess risk of bias. A GRADE assessment performed by two reviewers in parallel to assess the quality of included studies.

4. Results

a. Summary of included studies

A search yielded 240 studies for consideration of which 10817 met the criteria for inclusion in the review (Fig. 1 and Table 1) and 9 provided sufficient data for inclusion in the meta-analysis.811,13,14,16,17 The studies provided 370 positive samples among 1516 total samples. Four studies were from high-income countries,10,1416 four from middle-income countries8,9,12,17 and two from low-income countries.11,13 Five studies drew samples from broad populations, including pregnant women,8,9,1315 two from inpatient populations,10,12 two from attendees at liver clinics16,17 and one from attendees of an HIV testing centre.11 Storage conditions including time and temperature varied among the studies, with 3 studies keeping samples in refrigerated or frozen storage,8,9,12 six studies with some or all samples at ambient temperature or higher10,11,13,14,16,17 and one not specified.15 Finally, some studies lowered the test cut-off value for DBS samples while others used the manufacturer-recommended cut-off level.

b. Diagnostic performance

In general, testing for HBsAg using DBS maintained good accuracy as compared with the reference test using plasma or serum. The meta-analysis revealed a sensitivity of 92.9% (upper bound–lower bound 86.2–96.5) and specificity of 99.0% (upper bound–lower bound 96.2–99.7) (Table 4 and Figs 2 and 3). From the pooled sensitivity and specificity, the positive likelihood ratio is 92.9 and the negative likelihood ratio is 0.072.

c. Impact of storage conditions

A range of storage conditions were evaluated in the included papers, including storage temperature ranging from –20 to 33°C and storage time ranging from overnight to 180 days. In general, storage at room temperature or higher (30–33°C) did not affect accuracy of testing as compared to storage in the cold chain. However, the two studies that evaluated storage at room temperature or higher with prolonged storage time did note a decrease in sensitivity when samples were stored for >15 days at room temperature16 or a decrease in sensitivity and specificity for samples stored at room temperature for more than 63 days.17 A stratified analysis of studies that stored samples in the cold chain (refrigerated at 2–8°C or frozen)8,9 versus those that stored samples at ambient temperature or above (30–33°C)11,13,14 was performed for 5 studies (2 cold chain and 3 ambient temperature or higher). Other studies were excluded as they examined DBS samples in a range of temperature conditions, but did not provide sufficient information to determine sensitivity or specificity at a given temperature. The analysis revealed a sensitivity of 78.7% (upper bound–lower bound 70.3–85.2) and 96.1% (upper bound–lower bound 91.9–98.2) for cold chain versus ambient temperature or higher and a specificity of 98.6% (upper bound–lower bound 68.0–100) and 99.7% (upper bound–lower bound 98.3–100) for cold chain versus ambient temperature or higher (Figs 4 and 5).

d. Impact of cut-off

Several papers noted that the ideal cut-off (e.g. as suggested by receiver operating characteristic [ROC] curves) for determining test positivity should be lower for DBS samples as compared to plasma or serum samples (Table 1).1112,15 Authors postulated this was due to the small blood volume used in DBS (commonly 50 µL for a circle of 12 mm diameter). Stratified analysis by cut-off value (standard versus raised) revealed a sensitivity of 88.0% (upper bound–lower bound 74.0–95.0) and 95.6% (upper bound–lower bound 91.2–97.8) for standard8,9,13,16 and lower cut-off,10,11,14,17 respectively, and a specificity of 98.6% (upper bound–lower bound 89.5–99.8) and 99.1% (upper bound–lower bound 96.6–99.8), respectively (Figs 6 and 7).

e. Assessment of bias and quality assessment

The assessment for risk of bias revealed that several studies did not use a random or consecutive sampling method or used a study population that is not consistent with the target screening population.8,13,14,16,17 As there are no current standards for test cut-offs for HBsAg using DBS, several studies used results of ROC curves to change the cut-off used for the DBS samples, adjusting the cut-off downward to achieve better sensitivity.1012,14,15,17 This adjustment may introduce bias and thus, these studies were judged to have a high risk of bias on the index test domain. The included studies had a low risk of bias on the reference test and flow and timing domains (Table 2). The GRADE analysis showed the included studies to provide evidence of moderate quality to assess sensitivity and specificity (Table 3).

5. Discussion

Overall conclusions

This systematic review and meta-analysis includes evidence of moderate quality that supports acceptable accuracy of DBS for testing HBsAg as compared to use of plasma samples, and suggests that DBS may be used for screening for HBV using HBsAg DBS where there is limited access to venepuncture or inadequate technology to prepare and transport plasma samples. Although studies are limited, DBS is likely stable and maintains good accuracy in conditions with higher temperatures and with higher humidity, although accuracy may be negatively affected when storing for prolonged durations (>14 days) at higher temperatures (room temperature and above). In a stratified analysis that examined studies that stored samples in a cold chain versus those that stored samples at ambient or higher temperatures did not reveal a detriment in accuracy for DBS stored at ambient or higher temperatures. As there are relatively little data on accuracy of DBS in real-life conditions (including high humidity), operational research will be needed in real-life conditions.

It is important to note that use of DBS may require changing cut-offs to determine test positivity. As DBS uses a small sample of blood, in order to maintain sensitivity, a lower cut-off may be required as compared to when using plasma samples. In the stratified analysis performed examining standard or lower cut-off values, DBS that used a lower-cut off had a higher sensitivity than those that used the manufacturer-recommended cut-off without sacrificing significant specificity. Each individual test kit needs to be evaluated separately for its own ideal cut-off for DBS based on a ROC curve. This will usually differ from the serum test cut-off and usually be a lower cut-off to increase sensitivity. It will be important to validate use of DBS with commercially available HBsAg tests and determine cut-off values.

Key limitations

This review also has a number of limitations. Overall, the number of studies was small. In particular, there is a dearth of studies that systematically examine the effects of storage conditions on the accuracy of DBS and of those that did assess this, several did not specify the exact conditions (e.g. exactly what is room temperature). Thus, should DBS be adopted for screening for HBV, it will be important to pursue further operational research using field specimens in prepared and stored in real-life conditions. Ideally, to fit operational needs, these studies should use capillary whole blood to prepare the DBS, use a commonly available type of filter paper while comparing several commercial test kits and conditions of storage.

Future work

Expanded use of HBsAg testing will be critical to improving the diagnosis and treatment of HBV globally. While commercial HBsAg rapid diagnostic tests may be useful in certain contexts, the ability to use DBS for improved preparation, storage and transport of samples for decentralized testing may help to expand the reach of this important diagnostic test.

Fig. 1. Study flow diagram.

Fig. 1Study flow diagram

Table 1Study-level characteristics of included studies

AuthorCountry and income categoryStudy designStudy popSample sizeStorage conditionsReference testSample for DBSFilter paperSpecificitySensitivityCut-off valueEffect of storage conditions
Boa-Sorte
2014
Brazil

Upper–middle income
Cross-sectionalPregnant women692Temperature: refrigerated

Time: less than 5 days
IMUNOSCREENHBSAG–SS (Mbiolog Diag.) and Murex HBsAg (MurexBioTechUnlmtd)VenousSchleicher and Schuell 903100100Unchanged
Forbi
2010
Nigeria

Lower–middle income
Cross-sectionalBroad300Temperature: 4 °C

Time: overnight
Shantest TM-HBsAg ELISAVenousWhatman no. 388.678.6Unchanged
Gruner
2015
Germany

High income
Cross-sectionalInpatients299Temperature: 20 °C, 4 °C or ambient temperature

Time: up to 14 days
HBsAg assay ARCHITECHT system (Abbott Diagnostics)Venous or capillaryPerkinElmer 226 and Whatman no. 399.891.70.15 IU/mL
Kania
2013
Burkina-Faso

Low income
Cross-sectionalAttendees of HIV testing centre218Temperature: ambient temperature

Time: not specified
ETI-MAK-4 HBsAg EIA (DiaSorin S.p.A.)VenousWhatman 90310096Optical density: MAPC (mean absorbance of positive control)/2 + 0.3 standard deviations=0.825.
Lee
2011
Malaysia

Upper middle income
Cross-sectionalPatients at a tertiary hospital150Temperature: 20 °C

Time: not specified
Abbott, kit not specified (Abbott Laboratories)VenousWhatman 90397.896.5Cut-off point of 1.72 Relative light units
Mendy
2005
The Gambia

Low income
CohortBroad166Temperature: 30−33 °C (humid conditions)

Time: up to 4 weeks
Determine HBsAg (Abbott Laboratories)VenousWhatman, grade BFC 18010096Unchanged
Mohamed
2013
France

High income
CohortBroad200Temperature: Room temperature

Time: 1, 3, 7 and 14
days
Abbott ARCHITECT HBsAg assay (Abbott Laboratories)VenousWhatman FTA DMPK-C100980.30 +/-0.81 IU/mLNo significant change
Ross
2013
Germany

High income
Cross-sectionalBroad299Time and temperature not specifiedAbbott ARCHITECT HBsAg (Abbott Laboratories)VenousNot specified10098.615 IU/mL (HBsAg)
Villa
1981
Italy

High income
Cross-sectionalPatients attending liver clinic24Temperature: −20 °C, 4 °C and room temperature.

Time: 1,7, 15, 30, 60, and 180 days
Ausria II, RIA kit (Abbott Laboratories)CapillaryNot specified100100UnchangedTemperature: storage at room temperature resulted in no significant change compared to samples stored at 4 °C or −20 °C

Time: storage longer than 15 days negatively affected sensitivity.
Villar
2011
Brazil

Upper middle income
Cross sectionalPatients attending hepatitis clinic133Temperature: −20 °C, 4−8 °C, 22−25 °C

Time: 1, 7, 14, 21, 42, 63, 112, and 183 days
ETI-MAK-4 HBsAg (Diasorin)Venous or capillaryWhatman 90396.797.62Absorbance value 0.115Accuracy of DBS samples was stable over 63 days at all temperatures evaluated but after 63 days, accuracy diminished when stored at 22−25 °C

Table 2QUADAS-2 risk of bias assessment

AuthorPatient selectionIndex testReference standardFlow and timing
Boa-SorteLRLRLRLR
ForbiLRLRLRLR
GrunerLRHRURUR
KaniaLRHRLRLR
LeeLRHRLRLR
MendyHRLRLRLR
MohamedHRHRLRLR
RossLRHRLRLR
VillaHRLRLRLR
VillarHRHRLRLR

HR: high risk of bias; UR: unknown risk of bias; LR: low risk of bias

Table 3GRADE table

Number of studiesType of studyDirectnessPrecisionConsistencyRisk of biasOverall quality
Sensitivity 92.9% (95% CI 86.2−96.5)
10 studies

(370 HBsAg positive among 1516 samples)
Cross-sectional or cohortNo significant indirectnessNo significant imprecisionSignificant inconsistency
(one paper reported lower sensitivity)
Significant risk of bias (patient enrolment not consecutive or random in some studies; pre-specified cut-off not used in some studies)Moderate
Specificity 99.0% (95% CI 97.6−100%)
10 studies

(370 HBsAg positive among 1516 samples)
Cross-sectional or cohortNo significant indirectnessNo significant imprecisionNo significant inconsistencySignificant risk of bias (patient enrolment not consecutive or random in some studies; pre-specified cut-off not used in some studies)Moderate

Table 4Meta-analysis: sensitivity and specificity

EstimateUpper bound–lower bound
Sensitivity92.986.2−96.5
Specificity99.096.2−99.7
Fig. 2. Forest plot sensitivity.

Fig. 2Forest plot sensitivity

Fig. 3. Forest plot specificity.

Fig. 3Forest plot specificity

Fig. 4. Forest plot, sensitivity at differing storage temperatures.

Fig. 4Forest plot, sensitivity at differing storage temperatures

Fig. 5. Forest plot, specificity at differing storage temperatures.

Fig. 5Forest plot, specificity at differing storage temperatures

Fig. 6. Forest plot sensitivity, standard and lowered cut-off.

Fig. 6Forest plot sensitivity, standard and lowered cut-off

Fig. 7. Forest plot specificity, standard and lowered cut-off.

Fig. 7Forest plot specificity, standard and lowered cut-off

References

1.
World Health Organization. Hepatitis B factsheet 204. (http://www​.who.int/mediacentre​/factsheets/fs204/en/, accessed on 2 July 2015).
2.
Ganem D , PrinceAM. Hepatitis B virus infection – natural history and clinical consequences. N Engl J Med. 2004;350(11):1118–29. [PubMed: 15014185]
3.
Ott JJ , StevensGA, GroegerJ, WiersmaST. Global epidemiology of hepatitis B virus infection: new estimates of age-specific HBsAg seroprevalence and endemicity. Vaccine. 2012;30(12):2212–9. [PubMed: 22273662]
4.
Shivkumar S , PeelingR, JafariY, JosephY, PaiP. Rapid point-of-care first-line screening tests for hepatitis B infection: a meta-analysis of diagnostic accuracy (1980–2010). Am J Gastroenterol. 2012;107:1306–13. [PubMed: 22641308]
5.
Solmone M , GirardiE, CostaF, PucilloL, IppolitoG, CapobianchiMR. Simple and reliable method for detection and genotyping of hepatitis C virus RNA in dried blood spots stored at room temperature. J Clin Microbiol. 2002;40(9): 3512. [PMC free article: PMC130818] [PubMed: 12202607]
6.
McDade TW , WilliamsS, SnodgrassJJ. What a drop can do: dried blood spots as a minimally invasive method for integrating biomarkers into population-based research. Demography. 2007;44:899–925. [PubMed: 18232218]
7.
Sherman G , StevensG, JonesSA, HorsfieldP, StevensWS. Dried blood spots improve access to HIV diagnosis and care for infants in low-resource settings. J AIDS. 2005;38(5):615–17. [PubMed: 15793374]
8.
Boa-Sorte N , PurificacaoA, AmorimT, AssuncaoL, ReisA, Galvao-CastroB. Dried blood spot testing for the antenatal screening of HTLV, HIV, syphilis, toxoplasmosis and hepatitis B and C: prevalence, accuracy and operational aspects. Braz J Infect Dis. 2014;18(6):618–24 [PMC free article: PMC9425210] [PubMed: 25022566]
9.
Forbi JC , ObaguJO, GyarSD, PamCR, PennapGR, AgwaleSM. Application of dried blood spot in the sero-diagnosis of hepatitis B infection (HBV) in an HBV hyper-endemic nation. Ann Afr Med. 2010;9:44–5. [PubMed: 20418650]
10.
Grüner N , StambouliO, RossRS. Dried blood spots – preparing and processing for use in immunoassays and in molecular techniques. J Vis Exp. 2015;97:e52619. doi:10.3791/52619(2015). [PMC free article: PMC4397000] [PubMed: 25867233] [CrossRef]
11.
Kania D , BekaleAM, NagotN, MondainAM, OttomaniL, MedaN, et al. Combining rapid diagnostic tests and dried blood spot assays for point-of-care testing of human immunodeficiency virus, hepatitis B and hepatitis C infections in Burkina Faso, West Africa. Clin Microbiol Infect. 2013;19:E533–E541. [PubMed: 23902574]
12.
Lee CE , Sri PonnampalavanarS, Syed OmarSF, MahadevaS, OngLY, KamarulzamanA. Evaluation of the dried blood spot (DBS) collection method as a tool for detection of HIV Ag/Ab, HBsAg, anti-HBs and anti-HCV in a Malaysian tertiary referral hospital. Ann Acad Med Singapore. 2011;40:448–53. [PubMed: 22206053]
13.
Mendy M , KirkGD, van der SandeM, Jeng-BarryA, LesiOA, HainautP, et al. Hepatitis B surface antigenaemia and alpha-foetoprotein detection from dried blood spots: applications to field-based studies and to clinical care in hepatitis B virus endemic areas. J Viral Hepat. 2005;12:642–7. [PubMed: 16255766]
14.
Mohamed S , RaimondoA, Pe´narandaG, CamusC, OuzanD, RavetS, et al. Dried blood spot sampling for hepatitis B virus serology and molecular testing. PLoS One. 2013;8(4): e61077. doi:10.1371/journal.pone.0061077. [PMC free article: PMC3628702] [PubMed: 23613788] [CrossRef]
15.
Ross RS , StambouliO, GrunerN, MarcusU, CaiW, ZhangW, et al. Detection of infections with hepatitis B virus, hepatitis C virus, and human immunodeficiency virus by analyses of dried blood spots – performance characteristics of the ARCHITECT system and two commercial assays for nucleic acid amplification. Virol J. 2013;10:72. [PMC free article: PMC3599381] [PubMed: 23497102]
16.
Villa E , CartolariM, BellentaniS, RivasiP, CasoloG, ManentiF. Hepatitis B virus markers on dried blood spots. A new tool for epidemiological research. J Clin Pathol. 1981Jul; 34(7): 809–812. [PMC free article: PMC493829] [PubMed: 7263909]
17.
Villar LM , de OliveiraJC, CruzHM, YoshidaCF, LampeE, Lewis-XimenezLL. Assessment of dried blood spot samples as a simple method for detection of hepatitis B virus markers. J Med Virol. 2011;83:1522–9. [PubMed: 21739441]

Appendix 1. Search strategies

Pubmed

((“Hepatitis B” [Mesh] OR “Hepatitis B virus” [Mesh] OR “hepatitis B” OR “hepatitis B virus” OR “HBV”) OR (“Hepatitis B Antigens” [Mesh] OR “Hepatitis B Surface Antigens” [MESH] OR hepatitis b antigen* OR hepatitis b virus antigen* OR hepatitis b surface antigen* OR “HBsAg” OR “hbv sag” OR “hb sag” OR “HBsAg”) AND (“Dried Blood Spot Testing”[Mesh] OR “dried blood spot testing” OR dried blood spot* OR dried plasma spot* OR “DBS” OR “dried blood” OR “dried plasma”))

Embase

  1. ‘hepatitis b’/exp OR ‘hepatitis b antigen’/exp OR ‘hepatitis b surface antigen’/exp OR ‘hepatitis b virus’/exp
  2. ‘hepatitis b’ OR ‘hepatitis b virus’ OR ‘hepatitis b surface antigen’ OR ‘hepatitis b antigen’ OR ‘hbv’ OR ‘HBsAg’ OR ‘hepatitis b sag’ OR ‘hbv sag’ OR ‘hbsag’ OR ‘hb sag’
  3. ‘dried blood spot testing’/exp OR ‘dried blood spot testing’ OR ‘dried blood spot’ OR ‘dried blood’ OR ‘dried plasma spot testing’ OR ‘dried plasma spot’ OR ‘dried plasma’ OR ‘dbs’
  4. #1 OR #2
  5. #3 AND #4

Web of Knowledge (SCI-expanded, SSCI, Conference Proceedings science, BIOSIS previews)

  1. TOPIC: (hepatitis b) ORTOPIC: (hepatitis b surface antigen) ORTOPIC: (hepatitis b antigen) ORTOPIC: (hepatitis b virus) ORTOPIC: (hbv) ORTOPIC: (HBsAg) ORTOPIC: (hbv sag) ORTOPIC: (hbsag) ORTOPIC: (hb sag)
    Indexes = SCI-EXPANDED, SSCI, A&HCI Timespan=All years
  2. ((((((TOPIC: (dried blood spot testing) ORTOPIC: (dried blood spot)) ORTOPIC: (dried blood)) ORTOPIC: (dried plasma spot testing)) ORTOPIC: (dried plasma spot)) ORTOPIC: (dried plasma)) ORTOPIC: (dbs))
    Indexes = SCI-EXPANDED, SSCI, A&HCI Timespan=All years
  3. #2 AND #1
    Indexes = SCI-EXPANDED, SSCI, A&HCI Timespan=All years

Cochrane

  1. MeSH descriptor: [Hepatitis B] explode all trees
  2. MeSH descriptor: [Hepatitis B Antigens] explode all trees
  3. MeSH descriptor: [Hepatitis B Surface Antigens] explode all trees
  4. MeSH descriptor: [Hepatitis B virus] explode all trees
  5. hbv or hepatitis b or hepatitis b virus or hepatitis b antigen or hepatitis b surface antigen or HBsAg or hbv sag or hbsag or hb sag
  6. MeSH descriptor: [Dried Blood Spot Testing] explode all trees
  7. dried blood spot testing or dried blood spot or dried blood or dried plasma spot testing or dried plasma spot or dried plasma or dbs
  8. #1 or #2 or #3 or #4 or #5
  9. #6 or #7
  10. #8 and #9

Medline (OVID)

  1. exp Hepatitis B/ or exp Hepatitis B virus/ or hepatitis B.mp. or hepatitis b virus.mp. or hbv.mp.
  2. exp Hepatitis B Antigens/ or exp Hepatitis B Surface Antigens/ or hepatitis b antigen*.mp. or hepatitis b virus antigen*.mp. or hepatitis b surface antigen*.mp. or hbsag.mp. or hbv sag.mp. or HBsAg.mp. or hb sag.mp.
  3. exp Dried Blood Spot Testing/ or dried blood spot testing.mp. or dried blood spot*.mp. or dried plasma spot*.mp. or dbs.mp. or dried blood.mp. or dried plasma.mp.
  4. 1 or 2
  5. 3 and 4

Annex 5.9.2. PICO 7 - Dried blood spots
Dried blood spots as sample collection method for HCV antibody: a systematic review and meta-analysis

Authors

Team lead: , , , , , , , and .

Affiliations

1 Médecins Sans Frontières, Geneva, Switzerland

1. Executive summary

Introduction: Dried blood spots are a convenient diagnostic for viral diseases due to transport and logistical advantages over venous blood sampling. Their diagnostic accuracy for the detection of HCV antibody is not known.

Methods: We conducted a systematic review and meta-analysis on the diagnostic accuracy of HCV antibody from DBS samples compared to venous samples in those persons identified for HCV testing. MEDLINE, EMBASE, Global Health and Cochrane library were searched with a sensitive search strategy and data was extracted based on a predefined extraction scheme. We described ranges of diagnostic accuracy outcomes as well as agreement of DBS against venous blood samples. For pooled analysis of sensitivity and specificity, a bivariate analysis using maximum likelihood estimate and 95% confidence interval was used and heterogeneity of results was assessed. PRISMA guideline was followed and the QUADAS tool was used to assess for risk of bias.

Results: Eighteen studies of 485 abstracts were included in the qualitative review; 14 of those contributed to the quantitative analysis. Overall quality of studies was moderate. A pooled bivariate analysis of sensitivity and specificity revealed an overall sensitivity of 98% (CI 95% 94–99) and an overall specificity of 99% (CI 95% 97–100). Positive likelihood ratio was 171 and negative likelihood ratio 0.02. Heterogeneity was moderate with a tau2 of 0.1. In a separate univariate analysis, storage conditions did not explain heterogeneity of sensitivity or specificity, with all samples contributing to the quantitative analysis stored less than 24 hours at room temperature. However, two studies reported on false positive samples when DBS samples were stored at room temperature for longer than 3 days. Many different tests and cut-offs were used, so no stratified analysis on type of test or cut-off was performed.

Discussion: This systematic review of diagnostic accuracy of HCV antibody in DBS compared to venous blood shows good diagnostic accuracy with a body of evidence of moderate quality. Manufacturers should validate their tests for the use of DBS and include instructions for this in their manuals. Future studies on diagnostic accuracy should focus on storage conditions common to field situations to be able to assess pragmatic use of this sample method.

2. Introduction

i. Epidemiology

More than 150 million people are infected with hepatitis C (HCV) worldwide but only a proportion of these are aware of their infection.1 Diagnosing HCV is done via serology by detecting antibodies to the core and non-structural antigens. Many guidelines from high-income settings recommend screening major high-risk groups including injecting drug users and persons living in high-prevalence settings.1

ii. Approach to HCV antibody testing

HCV testing is traditionally done by serology using enzyme-linked immunosorbent assay (ELISA) and many validated commercially available tests exist for this, two of which are WHO prequalified. Confirmation of active infection is gained by doing a polymerase chain reaction (PCR) of HCV RNA, as 15–45% spontaneously clear the virus. A previous WHO guideline based on a systematic review performed found low-quality evidence that confirmation of chronic infections should directly follow and not be delayed.1

iii. Use of dried blood spot sampling

Dried blood spots (DBS) are another way of obtaining blood samples, not requiring patients to undergo venous blood sampling if sourced from capillary blood. Storage and transportation are easier and risk of biohazard during transportation is reduced.2 That is why DBS has been used increasingly in recent years to diagnose viral diseases, including HIV and viral hepatitis.3 Disadvantages of using DBS include the fact that the commercial assays existing are not validated or regulatory approved for this method. The actual work in the laboratory is also more laborious (in terms of manual sample processing) than using serum samples.4

Some studies show the use of DBS increases uptake of hepatitis testing among several vulnerable risk groups,57 while others were not able to confirm this.8 The advantages of transport and storage make DBS a good choice for diagnosis of HCV in low-resource settings.3 Several programmes and studies have used DBS for HCV antibody screening without validation,911 and several recent studies have attempted to validate the use of DBS in diagnostic accuracy studies.12,13 Recent systematic reviews have been published on HCV RNA detection with DBS,14 on the uptake of interventions for HCV screening15 and the use of point-of-care tests in viral hepatitis testing.16 However, to our knowledge no attempt has been made to summarize the evidence on diagnostic accuracy for HCV antibody testing on DBS.

iv. Systematic review as preparation for a new WHO guideline

In March 2015, WHO published the first guidelines for the prevention, care and treatment of individuals with chronic HBV infection. These guidelines focused on assessment for treatment eligibility, initiation of first-line therapies, switching and monitoring. They did not include screening recommendations. WHO is now undertaking guidelines for testing for chronic hepatitis B and C infection in low- and middle-income settings. A topic for consideration in these guidelines is the potential use of DBS for serological and molecular testing for HBV and HCV to facilitate access to and uptake of testing.

We conducted a systematic review and meta-analysis on the diagnostic accuracy of HCV antibody from DBS samples compared to venous samples in those persons identified for HCV testing. We looked at diagnostic accuracy outcomes as well as agreement of DBS against venous blood samples.

In order to better evaluate the sensitivity and specificity of DBS for testing for HCV antibody, the following PICO question was developed for HCV Ab:

Among persons identified for hepatitis C testing, what is the diagnostic accuracy and impact of detecting HCV Ab from DBS samples versus venous sample?

  • Population: Samples for serology (HCV Ab) for HCV
  • Intervention: Using DBS samples
  • Comparisons: Using plasma or serum from venous samples
  • Outcomes: Diagnostic accuracy (sensitivity, specificity, positive likelihood ratio, negative likelihood ratio, TN, TP, FN and FP) and agreement (kappa, intra-class coefficients)

3. Method

PRISMA guidelines were followed and QUADAS-2 was used to estimate quality of studies.

i.

ii. Search strategy and selection criteria

Types of studies

Observational (including diagnostic accuracy studies) and interventional studies were included. We chose studies including comparisons of the index test HCV antibody in DBS against the reference test HCV antibody using serum and reported correlations, regression coefficients, specificity, sensitivity or predictive values. Only English language reports were included.

Participants

No date, geographical or population demographic exclusions were made. Patients of all age groups were included.

Target conditions

For use in screening, for diagnosing HCV.

Index test

Testing for HCV antibody in DBS.

Reference standard

Testing for HCV antibody in serum using any commercially available or in-house tests.

Outcome measures

Sensitivity refers to the proportion of samples with true HCV infection diagnosed with HCV antibody test using DBS confirmed with a positive HCV antibody in serum.

Specificity refers to the proportion of samples with negative HCV antibody using DBS and no evidence of HCV antibody confirmed with a HCV antibody in serum.

Any measures of agreement (kappa, intra-class coefficients) will also be included.

iii. Search methods

We searched English language manuscripts from PubMed, MEDLINE, Web of Science, EMBASE, Global Health and LILACS databases using a sensitive search strategy. The search was conducted during August–September 2015.

Title, abstract and full-text review was done using predefined eligibility criteria. The reference lists for articles selected for inclusion were also reviewed for additional manuscripts to review. Additional data and clarifications were sought by contacting study authors.

iv. Data extraction

All the studies were subject to the same data extraction procedure by one reviewer (BL) and form based on the following parameters: author, publication and study dates, country, type of specimen used for DBS, specimen used as gold standard (plasma or serum), test used, storage conditions and effect of storage conditions and assay type.

v. Statistical data analysis

Statistical analysis of the data was performed using STATA 13. For analysis of sensitivity and specificity, a bivariate analysis using maximum likelihood estimate and 95% confidence interval was used. Likelihood ratios were calculated directly from the pooled sensitivity and specificity. We used forest plots to visually assess heterogeneity. If not all diagnostic values could be extracted from the study, univariate and bivariate analysis was compared. Stratified analysis was performed by type of assay and by storage conditions.

vi. Risk of bias and quality assessment

The QUADAS-2 tool was used to assess risk of bias. A GRADE assessment was performed by two reviewers in parallel to assess the quality of included studies.

4. Results

i. Search results and summary of included studies

Our search yielded 485 abstracts for screening after deduplication (manually and by reference software). One hundred fifteen full texts were screened for potential inclusion and 18 studies were chosen to be included for the qualitative review.4,12,13,1731 Fourteen of those contributed to the quantitative analysis. Of those not contributing, one did provide a ROC curve but no denominators for sensitivity and specificity,28 two did not provide any data for calculation of sensitivity or specificity30,32 and one was testing avidity in comparison to venous blood samples and not overall diagnostic accuracy.22 Of the 14 studies providing enough data to calculate sensitivity, one did not have any negative references so that no specificity could be calculated.29 (Fig. 1 and Table 1)

Studies mainly stemmed from Europe, North America and Australia,33,34 two studies could be included from South America (Brazil)33,34 and three from South-East and Central Asia (India,23 Mongolia35 and Malaysia28). Studies were published from 1997 to 2014 and most used 50µL to 100µL of whole blood on filter paper to test for HCV antibody. Only one study included children;31 however, age ranges or gender for adult patients were rarely reported.

ii. Diagnostic performance

Diagnostic accuracy

Of those studies included in the quantitative analysis, reported sensitivity of HCV-antibody in DBS ranged from 70% to 100% and specificity ranged from 95.1% to 100% (see Table 1).

A pooled bivariate analysis of sensitivity and specificity revealed an overall sensitivity of 98% (CI 95% 94–99) and an overall specificity of 99% (CI 95% 97–100). From the pooled sensitivity and specificity, the positive likelihood ratio was 171 and the negative likelihood ratio was 0.02 (see Tables 3, 4 and 5). E(logitSE) was 3.6 and E(logitSp) was 5.1 with a covariance between estimates of E(logitSe) and E(logitSp) (tau2) of 0.11, showing moderate heterogeneity in the bivariate analysis of studies.

Agreement

Three of 18 included studies provided agreement measures with kappa ranging from 0.87 to 0.94 between DBS and venous blood samples.33,34,36

iii. Effect of test and cut-off used

Fifteen different assays were used in HCV antibody detection. Cut-offs varied widely, and as no standardized cut-offs existed many studies devised their own cut-off via receiver operator characteristics. Nine of the included studies did report some threshold or cut-off used for DBS.12,13,20,21,2528,34 No attempt was made to stratify by type of test or cut-off used as too many strata would have rendered results difficult to interpret.

iv. Effect of storage conditions and type of test

Four studies evaluated different storage conditions. In one study, three of three previously negative samples exceeded threshold values after 3 days at room temperature.27 Similarly, Tuaillon et al. showed that after 6 days of room temperature storage, threshold values were exceeded and previously negative samples would be seen as positive.37 In another study, stability was shown until 60 days at room temperature, but variation in quantitative values was less after storage at –20 °C.34 This was confirmed in another study that also tested different storage conditions and found lowest variation of results after storage at –20 °C.33

No study had left study samples at room temperature for longer than 24 hours. Therefore, in another pooled analysis, we stratified studies according to whether samples had been left at room temperature for longer than 4 hours or not. This did not change the high heterogeneity found in our meta-analysis (see Appendix).

v. Assessment of study quality and risk of bias

Concerning risk of bias, several studies did not report adequately on major issues; as such, rating risk of bias was difficult. Four of the included studies used case-control designs and only two reported consecutive sampling. However, the rest did provide some report on sampling. Only two studies blinded laboratory personnel to either reference or index test while performing the other one, however all studies performed index and reference tests consistently and reported on the protocol used. Overall, we graded the quality of studies to be moderate (Tables 2 and 6).

b. Discussion

This systematic review and meta-analysis shows that there is evidence of moderate quality on the use of DBS for HCV antibody testing. The pooled analysis of the data available suggests high diagnostic accuracy of DBS samples for detection of HCV antibodies with good precision. The descriptive review also shows that studies looking at agreement found good agreement between DBS HCV antibody testing and testing on venous blood samples.

i. Impact of storage and other factors

No study stored DBS samples at room temperature for longer than 24 hours. Additionally, those studies looking at variation of results after putting samples in different storage conditions found that samples could become false positive with longer exposure at ambient temperatures.13,27

In stratification on storage conditions of our pooled results, pooled sensitivity and specificity were only slightly different for samples stored longer at room temperature. However, as no study reported on storing samples for longer than a day, results are not generalizable to conditions often found in low-resource locations.

ii. Key limitations

This review has a number of limitations. We did not look at studies in languages other than English and no unpublished data from laboratories was included. While some studies had only a low risk of bias, overall the quality of studies was moderate at best.

Another important limit of this review is its inability to suggest certain commercial tests over others to use for DBS testing of HCV antibody or to suggest a cut-off that should be used for DBS testing. As tests used were varied, no stratified analysis was done for the type of test. Additionally, to suggest a cut-off, individual-level patient data would have to have been available.

iii. Future work

We would therefore suggest that subsequent diagnostic accuracy studies concentrate on showing applicability of DBS under field transport and storage conditions and report on different cut-offs used with their tests. We would also urge manufacturers to validate their tests for the use of DBS, apply for regulatory approval for this sample type and include instructions for this in their manuals.

5. Conclusion

In conclusion, while diagnostic accuracy of DBS for HCV antibody testing is good in those studies included in this review, uncertainty about the storage conditions needed and the cutoffs to use seriously limit its wider application in low-resource settings.

a. Figures and tables

Fig. 1. PRISMA flowchart.

Fig. 1PRISMA flowchart

Table 1Study characteristics

AuthorTitleJournalYearCountryStudy pop, sample sizeStorage conditionsDBS collection methodPlasma antibody testDBS antibody testSuggested cut-offSpecificitySensitivityCorrelation/agr eementEffect of storage conditions
Brandao Simultaneous detection of hepatitis C virus antigen and antibodies in dried blood spots Journal of Clinical Virology 2013Brazil386 persons, 40 anti-HCV positive, 346 blood donors HCV nonreactiveDBS samples air dried at room temperature for 4 hours, stored at −20°C75µL whole blood onto Whatman filter paper / alternatively 3−5 drops of capillary blood by finger-prickMonolisaTM HCV AgAb ULTRA, Bio-Rad (Marnes-laCoquette, France), and Murex HCV AgAb, Abbott (Kyalami, Republic of South Africa)MonolisaTM HCV AgAb ULTRA, Bio-Rad (Marnes-laCoquette, France), and Murex HCV AgAb, Abbott (Kyalami, Republic of South Africa)ROC cut-off: 0.287 nm for Monolisa assay

ROC cut-off for Murex assay 0.238 nm
99.7 (98.4−9.9)


95.9 (93.3−7.8)
97.5 (86.8−9.9)


97.5 (86.8−9.9)
PPV and NPV calculated
Kappa=0.99 (with ROC cut-off),
Stability up to 60 days of storage at room temperature, but less variation at −20°C
Croom Commercial enzyme immunoassay adapted for the detection of antibodies to hepatitis C virus in dried blood spots Journal of Clinical Virology 2006Australia103 samples from high-risk groups, negative samples from 94 individuals tested at Haematology LabAir dried at room temperature, storage at −20°C, plasma at −20°C, time of storage 1 week to 11 months80 µL of each whole blood sample spotted onto Schleicher and Schuell cards (Grade 903)Monolisa EIA confirmation test: Murex anti HCV (version 4.0), EIAMonolisa EIA confirmation test: Murex anti HCV (version 4.0), EIANR100% (96−100) 108/108100% (4−0) 75/75NRNR
Chevaliez Dried blood spots (DBS), a promising tool for large-scale hepatitis C screening, diagnosis and treatment monitoringConference abstracts2014France529 patients, 183 HCV seronegative, 346 seropositiveNRNREIA HCV assayEIA HCV assay0.298.9 (96.1−9.7)99.1 (97.4−9.7)R=0.56NR
Dokubo Comparison of hepatitis C virus RNA and antibody detection in dried blood spots and plasma specimen Journal of Clinical Virology 2014US148 participants in a prospective study of HCVDBS airdried for 2 hour, then sent to another institute, then stored at −70°CFingerstick on
Whatman 903 cards
0.5 ml blood
Standard HCV TMA (Novartis®) ELISA v3.0(Ortho®).Standard HCV TMA (Novartis®) ELISA v3.0(Ortho®).100% (71/71)70% (54/77)Kappa 0.69NR
Larrat Performance of an antigen–antibody combined assay for hepatitis C virus testing without venipuncture Journal of Clinical Virology 2012France113 HCV-positive cases consecutively recruitedDSB dried 24 hours at room temperatureFinger-prick blood on Whatman cardMonolisa® HCV-Ag-Ab-ULTRA, Bio-RadOraquick HCV


CEIA Biorad
0.1


0.2 cEIA
100 (95.8−100) 88/88


100 (95.8−100) 88/88
97.4(92.5−99.1)
110/113


98.2 (93.8−99.5) 111/113
ROC AUC OMT cEIABiorad: 0.99


ROC AUC FSB cEIABiorad:
0.918
At 3 days room temperature 3/3 HCV negative samples NR
Lee Evaluation of the dried blood spot (DBS) collection method as a tool for detection of HIV Ag/Ab, HBsAg, anti-HBs and anti-HCV in a Malaysian tertiary referral hospital Ann Acad Med Singapore 2011Malaysia600 samples overall, not quite clear how many used anti-HCVLeft to dry overnight at room temperature, then stored −20°C3 mL blood sample by venous punctureAbbottAbbottROC cut-off 0.10 RLU100%97.3%ROC curve AUC: 0.99
R=0.631
NR
Lukacs Simultaneous determination of HIV antibodies, hepatitis C antibodies and hepatitis B antigens in dried blood spots – a feasibility study using a multianalyte immunoassay Clinical Chemistry and Laboratory Medicine 2005Germany7 samples from known HCV patientsLuminex100% 7/7
McCarron Hepatitis C antibody detection in dried blood spots J Viral Hepat 1999UK0.99

1.99
87.5%

100%
100%

97.2%
Marques Dried blood spot samples: optimization of commercial EIAs for hepatitis C antibody detection and stability under different storage conditions Journal of Medical Virology 2012Brazil21 and 24 HCV reactive patients, 234 individual and 132 HCV negativeSerum stored at −20°C75 µL whole blood on Whatman paperTwo methods: HCV Ab Radim, Pomezzia, Italy and ETI-ABHCVK-4 DiaSorin, Vercelli, ItalyTwo methods: HCV Ab Radim, Pomezzia, Italy and ETI-AB-HCVK-4 DiaSorin, Vercelli, ItalyRadimcut-off: manufacturers cut-off

ROC curve for
DiaSorin EIA
99.5% (98 − 99.9)


98.9% (96.0−9.55)
97.5% (86.4−9.94)


88.9% (75.5−6.29)
2−8 °C, 20−25 °C, and −20°C were evaluated, −20 °C resulted in lowest variation Methods of cut-off determination: the receiver operating characteristic curve (AUROC)
Nandagopal Evaluation of dried blood spot as an alternative specimen for the diagnosis of antiHCV in resourcelimited setting Indian Journal of Medical Microbiology 2014IndiaMurex60 samples50 µL of whole blood 903 Whatman cardNRNRNR100 (29/29)100 (31/31)Pearson correlation coefficient 0.98NR
O Brien Detection of hepatitis C antibody with athome collection kits using an innovative laboratory algorithm Infectious Diseases in Clinical Practice 2001US1286 subjects enrolled in multicentre studyAir dry for 30 min, sent in FedEx envelopeSelf-collected with at-home kitNRHepatitis C check, Home Access Corp. self use DBS home kitNR Several inconclusive and indeterminate results not included in diagnostic accuracy calculations100% 686/68699.5% 402/404NRNR
Parker A method for the detection and confirmation of antibodies to hepatitis C virus in dried blood spots Journal for Virological Methods 1997UK80 anti HCV positive samples, 52 negative 569 DBS sample fields from South African neonatesAir dry at room temperature before storage at 4°CDried blood field samplesIn-house IgG ELISA, immunoblot RIBA 3.0In-house IgG ELISA, immunoblot RIBA 3.0T/N 5.0


T/N10.0
541/569 95.1%78/80 98%

69/80 86.2%
NR
Ross Detection of infections with hepatitis B virus, hepatitis C virus, and human immunodeficiency virus by analyses of dried blood spots-performance characteristics of the ARCHITECT system and two commercial assays for nucleic acid amplification Virology 2013Germany339 samplesDried overnight at room temperature100 µL of whole blood applied to Whatman 903 filter paperARCHITECT system (Abbott Diagnostics, Delkenheim, Germany)ARCHITECT system (Abbott Diagnostics, Delkenheim, Germany)NR100% (97.7−0) 160/16097.8% (96−100) 175/179NRNR
Sheperd A hepatitis C avidity test for determining recent and past infections in both plasma and dried blood spots Journal of Clinical Virology 2013UK19 recently infected 300 chronic carrier 82 resolved infectionDBS stored at 4°C until use50 µL on 903 Whatman Protein saver cardsORTHO HCV 3.0 ELISA Test System with Enhanced SAVekit (Ortho Clinical Diagnostics) was used to detect anti-HCV in DBSNRAvidity cut-off AI<3098.3% Arc100%Comparison to known carriers, not to venous blood samplesNR
Tejada-Strop Disparate detection outcomes for anti-HCV IgG and HCV RNA in dried blood spots Journal of Virological Methods 2015US33 adult patients with chronic Hep C-20°C until 5 years later75 µL of whole blood on 12 mm DBSTwo immunoassays, the VITROS anti-HCV IgG chemiluminescence assay (CIA) and the HCV 3.0 enzyme immunoassay (EIA), both from Ortho Clinical Diagnostics (Rochester, NY)Two immunoassays, the VITROS anti-HCV IgG chemiluminescence assay (CIA) and the HCV 3.0 enzyme immunoassay (EIA), both from Ortho Clinical Diagnostics (Rochester, NY)3.26 CIA

1.5 EIA
Not calculatedCIA 48/52 92%


EIA 90% 47/52

For stored samples CIA: 100% (33/33) EIA: 32/33 97%
NRNR
Tuaillon, Dried blood spot for hepatitis C virus serology and molecular testing Hepatology 2010France100 anti HCV positive serum samples and 100 anti HCV negative samples18 hours dried at room temperature, stored at −20°C for 1−8 weeks50 µL of whole blood on Whatman 12 mm paper discsOrtho HCV 3.0 ELISA, immunoblot assay INNO-LIA HCV Score as confirmatory testOrtho HCV 3.0 ELISA, immunoblot assay INNO-LIA HCV Score as confirmatory testThreshold value
0.380
98% (97−100)99% (97−99)NRStability of anti HCV and HCV RNA investigated by varying room temperature exposure 2−12 days until freezing, after 6 days at room temperature ODs > than cutoff values
Waterboer, Dried blood spot samples for seroepidemiology of infections with human papilloma viruses, Helicobacter pylori, hepatitis C virus and JC virus Journal of Clinical Virology 2011Mongolia1022 sexually active women from cross sectional study (response rate 69%)Room temperature up to 8 hours, then −20°C up to 1 month (serum + DBS)Whole blood applied to 5 spots on DBS filter paper cards (Whatman 903)The HCV (strain H77, subtype 1a) core and NS3 proteinsThe HCV (strain H77, subtype 1a) core and NS3 proteinsSera 1492 (Core)
371 (NS3)


DBS
967 (Core)
310 (NS3) c
Not calculable from the dataNot calculable from the data98% agreement (kappa 0.94) for core 96.1% agreement (kappa 0.90) for NS3NR

Table 2Risk of bias

Patient selectionBiasIndex testBiasReference standardBiasFlowBias
Was a case–control design avoided?
Consecutive or random sample of patients?
Inappropriate exclusions?
Blinded to reference standard Could the conduct or interpretation of the index test have introduced bias?Blinded to index?
Could the reference standard have introduced bias?
Is there an appropriate interval between the index test and reference standard? Do all patients receive the same reference standard?
Are all patients recruited into the study included in the analysis?
BrandaoNo case–control design, consecutive sample, no exclusionsLRNRURNRURNRUR
CroomNo case–control, sampling from different cohortsLRNRURNRURAll patients included, same reference standardLR
ChevaliezNRURNRURNRURNRUR
DokuboNo case–control, sampling from a prospective cohortLRNRURNRURSampling reported, same reference standardLR
LarratConsecutive recruitmentLRBlindedLRBlindedLRSampling reported, same reference standardLR
LeeConsecutive recruitmentLRNRURNRURSampling reported, same reference standardLR
LukacsNRURNRURNRURSampling reported, same reference standardLR
McCarronCase–controlHRNRURNRURNRUR
MarquesNo case–control designLRNRURNRURSampling reported, same reference standardLR
NandagopalNRURNRURNRURNRUR
O BrienNo case–control designLRBlindedLRBlindedLRSampling partly reported, same reference standardLR
ParkerCase–control designHRNRURNRURSampling partly reported, same reference standardLR
RossNo case control designLRNRURNRURNRUR
SheperdNo case–control designLRNRURNRURNRUR
Tejada-StropCase–controlHRNRURNRURNRUR
Tuaillon,Case–controlHRNRURNRURSampling reported, same reference standardLR
Waterboer,No case–controlLRNRURNRURNRUR

Table 1Sensitivities and specificities of included studies

StudySensitivitySpecificity
EstimateCI95% lower boundCI95% upper boundEstimateCI95% lower boundCI95% upper bound
Brandao/2013/MonolisaTMAgAb0.980.871.001.000.981.00
Brandao/2013/Murex0.980.871.000.960.930.98
Croom/2006/MonolisaTMAgAb1.000.951.001.000.971.00
Chevaliez/2014/EIA HCV0.990.971.000.980.951.00
Dokubo/2013/HCV TMA Novartis0.700.590.801.000.851.00
Larrat1/2012/Oraquick0.970.920.991.000.961.00
Larrat2/2012/cEIABiorad0.980.941.001.000.961.00
Lee/2011/Abott
Lukacs/2005/Luminex1.000.591.00
McCarron/1999/
Marques1/2012/RadimPomezzia0.980.871.000.990.981.00
Marques2/2012/ETI-AB-HCVK-4-Diasorin0.890.760.960.960.940.98
Nandagopal/2014/Murex1.000.891.001.000.881.00
OBrien/2001/Hepatitis C check1.000.981.001.000.991.00
Parker/1997/in-house0.980.911.000.950.930.97
Parker2/1997/in-house0.860.770.930.950.930.97
Ross/2013/Architect0.980.940.991.000.981.00

Table 4Forest plot of sensitivities and specificities

Image annex5f87.jpg

Table 5Forest plot of likelihood ratios for included studies

Image annex5f88.jpg

Table 6GRADE table

Number of studiesType of studyDirectnessPrecisionConsistencyRisk of biasOverall quality
Sensitivity 98% (95% CI 94.0%−99.%)
14 studies

(1549 HCV positive among 4304 samples)
Diagnostic accuracyNo significant indirectnessNo significant imprecisionSignificant inconsistencyModerate risk of bias (patient enrollment only partly consecutive or random; several case–control studies)Moderate
Specificity 99% (95% CI 97−100%)
13 studies

(2756 HCV positive among 4304 samples)
Diagnostic accuracyNo significant indirectnessNo significant imprecisionSignificant inconsistencyModerate risk of bias (patient enrollment only partly consecutive or random; several casecontrol studies)Moderate

Appendix

i. Sources of heterogeneity

In a univariate analysis of sensitivity and specificity stratified by storage conditions sensitivity and specificity are similar among those reporting to have stored samples for less than 4 h compared to those reporting up to 24 h storage.

Table A1Sensitivities of included studies stratified on storage conditions

Image annex5f89.jpg

Table A2Specificities of included studies stratified on storage conditions

Image annex5f90.jpg

References

1.
Guidelines for the screening, care and treatment of persons with hepatitis C infection. Geneva: World Health Organization; 2014. Available at: http://apps​.who.int/iris​/bitstream/10665​/111747/1/9789241548755_eng.pdf (accessed on 06 June 2016) [PubMed: 25535634]
2.
Hirtz C , LehmannS. Blood sampling using “dried blood spot”: a clinical biology revolution underway?Ann Biol Clin (Paris). 2015;73(1):25–37(in French). [PubMed: 25582720]
3.
Snijdewind IJ , van KampenJJ, FraaijPL, van der EndeME, OsterhausAD, GrutersRA. Current and future applications of dried blood spots in viral disease management. Antiviral Res. 2012;93(3):309–21. [PubMed: 22244848]
4.
Ross RS , StambouliO, GrunerN, MarcusU, CaiW, ZhangW, et al. Detection of infections with hepatitis B virus, hepatitis C virus, and human immunodeficiency virus by analyses of dried blood spots – performance characteristics of the ARCHITECT system and two commercial assays for nucleic acid amplification. Virol J. 2013;10:72. [PMC free article: PMC3599381] [PubMed: 23497102]
5.
Hickman M , McDonaldT, JuddA, NicholsT, HopeV, SkidmoreS, et al. Increasing the uptake of hepatitis C virus testing among injecting drug users in specialist drug treatment and prison settings by using dried blood spots for diagnostic testing: a cluster randomized controlled trial. J Viral Hepat. 2008;15(4):250–4. [PubMed: 18086182]
6.
McAllister G , InnesH, McLeodA, DillonJF, HayesPC, FoxR, et al. Uptake of hepatitis C specialist services and treatment following diagnosis by dried blood spot in Scotland. J Clin Virol. 2014;61(3):359–64. [PubMed: 25264306]
7.
Hutchinson S . Translating research into public health policy: the Scottish national hepatitis C action plan. In: 3rd International Symposium on Hepatitis Care in Substance Users, Munich, Germany, 5–6 September 2013. (var.pagings). 15 (4): 217.
8.
Craine N , WhitakerR, PerrettS, ZouL, HickmanM, LyonsM. A stepped wedge cluster randomized control trial of dried blood spot testing to improve the uptake of hepatitis C antibody testing within UK prisons. Eur J Public Health. 2015;25(2):351–7. [PMC free article: PMC4376964] [PubMed: 25061233]
9.
Bravo MJ , VallejoF, BarrioG, BrugalMT, MolistG, PulidoJ, et al. HCV seroconversion among never-injecting heroin users at baseline: no predictors identified other than starting injection. Int J Drug Policy. 2012;23(5):415–9. [PubMed: 22421554]
10.
Allen EJ , PalmateerNE, HutchinsonSJ, CameronS, GoldbergDJ, TaylorA. Association between harm reduction intervention uptake and recent hepatitis C infection among people who inject drugs attending sites that provide sterile injecting equipment in Scotland. Int J Drug Policy. 2012;23(5):346–52. [PubMed: 22940142]
11.
McLeod A , WeirA, AitkenC, GunsonR, TempletonK, MolyneauxP, et al. Rise in testing and diagnosis associated with Scotland’s Action Plan on Hepatitis C and introduction of dried blood spot testing. J Epidemiol Community Health. 2014;68(12):1182–8. [PubMed: 25170094]
12.
Brandao CP , MarquesBL, MarquesVA, Villela-NogueiraCA, DoOK, de PaulaMT, et al. Simultaneous detection of hepatitis C virus antigen and antibodies in dried blood spots. J Clin Virol. 2013;57(2):98–102. [PubMed: 23518440]
13.
Tuaillon E , MondainAM, MerouehF, OttomaniL, PicotMC, NagotN, et al. Dried blood spot for hepatitis C virus serology and molecular testing. Hepatology. 2010;51(3):752–8. [PubMed: 20043287]
14.
Greenman J , RobertsT, CohnJ, MessacL. Dried blood spot in the genotyping, quantification and storage of HCV RNA: a systematic literature review. J Viral Hepat. 2015;22(4):353–61. [PMC free article: PMC4409077] [PubMed: 25367722]
15.
Jones L , BatesG, McCoyE, BeynonC, McVeighJ, BellisMA. Effectiveness of interventions to increase hepatitis C testing uptake among high-risk groups: a systematic review. Eur J Public Health. 2014;24(5): 781–8. [PubMed: 24158318]
16.
Khuroo MS , KhurooNS, KhurooMS. Diagnostic accuracy of point-of-care tests for hepatitis C virus infection: a systematic review and meta-analysis. PLoS One. 2015;10(3): e0121450. [PMC free article: PMC4376712] [PubMed: 25816332]
17.
O’Brien J , KruzelK, WandellM, VinogradovI, SheagrenJ, FrankA. Detection of hepatitis C antibody with at-home collection kits using an innovative laboratory algorithm. Infect Dis Clin Pract (Baltim Md). 2001;10(9):474–80.
18.
Judd A , ParryJ, HickmanM, McDonaldT, JordanL, LewisK, et al. Evaluation of a modified commercial assay in detecting antibody to hepatitis C virus in oral fluids and dried blood spots. J Med Virol. 2003;71(1):49–55. [PubMed: 12858408]
19.
Croom HA , RichardsKM, BestSJ, FrancisBH, JohnsonEI, DaxEM, et al. Commercial enzyme immunoassay adapted for the detection of antibodies to hepatitis C virus in dried blood spots. J Clin Virol. 2006;36(1):68–71. [PubMed: 16426889]
20.
Marques BL , BrandaoCU, SilvaEF, MarquesVA, Villela-NogueiraCA, DoOK, et al. Dried blood spot samples: optimization of commercial EIAs for hepatitis C antibody detection and stability under different storage conditions. J Med Virol. 2012;84(10):1600–7. [PubMed: 22930508]
21.
Waterboer T , DondogB, MichaelKM, MichelA, SchmittM, VaccarellaS, et al. Dried blood spot samples for seroepidemiology of infections with human papillomaviruses, Helicobacter pylori, hepatitis C virus, and JC virus. Cancer Epidemiol Biomarkers Prev. 2012;21(2):287–93. [PubMed: 22147363]
22.
Shepherd SJ , KeanJ, HutchinsonSJ, CameronSO, GoldbergDJ, CarmanWF, et al. A hepatitis C avidity test for determining recent and past infections in both plasma and dried blood spots. J Clin Virol. 2013;57(1):29–35. [PubMed: 23369886]
23.
Nandagopal P , IqbalHS, SaravananS, SolomonSS, MehtaS, SelvakumarM, et al. Evaluation of dried blood spot as an alternative specimen for the diagnosis of anti-HCV in resource-limited settings. Indian J Med Microbiol. 2014;32(2):208–10. [PubMed: 24713924]
24.
Dokubo EK , EvansJ, WinkelmanV, CyrusS, ToblerLH, AsherA, et al. Comparison of hepatitis C virus RNA and antibody detection in dried blood spots and plasma specimens. J Clin Virol. 2014;59(4):223–7. [PMC free article: PMC4026019] [PubMed: 24529844]
25.
Tejada-Strop A , DrobeniucJ, Mixson-HaydenT, ForbiJC, LeNT, LiL, et al. Disparate detection outcomes for anti-HCV IgG and HCV RNA in dried blood spots. J Virol Methods. 2015;212:66–70. [PubMed: 25445800]
26.
Chevaliez S , SoulierA, PoiteauL, PawlotskyJM. Dried blood spots (DBS), a promising tool for large-scale hepatitis c screening, diagnosis and treatment monitoring. In: 49th Annual Meeting of the European Association for the Study of the Liver, International Liver Congress 2014 London, United Kingdom, 9–13 April 2014. [Abstract P765]. J Hepatol. 2014;60 (1Suppl. 1): S325–S326.
27.
Larrat S , BourdonC, BaccardM, GarnaudC, MathieuS, QuesadaJL, et al. Performance of an antigen-antibody combined assay for hepatitis C virus testing without venipuncture. J Clin Virol. 2012;55(3):220–5. [PubMed: 22901327]
28.
Lee CE , Sri PonnampalavanarS, Syed OmarSF, MahadevaS, OngLY, KamarulzamanA. Evaluation of the dried blood spot (DBS) collection method as a tool for detection of HIV Ag/Ab, HBsAg, anti-HBs and anti-HCV in a Malaysian tertiary referral hospital. Ann Acad Med Singapore. 2011;40(10):448–53. [PubMed: 22206053]
29.
Lukacs Z , DietrichA, GanschowR, KohlschutterA, KruithofR. Simultaneous determination of HIV antibodies, hepatitis C antibodies, and hepatitis B antigens in dried blood spots – a feasibility study using a multi-analyte immunoassay. Clin Chem Lab Med. 2005;43(2):141–5. [PubMed: 15843206]
30.
McCarron B , FoxR, WilsonK, CameronS, McMenaminJ, McGregorG, et al. Hepatitis C antibody detection in dried blood spots. J Viral Hepat. 1999;6(6):453–6. [PubMed: 10607263]
31.
Parker SP , CubittWD, AdesAE. A method for the detection and confirmation of antibodies to hepatitis C virus in dried blood spots. J Virol Methods. 1997;68(2):199–205. [PubMed: 9389410]
32.
Judd A , ParryJ, HickmanM, McDonaldT, JordanL, LewisK, et al. Evaluation of a modified commercial assay in detecting antibody to hepatitis C virus in oral fluids and dried blood spots. J Med Virol. 2003;71(1):49–55. [PubMed: 12858408]
33.
Marques BLC , BrandaoCU, SilvaEF, MarquesVA, Villela-NogueiraCA, Do OKMR, et al. Dried blood spot samples: optimization of commercial EIAs for hepatitis C antibody detection and stability under different storage conditions. J Med Virol. 2012;84(10):1600–7. [PubMed: 22930508]
34.
Brandao CP , MarquesBL, MarquesVA, Villela-NogueiraCA, DoOKM, de PaulaMT, et al. Simultaneous detection of hepatitis C virus antigen and antibodies in dried blood spots. J Clin Virol. 2013;57(2):98–102. [PubMed: 23518440]
35.
Waterboer T , DondogB, MichaelKM, MichelA, SchmittM, VaccarellaS, et al. Dried blood spot samples for seroepidemiology of infections with human papillomaviruses, helicobacter pylori, hepatitis C virus, and JC virus. Cancer Epidemiol Biomarkers Prev. 2012;21(2):287–93. [PubMed: 22147363]
36.
Waterboer T , DondogB, MichaelKM, MichelA, SchmittM, VaccarellaS, et al. Dried blood spot samples for seroepidemiology of infections with human papillomaviruses, helicobacter pylori, Hepatitis C Virus, and JC Virus. Cancer Epidemiol Biomarkers Prev. 2012;21(2):287–93. [PubMed: 22147363]
37.
Tuaillon E , MondainAM, MerouehF, OttomaniL, Van De PerreP, DucosJ. Dried blood spot for hepatitis C virus molecular diagnosis: an alternative tool for hard-to-reach population. In: 45th Annual Meeting of the European Association for the Study of the Liver (EASL), International Liver Congress 2010 Vienna, Austria, 14–18 April 2010. J Hepatol. 2010;52:S408–S409.

Annex 5.9.3. PICO 7 - Dried blood spots
Dried blood spots as sample collection method for HBV DNA

Authors

Team lead: , , , , , , , and .

Affiliations

1 Médecins Sans Frontières, Geneva, Switzerland

A systematic review and meta-analysis

1. Executive summary

Introduction: Dried blood spots are a convenient diagnostic for viral diseases due to transport and logistical advantages over venous blood sampling. The diagnostic accuracy for the detection of hepatitis B (HBV DNA) on DBS samples is not known.

Methods: We conducted a systematic review and meta-analysis on the diagnostic accuracy of HBV DNA from DBS samples compared to venous samples in those persons identified for HBV DNA testing. MEDLINE, EMBASE, Global Health, Web of Science and Cochrane library were searched with a sensitive search strategy and data were extracted following a predefined extraction scheme. We described ranges of diagnostic accuracy outcomes as well as correlation and regression coefficients of DBS against venous blood samples reported by included studies. For pooled analysis of sensitivity and specificity, a bivariate analysis using maximum likelihood estimate and 95% confidence intervals were used and heterogeneity of results was assessed. PRISMA guideline was followed and the QUADAS tool was used to assess for risk of bias.

Results: Ten studies of 485 abstracts were included in the qualitative review, 8 of those contributed to the quantitative analysis. Overall quality of studies was low. A pooled bivariate analysis revealed an overall sensitivity of 96% (CI 95% 91–98) and an overall specificity of 100% (CI 95% 55–100). Positive likelihood ratio was 307 and the negative likelihood ratio was 0.04. Heterogeneity was moderate with an I2 of 18% (95% CI 0–100) and a tau2 of 0.018.

One study reporting on thresholds reported a sensitivity of 98% for a cut-off of 2000 IU/mL, another reported a limit of detection of a commercial assay for DBS of 914 IU/ml. No study reported on storage conditions >24 hours at room temperature for DBS, but several studies varying storage conditions for individual samples did not find high variation of results.

Discussion: This systematic review and meta-analysis show that data are scarce and of suboptimal quality on the use of DBS for HBV DNA testing. The pooled meta-analysis of data available suggests that sensitivity compared to serum is good while specificity estimate is adequate with high imprecision. Individual study reports seem to suggest that sensitivity of HBV DNA detection above 2000 IU/mL is good. Bigger and better-performed diagnostic accuracy studies reporting diagnostic accuracy at different thresholds are needed.

2. Introduction

i. Epidemiology

A large number of people are infected with hepatitis B (HBV) and nearly a third of those will develop liver cancer and cirrhosis. Prevalence of HBV is highest in sub-Saharan Africa, East Asia, in the Middle East and India.1 Few patients are aware of their infection until complications are present.

ii. Approach to HBV DNA testing

While for a diagnosis of HBV, serology is often sufficient for follow up and for decisions on treatment, quantitative testing of HBV DNA is important.2 Most HBV DNA testing currently occurs on platforms in reference laboratories. Several guidelines recommend using a threshold of 2000 IU/mL for decisions on treatment in patients with chronic hepatitis B.2

iii. Use of DBS

Dried blood spots (DBS) can facilitate sample transport and simplify logistics, as has been shown for HIV.3 They do not require venous blood to be taken, storage and transportation are less difficult and biohazard is reduced.4 Increasingly DBS has therefore been used in the management of viral diseases, including HIV and hepatitis.5 However, currently DBS protocols for hepatitis are not standardized for many applications and commercial tests and DBS is not yet regulatorily approved as a sample type.6

Several studies have shown potential of DBS to increase uptake of hepatitis testing among several vulnerable risk groups,79 while others have not been able to confirm this trend.10 Even if uptake is not affected, however, procedural advantages make DBS a good choice for diagnosis and follow up of patients with HBV in low-resource regions.5 Which is why DBS for serology has often been used in epidemiological studies, sometimes without validating it against serum.11,12 For HBV DNA testing, first efforts to test on DBS stem from more than 20 years ago,13 but only recently other studies followed.14,15 While several systematic reviews have been published on HBV diagnostics and on the use of DBS, no systematic review on HBV DNA and DBS exists to our knowledge. Recent reviews on DBS in HCV RNA16 and in tropical diseases17 did not include the diagnostic accuracy of HBV DNA in DBS.

Recently, WHO published the first guidelines for the prevention, care, and treatment of individuals with chronic HBV infection.18 These guidelines focused on assessment for treatment eligibility, initiation of first-line therapies, switching, and monitoring and did not include screening recommendations. WHO is now preparing guidelines for testing for chronic hepatitis B and C infection in low- and middle-income settings. A topic for consideration in these guidelines is the potential use of DBS for serological and molecular testing for HBV and HCV to facilitate access to and uptake of testing. As preparation for this guideline on hepatitis B and C diagnosis, we present this systematic review on the diagnostic accuracy of HBV DNA DBS in comparison to HBV DNA in serum.

In order to better evaluate the sensitivity and specificity of DBS for testing for HBV DNA the following PICO question was developed for HBV DNA.

Among persons identified for HBV DNA testing, what is the diagnostic accuracy and impact of detecting HBV DNA from DBS samples versus venous sample?

  • Population: Samples for HBV DNA detection
  • Intervention: Using DBS samples
  • Comparisons: Using plasma or serum from venous samples
  • Outcomes: Diagnostic accuracy (Sensitivity, Specificity, Positive likelihood ratio, Negative likelihood ratio, TN, TP, FN, and FP), correlation and regression coefficients

3. Methods

PRISMA guidelines were followed and QUADAS-2 was used to estimate quality of studies.

i. Search strategy and selection criteria

Types of studies

Observational (including diagnostic accuracy studies) and interventional studies were included. We chose studies including comparisons of the index test HBV DNA in DBS against the reference test HBV DNA using serum and reported correlations, regression coefficients, specificity, sensitivity or predictive values. Only English language reports were included.

Participants

No date, geographical or population demographic exclusions were used. Patients of all age groups were included.

Target conditions

Hepatitis B diagnosis, patient follow up and treatment monitoring

Index test

Testing for HBV DNA in DBS for diagnosing HBV and for follow up of HBV patients

Reference standard

Testing for HBV DNA in serum using any commercially available or in house test

Outcome measures

Sensitivity refers to the proportion of samples with true HBV infection diagnosed with HBV DNA test using DBS confirmed with a positive HBV DNA in serum.

Specificity refers to the proportion of samples with negative HBV DNA using DBS and no evidence of HBV infection confirmed with a HBV DNA in serum.

Correlation refers to any bivariate quantitative correlation parameter between HBV DNA quantity amplified in DBS compared to serum.

Regression coefficients refer to any linear regression coefficients describing the association between HBV DNA quantity in DBS compared to serum.

ii. Search methods

We searched English language manuscripts from MEDLINE, Web of Science, EMBASE, Global Health and LILACS databases. The search was conducted in August 2015.

Title, abstract and full-text review was done using predefined eligibility criteria. The reference lists for articles selected for inclusion were also reviewed for additional manuscripts to review. Additional data and clarifications were sought by contacting study authors.

iii. Data extraction

All the studies were subject to the same data extraction procedure and form based on the following parameters: author, publication and study dates, country, percentage of children and adults, age range, gender distribution, type of specimen used for DBS, specimen used as gold standard (plasma or serum), test used, storage conditions and effect of storage conditions. Data extraction was performed by one reviewer (BL).

iv. Statistical data analysis

Statistical analysis of the data was performed using STATA 13. For analysis of sensitivity and specificity, a bivariate analysis using maximum likelihood estimate and 95% confidence intervals was used if >4 studies contributed to the analysis. Likelihood ratios were calculated directly from the pooled sensitivity and specificity. We used forest plots to visually assess heterogeneity. If not all diagnostic values could be extracted from the study, univariate and bivariate analysis was compared. Stratified analysis was performed by studies that used the In house or commercially available tests and by storage conditions.

v. Risk of bias and quality assessment

The QUADAS-2 tool was used to assess risk of bias. A GRADE assessment was performed by two reviewers in parallel to assess the quality of included studies.

4. Results

i. Search results and summary of included studies

Our search yielded 485 abstracts for screening after de-duplication (manually and by reference software). Forty-eight full-text papers were screened for potential inclusion and 10 studies were chosen to be included for the qualitative review.1315,1925 Of the 10 studies, one of these studies was a conference abstract22 that was later published as a paper15 so this was not included in the quantitative analysis. Another study did not represent the data in analysable form24 (Fig. 1 and Table 1). So eight studies remained for analysis, out of which only 4 contributed to both sensitivity and specificity estimates.

Of those studies included, three stemmed from Europe (France22, Germany15, Spain23) while three were from Africa (Congo26, Egypt21 and Zambia25) two from Asia (India,13 China24) and one from Mexico.14 No data from children were included, one study only included data on women13 and one study only included HIV-positive patients.25 Overall studies underreported on demographic characteristics. All studies used whole blood apart from one study that used plasma26 for preparation of DBS samples.

ii. Diagnostic performance

Diagnostic accuracy

In the 4 studies that contributed both to sensitivity and specificity, sensitivity of HBV DNA in DBS ranged from 93% to 100% and specificity ranged from 86% to 100% (see Table 1). A pooled bivariate analysis revealed an overall sensitivity of 96% (CI 95% 91–98) and an overall specificity of 100% (CI 95% 55–100). From the pooled sensitivity and specificity, the positive likelihood ratio was 307 and the negative likelihood ratio was 0.04. Heterogeneity was low with a covariance between estimates of E(logitSe) and E(logitSp) (tau2) of 0.018 (E(logitSE) 3.3 and E(logitSP) 5.8) (Tables 3, 4 and 5).

In a univariate analysis of the 7 studies contributing to sensitivity, pooled sensitivity was 97% (CI 95% 94–99). I2 in this analysis was 54% with a tau2 of 0.0006 (see Appendix).

Association, correlation and agreement

Five of the 10 included studies reported regression coefficients showing a high association between quantitative results of HBV DNA in DBS and in serum14,15,20,21,23 (regression coefficients between 0.61 and 0.96).

In terms of correlation one study reported good Pearson correlation (0.93)14 and one study reported a good Spearman correlation coefficient of 0.84.27 One study reported an agreement of kappa >0.7 between binary results of HBV DNA on DBS and on serum.

iii. Limit of detection and thresholds of HBV DNA of assays

No guidelines for using HBV DNA assays on DBS exist and so several studies performed testing to understand the limit of detection of this method. Limit of detections of used assays (commercial and in-house) for a serum sample ranged from 10 to 100 IU/mL (see Table 1). On DBS the limit of detection in one study was 914 IU/mL for an often-used commercial assay (COBAS Taqman), with a plasma limit of detection of 20 IU/mL.15 Furthermore three studies reported that quantitation of HBV DNA in DBS below 3000–4000 IU/mL was difficult.6,23,28 A recent study from Zambia used diluted samples and reported that 13.8% (CI 95% 7.7–23.7) of those detected in plasma were missed in DBS with a cut-off of 200 IU/mL, 1.8% (95% CI: 0.5–6.6) with a cut-off of 2000 IU/mL and 0.2% (95% CI: 0.03–1.7) with a cut-off of 20 000 IU/mL (see Table 1).

iv. Effect of storage conditions, type of test and DBS/DPS

Two studies evaluating different storage conditions ranging from 4°C to 37°C for up to 7 days did not find a decline in diagnostic accuracy.14,23 For the diagnostic accuracy studies, all studies stored DBS samples at –20 °C, so we did not attempt a stratified meta-analysis on storage conditions.

We stratified studies according to whether an in-house polymerase chain reaction (PCR) assay or a commercial assay was used in a univariate analyses for sensitivity and specificity. Pooled sensitivities were similar in both groups (95% and 98%) (see Table A3 and A4 in Appendix).

Only one study used plasma instead of whole blood for preparation of dried samples, so no stratified analysis was undertaken to investigate heterogeneity. This study showed similar sensitivity and specificity to the other studies and the pooled estimate.21

v. Assessment of study quality and risk of bias

Concerning risk of bias, most studies did not report adequately on major issues, so that rating risk of bias was limited. None of the studies blinded laboratory personnel to either the reference or the index test when performing the other one, or if so, this was not reported. However, as all studies used and reported a clear and consistent protocol for both reference and index test with an output that does not allow for interpretation we did not see a major cause of bias in this. We downgraded 4 of the included studies because they used a case– control design, while the other 5 did not adequately report on their sampling or the flow of participants. This leads to a general high risk of bias in these diagnostic accuracy studies and an overall low quality of evidence (Table 2 and Table 6).

5. Discussion

This systematic review and meta-analysis shows that data are scarce and of suboptimal quality on the use of DBS for HBV DNA testing. The pooled meta-analysis of data available suggests that sensitivity compared to serum is good while the specificity estimate is adequate with high imprecision, and that different storage conditions do not effect DBS unduly. The descriptive review also shows a good correlation and high association between quantitative values for HBV DNA on DBS and in serum samples.

i. Impact of storage and other factors

Some studies did test samples at varying storage conditions and found no effect on the results of these tests. However, only one study stored dried plasma samples (also the only study using dried plasma samples and not DBS)28 at room temperature, while in all other studies those samples used in diagnostic accuracy calculations were stored at room temperature no longer than 24 hours and stored frozen afterwards. This means that all pooled results we present can only be considered valid under these conditions, which might limit applicability in field conditions tremendously.

ii. Key limitations

This review has a number of limitations. Overall the number of studies was small. Only the English literature was looked at and no unpublished studies were examined. The few studies included were of limited quality and had small sample sizes.

This review is not able to answer whether the sensitivity and specificity of certain HBV DNA thresholds – for example, 2000 IU/mL, the threshold below which treatment for HBV is not recommended – are high enough, as this could not be calculated due to not having individual sample data. This would be important, however, as guidelines suggest treatment not be started in certain cases below this threshold because it is considered inactive, immune-controlled chronic hepatitis B. Therefore, any field test might not necessarily have to be able to detect HBV DNA below 2000 IU/mL.2

In our meta-analysis, sensitivity was high in general, with narrow confidence intervals. However, no conclusions regarding specificity were possible because the pooled meta-analysis of available data yielded very wide confidence intervals. Furthermore, no pooled receiver operator characteristics (ROC) to establish good overall cut-offs for the data could be performed.

iii. Future works

Bigger and better-performed diagnostic accuracy studies that avoid case–control designs, test HBV DBS under real-life storage and transport conditions and report diagnostic accuracy for different time, temperature and clinically relevant LOD thresholds are therefore called for. We would also advocate to perform a meta-analysis of individual-level patient (sample) data of published and unpublished studies on HBV DNA in DBS, as that approach might yield more data and would allow for quantitative analyses.

Prisma flowchart

Fig. 2. Prisma Flowchart.

Fig. 2Prisma Flowchart

Table 2Characteristics of included studies

AuthorTitleJournalYearCountryStudy pop and sample sizeStorage conditionsDBS collection methodPlasma method PCRDBS method PCRLimit of detectionSpecificitySensitivityCorrelation/AssociationEffect of storage conditionsComments
AlidjinouDetection of hepatitis B virus infection markers in dried plasma spots among patients in Congo-Brazzaville Diagnostic Microbiology and Infectious Disease 2014Congo-Brazzaville32 HBV patientsDBS at room temperature, Frozen plasma samples at −80 °C30 µL of plasma onto filter paperCOBAS Taqman/COBAS AmpliPrepCOBAS Taqman/COBAS AmpliPrepDetection limit for plasma was 12 IU/mL. In 3 patients, viral load in plasma was 152, 250, and 1727 IU/mL, respectively, whereas HBV DNA could not be quantified in DPS, but was detected.96% (25/26)Spearman correlation coefficient r=0.84
AlhusseiniHepatitis B virus DNA can be amplified directly from dried blood spot on filter paper American Journal of Biochemistry and Biotechnology 2012Egypt50 HBs Ag pos patients, 10 negative controlsStored at −80 °CWatman 903, 50 µL from venous blood sampleIn houseIn houseNo cut-off suggested100%100%Good correlation (r=0.88) between DBS and plasma viral load
GuptaDirect detection of hepatitis B virus from dried blood spots by polymerase chain reaction amplification Journal of Clinical Microbiology 1992IndiaSubmitted for routine serological testing of HBs pos mothers 60 mothers with chronic HBV infection, 5 laboratory personell−20 °C for filter paperIn house (endpoint)In house (endpoint)Whatman paperLimit of detection 10E4 virus particles in each 5-,u blood spot,86% (13/15)96% (43/45)No diagnostic accuracy calculation but can be calculated from data
HalfonDried blood spot for Hepatitis B virus serology and molecular testingConference abstract2012France100 Hbs Ag neg, 100 Hbs Ag pos with HBV DNA−20°C3 blood whole blood on paper cardHBV Cobas TaqmanHBV Cobas Taqman1400 IU/mL

2000 IU/mL
100


100
98 (95−100)
91 (85−97)
Conference abstract so no more data, same study as Mohamed below
JardiUsefulness of dried blood samples for quantification and molecular characterization of HBV-DNA Hepatology 2004Spain82 patients with chronic HBV infection (23 HBeAg pos, 39 HBeAg neg, 20 HBeAg inactive, 15 HBe neg under lamivudine therapyRoom temperature for up to two hours, then −20 °C20 µL of capillary blood on 5mm paper disks (Scheicher)In houseIn houseLOD 100 cop/mL among eight samples with serum HBV DNA between 103 and 104 copies/mL, seven tested positive using DBS samples, and among four samples with detectable serum HBV-DNA levels_103 copies/mL, none were positive using DBS samples.Regression coefficient HBV DNA concentration in DBS versus serum samples r(2) = 0.96 (P<.001).Stability of DBS samples assessed by leaving samples for several days in differed conditions, no effect on HBV DNA levels
Lira RUse of dried blood samples for monitoring hepatitis B virus infection Virology Journal 2009Mexico47 HBV
Monoinfected patient
Plasma samples at −70 °C, filter paper at −20 °C50 µL per card (Schleicher + Schull)QIAamp® Ultrasens® Virus kit (QIAGEN GMBH, Germany),100%The Pearson correlation 0.93 (p = 0.01)No adverse effect by sample storage s from ten patients were stored at 4 °C, 25 °C, and 37 °C for 7 days
Mohamed SDried blood spot sampling for hepatitis B virus serology and molecular testingPLOS One2013France50 HBV-positive patients, 10 HBVnegative patientsDried for 18 h in room temperature15 µL on 12 mm discs (Whatman)Cobas AmpliPrep/Cobas Taqman HBV test,Cobas AmpliPrep/Co bas Taqman HBV test,Limit of detection of HBV DNA 20 IU/mL plasma, limit of detection DBS 914 IU/mL50/50 100%Correlation good between DBS and plasma (r2=0.86, P<0.001),
RossDetection of infections with hepatitis B virus, hepatitis C virus, and human immunodeficiency virus by analyses of dried blood spots – performance characteristics of the ARCHITECT system and two commercial assays for nucleic acidVirology2013Germany299 samples100 µL applied to filter paper (Whatman, Schleicher+Sch üll)Artus HBV LC PCR (Qiagen, Hilden, Germany)Artus HBV LC PCR (Qiagen, Hilden, Germany)Limit of detection 100 IU/mL in plasma, 7 samples with HBV concentrations of 409−3643 IU/mL missed100 (96−100)93 (92.9−93.1)
VinikoorHepatitis B viral load in dried blood spots: a validation study in Zambia Clinical Journal of Virology 2015Zambia68 HBs pos patients,Dried for 12 hours at room temperature50 µL applied to filter paperCOBASThe probability of a undetectable DBS result at a plasma viral load of 200 IU/mL was 13.8% (95% CI: 7.7−23.7) but this dropped to 1.8% (95% CI: 0.5−6.6) when a 2000 IU/mL threshold was used and 0.2% (95% CI: 0.03−1.7) at 20,000 IU/ml.91.2 62/68
ZhangDetection of HBV-DNA in dried bloodstains on filter paper by nested polymerase chain reaction Laboratory Medicine 2010ChinaHospital patients;60 blood samplesDBS samples at −20 °C, whole blood samples at −80 °C10−20 µL on
Whatman
In house (endpoint)In house (endpoint)All samples of 5 copies of HBV DNA per ml detectedKappa >0.7 for agreement between nested PCR and ELISA, 61% positive with whole blood sample, but only 51% with filter paperNo diagnostic accuracy or agreement calculations for whole blood against filter paper

Table 3Risk of bias of included studies

AuthorPatient selectionBiasIndex testReference standardFlow and timing
-

Was a case–control design avoided

-

Consecutive or random sample of patients

-

Inappropriate exclusions

-

Blinded to reference standard

-

Could the conduct or interpretation of the index test have introduced bias?

Blinded to index?
Could the reference standard have introduced bias?
Patient flow?
AlidjinouNR, but no case–control designURNot blinded, interpretation unbiasedLRNot blinded, interpretation unbiasedLRNRUR
AlhusseiniCase–control design, sampling NRHRNot blinded, interpretation unbiasedLRNot blinded, interpretation unbiasedLRNRUR
GuptaCase–control design, sampling NRHRNot blinded, interpretation unbiasedLRNot blinded, interpretation unbiasedLRPartly reportedLR
HalfonNRURNot blinded, NRURNot blinded, NRURNRUR
Jardi RSelection only of casesHRNot blinded, interpretation unbiasedLRNot blinded, interpretation unbiasedLRPartly reportedLR
Lira RSelection of only casesHRNot blinded, interpretation unbiasedLRNot blinded, interpretation unbiasedLRNRUR
Mohamed SCase–control designHRNot blinded, interpretation unbiasedLRNot blinded, interpretation unbiasedLRNRUR
RossNo case–control design, sampling NRHRNot blinded, interpretation unbiasedLRNot blinded, interpretation unbiasedLRFlow reportedLR
VinikoorNo case–control design, only casesHRNot blinded, interpretation unbiasedLRNot blinded, interpretation unbiasedLRFlow reportedLR
ZhangNo case–control design, sampling NRHRNot blinded, interpretation unbiasedLRNot blinded, interpretation unbiasedLRPartly reportedLR

HR: high risk of bias; LR: low risk of bias; UR: unclear risk of bias; NR: not reported

Table 4Forest plot of sensitivities and specificities of included studies

Image annex5f92.jpg

Table 5Sensitivities and specificities of included studies

StudySensitivityLower 95% confidence intervalUpper 95% confidence intervalSpecificityLower 95% confidence intervalUpper 95% confidence interval
Alhusseini/2014/in house1.000.931.001.000.691.00
Alidjinou/2012/COBAS0.960.801.00
Gupta/1992/in house0.960.850.990.870.600.98
Jardi/2004/QuiaAMP0.940.850.98
Lira/2009/QuiaAMP1.000.921.00
Mohamed/2013/COBAS0.980.891.001.000.931.00
Ross/2013/Architect0.930.860.971.000.931.00
Vinikoor/2015/COBAS0.910.820.96
Zhang/2010/in house
Combined 0.96 0.92 0.98 1.00 0.39 1.00
Heterogeneity (Chi-square): Q = 9.68, df = 7.00, P = 0.21
Inconsistency (I-square): I2 = 27.69, 95% CI = [0.00−85.52]
Heterogeneity (Chi-square): Q = 16.89, df =7.00, P = 0.02
Inconsistency (I-square): I2 = 58.56, 95% CI = [26.14 − 90.98]

Table 6Forest plot of likelihood ratios

Image annex5f93.jpg

Table 7GRADE table

Number of studiesType of studyDirectnessPrecisionConsistencyRisk of biasOverall quality
Sensitivity 96% (95% CI 92.0%−98.0%)
8 studies

(463 HBV positive among 588 samples)
Diagnostic accuracyNo significant indirectnessNo significant imprecisionSignificant inconsistencyHigh risk of bias (patient enrolment not consecutive or random in all studies; several case–control studies)Low
Specificity 100% (95% CI 54−100%)
4 studies

(125 HBV DNA neg among 588 samples)
Diagnostic accuracyNo significant indirectnessSignificant imprecision with small sample sizeSignificant inconsistencyHigh risk of bias (patient enrolment not consecutive or random in all studies; several case–control studies)Low

Appendix

iv. Bivariate vs univariate analysis

Comparing the analysis of bivariate sensitivity and specificity estimates and confidence intervals were similar. Heterogeneity was slightly lower in the univariate analysis.

Univariate sensitivity

Table A3Sensitivity of included studies in univariate analysis

Image annex5f94.jpg

Univariate specificity

Table A4Specificity of included studies in univariate analysis

Image annex5f95.jpg

v. Sources of heterogeneity – univariate analysis

Looking at heterogeneity in the different assays used, sensitivity and specificity was not different in those with commercial or in-house assays.

Different assays

Table A5Sensitivity of included studies stratified on type of assay

Image annex5f96.jpg

Table A6Specificity of included assay stratified on type of assay

Image annex5f97.jpg

References

1.
SchweitzerA, HornJ, MikolajczykRT, KrauseG, OttJJ. Estimations of worldwide prevalence of chronic hepatitis B virus infection: a systematic review of data published between 1965 and 2013. Lancet. 2015;386(10003):1546–55. [PubMed: 26231459]
2.
NICE. Diagnosis and management of chronic hepatitis B in children, young people and adults. London: National Institute for Health and Care Excellence; 2013. [PubMed: 25473721]
3.
Lira R , Maldonado-RodriguezA, Rojas-MontesO, Ruiz-TachiquinM, Torres-IbarraR, Cano-DominguezCet al. Use of dried blood samples for monitoring hepatitis B virus infection. Virol J. 2009; 6:153. [PMC free article: PMC2761391] [PubMed: 19788743]
4.
Hirtz C , LehmannS. [Blood sampling using “dried blood spot”: a clinical biology revolution underway?] Ann Biol Clin. 2015;73(1):25–37. [Article in French]. [PubMed: 25582720]
5.
Snijdewind IJM , van KampenJJA, FraaijPLA, van der EndeME, OsterhausADME, GrutersRA. Current and future applications of dried blood spots in viral disease management. Antiviral Res. 2012; 93(3): 309–21. [PubMed: 22244848]
6.
Ross RS , StambouliO, GrunerN, MarcusU, CaiW, ZhangWet al. Detection of infections with hepatitis B virus, hepatitis C virus, and human immunodeficiency virus by analyses of dried blood spots—performance characteristics of the ARCHITECT system and two commercial assays for nucleic acid amplification. Virol J. 2013;10:72. [PMC free article: PMC3599381] [PubMed: 23497102]
7.
Hickman M , McDonaldT, JuddA, NicholsT, HopeV, SKidmoreSet al. Increasing the uptake of hepatitis C virus testing among injecting drug users in specialist drug treatment and prison settings by using dried blood spots for diagnostic testing: a cluster randomized controlled trial. J Viral Hepat. 2008;15(4):250–4. [PubMed: 18086182]
8.
McAllister G , InnesH, McLeodA, DillonJF, HayesPC, FoxRet al. Uptake of hepatitis C specialist services and treatment following diagnosis by dried blood spot in Scotland. J Clin Virol. 2014;61(3):359–64. [PubMed: 25264306]
9.
Hutchinson S . Translating research into public health policy: The scottish national hepatitis C action plan. Suchtmedizin in Forschung und Praxis 2013; Conference: 3rd International Symposium on Hepatitis Care in Substance Users, Munich, Germany. Conference Start: 20130905 Conference End: 20130906. Conference Publication: (var.pagings). 15 (4): 217.
10.
Craine N , WhitakerR, PerrettS, ZouL, HickmanM, LyonsM. A stepped wedge cluster randomized control trial of dried blood spot testing to improve the uptake of hepatitis C antibody testing within UK prisons. Eur J Public Health. 2015;25(2):351–7. [PMC free article: PMC4376964] [PubMed: 25061233]
11.
Komas NP , VickosU, HubschenJM, BereA, ManirakizaA, MullerCPet al. Cross-sectional study of hepatitis B virus infection in rural communities, Central African Republic. BMC Infect Dis. 2013;13:286. [PMC free article: PMC3694350] [PubMed: 23800310]
12.
Mahfoud Z , KassakK, KreidiehK, ShamraS, RamiaS. Prevalence of antibodies to human immunodeficiency virus (HIV), hepatitis B and hepatitis C and risk factors in prisoners in Lebanon. J Infect Dev Ctries. 2010;4(3):144–9. [PubMed: 20351454]
13.
Gupta BP , JayasuryanN, JameelS. Direct detection of hepatitis B virus from dried blood spots by polymerase chain reaction amplification. J Clin Microbiol. 1992;30(8):1913–16. [PMC free article: PMC265415] [PubMed: 1500493]
14.
Lira R , Maldonado-RodriguezA, Rojas-MontesO, Ruiz-TachiquinM, Torres-IbarraR, Cano-DominguezCet al. Use of dried blood samples for monitoring hepatitis B virus infection. Virol J. 2009;6:153. [PMC free article: PMC2761391] [PubMed: 19788743]
15.
Mohamed S , RaimondoA, PenarandaG, CamusC, OuzanD, RavetSet al. Dried blood spot sampling for hepatitis B virus serology and molecular testing. PLoS One. 2013;8(4):e61077. [PMC free article: PMC3628702] [PubMed: 23613788]
16.
Greenman J , RobertsT, CohnJ, MessacL. Dried blood spot in the genotyping, quantification and storage of HCV RNA: A systematic literature review. J Viral Hepat. 2015;22 (4):353–61. [PMC free article: PMC4409077] [PubMed: 25367722]
17.
Smit PW , ElliottI, PeelingRW, MabeyD, NewtonPN. An overview of the clinical use of filter paper in the diagnosis of tropical diseases. Am J Trop Med Hyg. 2014;90 (2):195–210. [PMC free article: PMC3919219] [PubMed: 24366501]
18.
Guidelines for the prevention, care, and treatment of persons with chronic hepatitis B infection. Geneva: WHO; 2015. [PubMed: 26225396]
19.
Detection of infections with hepatitis B virus, hepatitis C virus, and human immunodeficiency virus by analyses of dried blood spots - performance characteristics of the ARCHITECT system and two commercial assays for nucleic acid amplification. Virol J2013; 10(72). [PMC free article: PMC3599381] [PubMed: 23497102]
20.
Alidjinou EK , MoukassaD, SaneF, TwagirimanaNyenyeli S, AkokoEC, MountouMVet al. Detection of hepatitis B virus infection markers in dried plasma spots among patients in Congo-Brazzaville. Diagn Microbiol Infect Dis. 2014;78(3):229–31. [PubMed: 24342801]
21.
Alhusseini NF , AbadeerMZ, El-TaherSM. Hepatitis B virus DNA can be amplified directly from dried blood spot on filter paper. Am J Biochem Biotechnol. 2012;8 (2):143–9.
22.
Halfon P , RaimondoA, OuzanD, et al. Dried blood spot for hepatitis B virus serology and molecular testing. J Hepatol. 2012; Conference: 47th Annual Meeting of the European Association for the Study of the Liver, International Liver Congress 2012 Barcelona Spain. Conference Start: 20120418 Conference End: 20120422. Conference Publication: (var.pagings). 56: S62.
23.
Jardi R , Rodriguez-FriasF, ButiM, SchaperM, ValdesA, MartinezMet al. Usefulness of dried blood samples for quantification and molecular characterization of HBV-DNA. Hepatology. 2004;40(1):133–9. [PubMed: 15239096]
24.
Zhang J , ZhangL, SongM, WangW. Detection of HBV-DNA in dried bloodstains on filter paper by nested polymerase chain reaction. Lab Med. 2010;41(9):535–9.
25.
Vinikoor MJ , ZurcherS, MusukumaK, KachuwaireO, RauchA, ChiBHet al. Hepatitis B viral load in dried blood spots: a validation study in Zambia. J Clin Virol. 2015;72:20–4. [PMC free article: PMC4959444] [PubMed: 26356987]
26.
Alidjinou EK , MoukassaD, SaneF, et al. Detection of hepatitis B virus infection markers in dried plasma spots among patients in Congo-Brazzaville. Diagnostic Microbiology and Infectious Disease2014; 78(3): 229–31. [PubMed: 24342801]
27.
Alidjinou EK , MoukassaD, SaneF, et al. Detection of hepatitis B virus infection markers in dried plasma spots among patients in Congo-Brazzaville. Diagn Microbiol Infect Dis2014; 78(3): 229–31. [PubMed: 24342801]
28.
Alidjinou EK , MoukassaD, SaneF, et al. Detection of hepatitis B virus infection markers in dried plasma spots among patients in Congo-Brazzaville. Diagnostic Microbiology and Infectious Disease2014; 78(3): 229–31. [PubMed: 24342801]

Annex 5.9.4. PICO 7 - Dried blood spots
Dried blood spots as sample collection method for hepatitis C virological testing: a systematic review and meta-analysis

Authors

; Team lead: ;1 , , and .2

Affiliations

1 Médecins Sans Frontières, Geneva. Switzerland
2 Médecins Sans Frontières, Geneva. Switzerland

Abstract

b. Introduction

The entry of new all-oral direct acting antiviral therapy for hepatitis C provides an opportunity to scale up HCV care in low- and middle-income countries. In HIV, use of dried blood spots (DBS) has facilitated the diagnosis and management of HIV in resource-poor settings. DBS may be used in a similar way to facilitate diagnosis and management of HCV. Here, we present a systematic review of the literature of DBS for HCV RNA detection to address the WHO PICOT 7 question. This is an update of the Greenman et al. 2014 paper addressing this question.

c. Methods

Following an a priori protocol, PubMed, MEDLINE and Web of Science databases were searched by two reviewers duplicating each other’s efforts. Data was extracted with the primary outcome of HCV viral load DBS test accuracy using the gold standard of a venous sample. For analysis of sensitivity and specificity, a bivariate analysis using maximum likelihood estimate and 95% confidence intervals was used. Likelihood ratios were calculated directly from the pooled sensitivity and specificity. QUADAS-2 was used to assess bias and a GRADE evaluation was performed to evaluate quality of included studies.

d. Results

The previous review found six papers eligible for inclusion and the update included three papers, one of which is in press, making for a total of nine papers eligible for inclusion. Eight studied DBS and one dried serum. The pooled sensitivity and specificity were 96.0% (upper-lower bounds 93.4–97.6) and 97.7% (upper-lower bounds 94.7–99.0), respectively. Heterogeneity was identified and a stratified analysis on capillary versus venous blood samples was performed which revealed a pooled sensitivity of 92.7% (lower-upper bounds 87.5–95.8%) and 97.4% (lower-upper bounds 95.9–98.3%) for capillary and venous samples, respectively, and pooled specificity of 97.4% (91.6–99.2%) and 98.3% (93.9–99.5%) for capillary and venous samples, respectively. Although there were insufficient data on storage conditions to perform a quantitative analysis, several papers stored DBS at ambient temperature and for prolonged periods of time. While these storage conditions did not affect accuracy, two studies found deterioration of HCV RNA in DBS samples stored at room temperature, while two others failed to detect such deterioration.

e. Discussion

These results support the potential use of DBS for HCV RNA detection. Further information is needed on the use of DBS for quantitative HCV RNA viral load when stored in DBS outside the cold chain.

1. Introduction

Globally, there are approximately 130–150 million people living with hepatitis C virus (HCV) and the majority of these live in low- and middle-income countries (LMICs).1,2 In part because of the complexity and cost of the current algorithm for diagnosis and treatment using pegylated interferon, the majority of LMICs do not support HCV programming. As a result, without accessible and effective treatment, nearly half a million people die of HCV annually.2,3 However, the more effective and tolerable oral direct-acting antivirals (DAAs) offer the opportunity to significantly simplify both the treatment and diagnostic algorithm, enabling the implementation, decentralization and scale-up of HCV care in LMICs. In order to further simplify diagnosis and monitoring of HCV, dried blood spots (DBS) may be considered.

DBS have been used to aid in the diagnosis of a wide variety of pathogens, including assessment of antibody to viral or bacterial infections such as HIV, hepatitis B, HPV and measles virus4,5 and qualitative and quantitative viral load detection in HIV.6 In particular, use of DBS in detecting and measuring HIV RNA has aided in decentralization of HIV services in low-resource areas and expanded the ability to perform early infant diagnosis for children at risk of vertical transmission.7

DBS for detection and monitoring of HCV viral load has a number of advantages. Especially salient for resource-poor settings is the possibility of using DBS to store and transport samples to a central laboratory without having to use refrigeration or dry ice, which is necessary for serum/plasma samples.810 Furthermore, plasma/serum should be processed within 6 h of venous blood draw, necessitating transportation to the laboratory within that time – an impossibility in most resource-limited settings, especially those outside urban areas. DBS can also be prepared using capillary blood, which obviates the need, seen in venipuncture, for centrifugation to separate blood cells from serum/plasma.12 In injecting drug users, venipuncture can be complicated by difficulty in finding an accessible vein and thus, capillary blood from finger-prick samples may be easier to obtain.11 DBS holds advantages over oral fluid sampling, which has also been used to detect HCV, as it has been shown that HCV RNA in saliva is independent of plasma viral load,13 and patients with low serum HCV RNA viral loads are less likely to have detectable HCV in saliva.14 Other advantages include lower cost, minimal storage facility and transportation requirements, decreased donor discomfort and decreased risk to health-care workers.10 If DBS could be used for HCV RNA detection and monitoring, it would facilitate the simplification and decentralization of HCV diagnosis and monitoring.8,11

Today a significant amount of literature supports the use of DBS as an alternative to serum/plasma obtained via venepuncture for the detection of HCV antibody,1618 yet the use DBS in the detection and monitoring of HCV RNA and genotyping HCV, especially following storage at room temperature, has not been systematically reviewed.15 To address the question of whether DBS can be used in the diagnosis of HCV in resource-limited settings, we undertook a systematic review of use of DBS for HCV RNA detection and genotyping, examining a range of storage conditions.

This review was published in the Journal of Viral Hepatitis in 2014.19 The previous review included nine papers – eight studied DBS and one studied dried serum. Two studies measured concordance between genotype and subtype determined by DBS and whole plasma and both found 100% concordance. Four studies measured end-point detection limits of HCV RNA positive samples by DBS and found sensitivity of 100% down to 250 IU/mL, 331 IU/mL, 2500 IU/mL and 24 160 IU/mL. Two studies found deterioration of HCV RNA in DBS samples stored at room temperature (10-fold reduction in HCV RNA at 4 weeks using dried serum spots and 3-fold reduction in RNA at 6 days with DBS), while two others failed to detect such deterioration.

In 2014, WHO published the first guidelines for the prevention, care and treatment of individuals with HCV infection. These guidelines focused on assessment for treatment eligibility, initiation of first-line therapies and monitoring. WHO is now undertaking guidelines for testing for chronic hepatitis B and C infection in low- and middle-income settings. A topic for consideration in these guidelines is the potential use of DBS for serological and molecular testing for HBV and HCV to facilitate access to and uptake of testing.

In order to inform these WHO guidelines, the following PICOT was developed: Among persons identified for HCV testing, what is the diagnostic accuracy and impact of detecting HCV NAT from DBS samples versus venous samples?

  • Population: Samples for HCV NAT
  • Intervention: Using DBS samples
  • Comparisons: Using plasma or serum from venous samples
  • Outcomes: Diagnostic accuracy (sensitivity, specificity, positive likelihood ratio, negative likelihood ratio, TN, TP, FN and FP).

2. Methods

The protocol used for this update is the same as that used in the Greenman et al. paper. This protocol is copied here from the Journal of Viral Hepatitis manuscript.

a. Search strategy

Using a sensitive search strategy as part of a predefined protocol (Appendix 1), we searched MEDLINE, CAB abstracts and Web of Science (ISI Citation Index) published up to August 2013 for studies meeting our pre-specified inclusion criteria. No date or geographical exclusions were applied; only English language publications were included. Following an initial screening of abstracts by two separate reviewers, full-text copies of potential eligible articles were reviewed independently by two reviewers. A title search of references was performed on articles meeting the inclusion criteria to determine potential articles for inclusion not identified during the initial database search. After all articles meeting the inclusion criteria were identified, data was abstracted by two reviewers according to prespecified categories.

b. Inclusion/exclusion criteria

We sought studies that reported on the use of dried DBS as a tool for monitoring and genotyping HCV RNA that included at least one of the following: the sensitivity and/or specificity of DBS in HCV RNA viral load quantification; the accuracy of DBS for genotyping HCV RNA; and the rate of degradation of HCV RNA during transport and storage at room temperature. Nine of the 73 articles met these criteria.

c. Data analysis

For studies measuring HCV RNA presence and quantification, studies were analysed for viral load end-point detection, sensitivity, specificity, PPV and NPV of DBS compared to HCV RNA in whole plasma. For the question of HCV RNA deterioration at room temperature in DBS, reviewers extracted reports of the rate of deterioration and the definition of “room temperature”. The results of this analysis are displayed in Table 1. Studies determining HCV genotype were analysed for measures of genotype concordance between whole plasma and DBS, proportion of HCV RNA-positive DBS samples successfully genotyped and genotypes observed.

The updated review searched Medline and PubMed with the same search terms as from the original SR, but with the limit of 2013–present.

d. Statistical data analysis – update

Statistical analysis of the data was performed using OpenMeta[Analyst]. For analysis of sensitivity and specificity, a bivariate analysis using maximum likelihood estimate and 95% confidence intervals was used. Likelihood ratios were calculated directly from the pooled sensitivity and specificity. We used forest plots to visually assess heterogeneity.

e. Risk of bias and quality assessment

The QUADAS-2 tool was used to assess risk of bias (Table 1). A GRADE assessment was performed to assess quality of included studies (Table 2).

3. Results

In the initial review search, 184 titles were identified. Seventeen were selected for full-text review. Overall, nine met eligibility criteria for the published review (Fig. 1) of which six reported on the outcomes for this PICOT, sensitivity and specificity of HCV NAT DBS versus venous samples.2025 In the review update, 14 articles were identified of which 13 underwent title and abstract review (there was one article duplication in the search). Four articles were selected for full-text review. The remainder were not selected as they did not address HCV (n=4), did not address HCV viral load (n=4) or did not include outcome data (n=1). Of the four articles selected for full-text review, two were excluded as they did not deal with HCV viral load (VL). Two were retained.26,27 One further article that has been accepted for publication was identified by an expert in the field and was included in the update.28 Two of these articles26,28 provided sufficient data to include in the meta-analysis (Fig. 2).

a. Study characteristics

The selected studies were published between 1998 and 2015; all but two were published between 2007 and 2015. Two of the studies were located in the UK, two in Italy, two in France, two in the United States and one each in Lebanon, Brazil, Guinea-Bissau and Japan. Six studies reported outcomes in terms of end-point sensitivity of HCV RNA detection using DBS when compared to plasma.2025 Four studies measured the stability of HCV RNA in DBS at room temperature (Table 1).2021,2324

b. Sample characteristics

The patient characteristics varied across studies. Five studies drew from patients attending liver clinics21,25,27,28 or in HCV treatment studies.23 One study drew from a population of injecting drug users (IDUs), one from HIV-infected patients22 and one from a general population.24 One study’s23 participants were on PEG-RBV treatment.

Finally, the preparation of DBS varied among the samples. Eight of the nine studies used DBS2128 and one used dried plasma spot.20 Three studies used capillary blood23,25,26 and five used venous blood for preparation of DBS.21,22,24,27,28 The studies used a variety of RNA extraction and elution methods, and nucleic acid amplification assays.

c. Diagnostic accuracy values

Overall, the pooled sensitivity was 96.0% (upper–lower bounds 93.4–97.6) and specificity was 97.7% (upper–lower bounds 94.7–99.0) (Figs 3 and 4). The negative and positive likelihood ratios were calculated to be 0.041 and 41.74, respectively. There was minor heterogeneity identified on the forest plots for sensitivity, with one study in particular contributing to the heterogeneity.26 This study used capillary blood; however, other studies with higher sensitivity (e.g. 25), also used capillary blood. Thus, a stratified analysis was performed on capillary versus venous samples.

i.

d. Impact of sample type

A stratified analysis looking at sample type (capillary versus venous) revealed a pooled sensitivity of 92.7% (lower–upper bounds 87.5–95.8%) and 97.4% (lower–upper bounds 95.9–98.3%) for capillary and venous samples, respectively (Fig. 5). The overall pooled specificity was 97.4% (91.6–99.2%) and 98.3% (93.9–99.5%) for capillary and venous samples, respectively (Fig. 6).

e. Impact of storage conditions

There was insufficient information to perform a meta-analysis on different storage conditions. However, from information provided in the included manuscripts, storage at room temperature or over time up to 1 year does not appear to affect sensitivity, though several studies did identify a reduction in viral yield.20,25

f. Bias and quality assessment

The QUADAS-2 revealed some risk of bias due to patient selection that was not consecutive or randomized in some studies or due to a case–control design. Otherwise, the included studies showed low risk of bias (Table 2). The GRADE table showed a moderate quality of data (Table 3).

4. Discussion

a. Overall conclusions

This systematic review and meta-analysis includes evidence of moderate quality that supports acceptable accuracy of DBS for testing HCV NAT as compared to use of plasma samples, and suggests that DBS may be used for diagnosis of HCV using HCV NAT DBS where there is limited access to venepuncture or inadequate technology to prepare and transport plasma samples. Although studies are limited, DBS is likely stable and maintains good accuracy in conditions with higher temperatures, although viral degradation may occur when storing for prolonged durations, which may affect quantitative assessment of viral load. As there are relatively little data on accuracy of DBS in real-life conditions (including high humidity), operational research will be useful to determine accuracy in such conditions.

In a stratified analysis that examined studies that used capillary blood versus those that used venous blood for DBS, capillary blood sample use resulted in somewhat lower pooled sensitivity than venous blood sample, although bounds were wide and overlapping. One study that used capillary blood examined the discordant results and found that the signal to cut-off ratio for discordant results was lower than for concordant results, suggesting that a lower cut-off may help to improve accuracy for capillary blood samples.

b. Key limitations

This review also has a number of limitations. Overall, the number of studies was small. In particular, there is a dearth of studies that systematically examines the effects of storage conditions on the accuracy of DBS; and of those that did assess this, several did not specify the exact conditions, e.g. exactly what is room temperature. This is particularly important as the majority of these studies came from high-income countries and room temperature in these areas will be very different than temperature in sub-Saharan Africa. Thus, should DBS be adopted for screening for HCV NAT, it will be important to pursue further operational research using field specimens prepared and stored in real-life conditions. Ideally, to fit operational needs, these studies should use capillary whole blood to prepare the DBS, using a commonly available type of filter paper while comparing several commercial test kits and conditions of storage.

Future work

Expanded use of HCV NAT testing will be critical to improving the diagnosis and treatment of HCV globally. The use DBS for improved preparation, storage and transport of samples for decentralized testing may help to expand the reach of this important diagnostic test.

Tables and figures

c.

Fig. 1. Flow diagram.

Fig. 1Flow diagram

d.

Fig. 2. Additional search flow diagram.

Fig. 2Additional search flow diagram

From: Moher D, Liberati A, Tetzlaff J, Altman DG, The PRISMA Group (2009). Preferred Reporting Items for Systematic Reviews and Meta-Analyses: The PRISMA Statement. PLoS Med 6(6): e1000097. doi:10.1371/journal.pmed1000097

e.

Table 1Study-level characteristics

StudyDesignStudy site and populationDBS collection methodStorage conditionsAssaySensitivity/specificityEffect of storage conditionsCut-off value
Abe
(1998)
Case–controln = 12
Japan
Plasma on Whatman filter paperRoom temperature and tested at 1, 2, 3, 4 weeksABI Prism Dye Terminator Cycle Sequencing Ready Reaction Kit (Perkin-Elmer)Sensitivity: 100%

Specificity: 100%
10-fold reduction in virus yield in 4 weeks (in 6 of 8 samples, no samples lost HCV RNA positivity)
Bennett
(2012)
Cross-sectionaln = 80
HCV antibody positive patients attending liver clinic, United Kingdom
Venous blood on Whatman 903 cardsRoom temperature, 4 °C, −20 °C, −80 °CABI 9700 and ABI 7500Sensitivity: 100% (57/57)

Specificity: 95.7% (22/23)
No significant variation in cycle threshold over 1 year (2 DBS from 1 patient)Suggested: 150 −250 IU/mL
De Cringis
(2010)
Case–controln=25
13 HIV–HCV coinfected
4 HIV monoinfected
3 HCV
5 healthy blood donors Italy
50 uL venous blood on Whatman No. 3 cardStored at −80 °CHIV-1/HCV multiplex SYBR Green real-time RT-PCR assaySensitivity: 93.8% (15/16)

Specificity: 100% (9/9)
Dukobo
(2014)
Cross sectionaln=132
Adult (18−30 years) active IDU in San Francisco
Capillary blood on Whatman 903 cardsdHCV TMA (Norvatis)Sensitivity: 89.6% (95% CI 77.8−95.5)

Specificity: 100% (95% CI 95.6−100)
Tejada-Strop
(2015)
Case–controln=33
Adult patients with chronic hepatitis C at the Liver Clinic of the University of California, San Francisco
Venous samples on Whatman 903 paper (GE Healthcare)Control: DBS freshly prepared

Long-term storage: 5 years at −20C
Superscipt III Platinum 1 Step qRT-PCR kitControl
Sensitivity: 88%
Specificity: 100%

Long-term storage
Sensitivity: 33%
Specificity: 100%
Soulier
(2015)
Case–controln=511

315 adults with HCV-Abpositive chronic hepatitis C

26 adults with HCV-Abpositive resolved infection

170 adults HCV-Abnegative

France
Venous samples on Whatman 903 paper (GE Healthcare)−80 °C with desiccant packageCobasAmpliprep/CobasTaq Man HCV version 2 (CAP/CTM v2.0, Roche Molecular Systems) and m2000 platform (Abbott Molecular)CAP/CTM v2
Sensitivity: 97.1% (94.7%−98.5%)

Specificity: 100% (97.8%-100%)

M200
Sensitivity: 98.1% (95.9%−99.1%)

Specificity: 100% (97.8%−100%)
SantosCross-sectionaln = 100
HCV chronically infected patients in a PEG-RBV study at 4 (n = 100) and 24 (n = 68) weeks posttreatment initiation Brazil
Capillary blood on SS903 collection cards (Schleicher and Schuell, Keene, NH, USA)Room temperaturepCR-II-TOPO plasmid (Invitrogen)Sensitivity: 98.0% (99/101)

Specificity: 94.0% (63/67)
Solmone
(2002)
Cross-sectionaln = 55
Residual samples from patients undergoing routine haematological controls (39 HCV antibody (Ab)–positive and 16 HCV Ab-negative patients) Italy
50 uL EDTA venous blood on SS903 cardSubset of 16 paired samples stored at room temperature and tested every 2−4 weeks over 11 monthsIn-house RT-PCRSensitivity: 100% (124/124) Specificity: 100% (24/24)No loss of positivity after 11 months (16 paired samples)
Tuallion
(2009)
Case–controln = 200
100 anti-HCV-positive and 100 anti-HCV-negative France
3 drops (50 lL) capillary blood on Whatman 903 cardStored at −20 °C for 1−8 weeks until useCobasAmpliprep Total Nucleic Acid Isolation 100 kit (Roche); CobasTaqMan HCV test and real-time PCR COBAS TaqMan 48 instrument plus COBAS Ampliprep analyzer (Roche); One Step RT-PCR kit from Qiagen (Qiagen)3-fold decrease in RNA in 6 days (No. of samples not reported)

f.

Fig. 3. Forest plot of sensitivity.

Fig. 3Forest plot of sensitivity

g.

Fig. 4. Forest plot of specificity.

Fig. 4Forest plot of specificity

h.

Fig. 5. Forest plot of sensitivity of capillary and venous samples.

Fig. 5Forest plot of sensitivity of capillary and venous samples

i.

Fig. 6. Forest plot of specificity of capillary and venous samples.

Fig. 6Forest plot of specificity of capillary and venous samples

j.

Table 2QUADAS-2

AuthorPatient selectionIndex testReference standardFlow and timing
AbeHRLRLRLR
BennetLRLRLRLR
De CrignisHRLRLRLR
DokuboLRLRLRLR
SantosHRHRLRLR
SolomeHRLRLRLR
SoulierHRLRLRLR
Tejada-StropHRHRLRLR
TuaillonHRLRLRLR

HR: high risk; LR: low risk

k.

Table 3GRADE table

Number of studiesType of studyDirectnessPrecisionConsistencyRisk of biasOverall quality
Sensitivity of DBS for HCV VL: 96.0% (upper-lower bounds 93.4−97.6)
9 studies

1335 samples
Cross-sectional, case–control or cohortNo significant indirectnessNo significant imprecisionNo significant inconsistencySignificant risk of bias (non-randomized or consecutive patient recruitment or casecontrol design)Moderate
Specificity of DBS for HCV VL: 97.7% (upper-lower bounds 94.7–99.0)
9 studies

1335 samples
Cross-sectional, case–control or cohortNo significant indirectnessNo significant imprecisionNo significant inconsistencySignificant risk of bias (non-randomized or consecutive patient recruitment or casecontrol design)Moderate

References

1.
Mohd Hanafiah K , GroegerJ, FlaxmanAD, WiersmaST. Global epidemiology of hepatitis C virus infection: new estimates of age-specific antibody to HCV seroprevalence. Hepatology. 2013;57(4):1333–42. [PubMed: 23172780]
2.
Hepatitis C factsheet. Geneva: World Health Organization; 2014 (http://www​.who.int/mediacentre​/factsheets/fs164/en/, accessed 07 June 2016).
3.
Global policy report on the prevention and control of viral hepatitis. Geneva: World Health Organization; 2013 (http://apps​.who.int/iris​/bitstream/10665​/85397/1/9789241564632_eng.pdf, accessed 07 June 2016).
4.
Parker SP , CubittWD. The use of the dried blood spot sample in epidemiological studies. J Clin Pathol. 1999;52(9):633–9. [PMC free article: PMC501537] [PubMed: 10655983]
5.
Waterboer T , DondogB, MichaelKM, MichelA, SchmittM, VaccarellaS, et al. Dried blood spot samples for seroepidemiology of infections with human papillomaviruses, Helicobacter pylori, and hepatitis C virus. Cancer Epidemiol Biomark Prev. 2012;21(2):287–93. [PubMed: 22147363]
6.
Johannessen A , GarridoC, ZahoneroN, SandvikL, NamanE, KivuyoSL, et al. Dried blood spots perform well in viral load monitoring of patients who receive antiretroviral treatment in rural Tanzania. Clin Infect Dis. 2009;49(6):976–81. [PubMed: 19663598]
7.
Sherman GG , StevensG, JonesSA, HorsfieldP, StevensWS. Dried blood spots improve access to HIV diagnosis and care for infants in low-resource settings. J Acquir Immune Defic Syndr. 2005;38(5):615–7. [PubMed: 15793374]
8.
Solmone M , GirardiE, CostaF, PucilloL, IppolitoG, CapobianchiMR. Simple and reliable method for detection and genotyping of hepatitis C virus RNA in dried blood spots stored at room temperature. J Clin Microbiol. 2002;40(9):3512–4. [PMC free article: PMC130818] [PubMed: 12202607]
9.
De Crignis E , ReMC, CimattiL, ZecchiL, GibelliniD. HIV–1 and HCV detection in dried blood spots by SYBR Green multiples real-time PCR. J Virol Methods. 2010;165(1):51–6. [PubMed: 20045028]
10.
McDade TW , WilliamsS, SnodgrassJJ. What a drop can do: dried blood spots as a minimally invasive method for integrating biomarkers into population-based research. Demography. 2007;44(4):899–925. [PubMed: 18232218]
11.
Hickman M , McDonaldT, JuddA, NicholsT, HopeV, SkidmoreS, et al. Increasing the uptake of hepatitis C virus testing among injecting drug users in specialist drug treatment and prison settings by using dried blood spots for diagnostic testing: a cluster randomized controlled trial. J Viral Hepat. 2008;15(4):250–4. [PubMed: 18086182]
12.
Santos C , ReisA, Dos SantosCV, DamasC, SilvaMH, VianaMV, et al. The use of real-time PCR to detect hepatitis C virus RNA in dried blood spots from Brazilian patients infected chronically. J Virol Methods2012;179(1):17–20. [PubMed: 21871496]
13.
Lins L , AlmeidaH, VitviskL, CarmoT, ParanaR, ReisMG. Detection of hepatitis C virus RNA in saliva is not related to oral health status or viral load. J Med Virol. 2005;77(2):216–20. [PubMed: 16121379]
14.
Suzuki T , OmataK, SatohT, MiyasakaT, AraiC, MaedaM, et al. Quantitative detection of hepatitis C virus (HCV) RNA in saliva and gingival crevicular fluid of HCV-infected patients. J Clin Microbiol. 2005;43(9):4413–7. [PMC free article: PMC1234063] [PubMed: 16145085]
15.
Snijdewind I , van KampenJ, FraaijP, van der EndeME, OsterhausAD, GrutersRA. Current and future applications of dried blood spots in viral disease management. Antiviral Res. 2012;93(3):309–21. [PubMed: 22244848]
16.
Parker SP , CubittWD, AdesAE. A method for the detection and confirmation of antibodies to hepatitis C in dried blood spots. J Virol Methods. 1997;68(2):199–205. [PubMed: 9389410]
17.
Judd A , ParryJ, HickmanM, McDonaldT, JordanL, LewisK, et al. Evaluation of a modified commercial assay in detecting antibody to hepatitis C virus in oral fluids and dried blood spots. J Med Virol. 2003;71(1):49–55. [PubMed: 12858408]
18.
Parker SP , KhanHI, CubittWD. Detection of antibodies to hepatitis C virus in dried blood spot samples from mothers and their offspring in Lahore, Pakistan. J Clin Microbiol. 1999;37(6):2061–3. [PMC free article: PMC85032] [PubMed: 10325381]
19.
Greenman J , RobertsT, CohnJ, MessacL. Dried blood spot in the genotyping, quantification and storage of HCV RNA: a systematic literature review. J Viral Hepat. 2015;22(4):353–61. [PMC free article: PMC4409077] [PubMed: 25367722]
20.
Abe K , KonomiN. Hepatitis C virus RNA in dried serum spotted onto filter paper is stable at room temperature. J Clin Microbiol. 1998;36(10):3070–2. [PMC free article: PMC105116] [PubMed: 9738072]
21.
Bennett S , GunsonR, McAllisterG, HutchinsonSJ, GoldbergDJ, CameronSO, et al. Detection of hepatitis C virus RNA in dried blood spots. J Clin Virol. 2012;54(2):106–9. [PubMed: 22418454]
22.
De Crignis E , ReMC, CimattiL, ZecchiL, GibelliniD. HIV–1 and HCV detection in dried blood spots by SYBR Green multiples real-time PCR. J Virol Methods. 2010;165(1):51–6. [PubMed: 20045028]
23.
Santos C , ReisA, Dos SantosCV, DamasC, SilvaMH, VianaMV, et al. The use of real-time PCR to detect hepatitis C virus RNA in dried blood spots from Brazilian patients infected chronically. J Virol Methods. 2012;179(1):17–20. [PubMed: 21871496]
24.
Solmone M , GirardiE, CostaF, PucilloL, IppolitoG, CapobianchiMR. Simple and reliable method for detection and genotyping of hepatitis C virus RNA in dried blood spots stored at room temperature. J Clin Microbiol. 2002;40(9):3512–4. [PMC free article: PMC130818] [PubMed: 12202607]
25.
Tuaillon E , MontainA, MerouehF, OttomaniL, PicotMC, NagotN, et al. Dried blood spot for hepatitis C virus serology and molecular testing. Hepatology. 2010;51(3):752–8. [PubMed: 20043287]
26.
Dokubo EK , EvansJ, WinkelmanV, CyrusS, ToblerLH, AsherA, et al. Comparison of hepatitis C Virus RNA and antibody detection in dried blood spots and plasma specimens. J Clin Virol. 2014;59(4):223–7. [PMC free article: PMC4026019] [PubMed: 24529844]
27.
Tejada-Strop A , DrobeniucJ, Mixson-HaydenT, ForbiJC, LeNT, LiL, et al. Disparate detection outcomes for anti-HCV IgG and HCV RNA in dried blood spots. J Virol Methods. 2015;212:66–70. [PubMed: 25445800]
28.
Soulier A , PoiteauL, RosaI, HezodeC, Roudot-ThoravalF, PawlotskyJM, et al. Dried blood spots: a tool to ensure broad access to hepatitis C screening, diagnosis and treatment monitoring. J Infect Dis. 2016;213(7):1087–95. [PubMed: 26333945]

Appendix 1. Terms used in database searches

MEDLINE-International Database for Medical Literature

Dried blood spot [Ab] AND Hepatitis C [Ab]

Dried plasma spot [Ab] AND Hepatitis C [Ab]

Dried blood spot [Ab] AND HCV RNA [Ab]

Dried plasma spot [Ab] AND HCV RNA [Ab]

Dried blood spot [Ab] AND HCV [Ab] AND genotype [Ab]

Dried plasma spot [Ab] AND HCV [Ab] AND genotype [Ab]

Dried blood spot [Ab] AND HCV RNA [Ab] AND storage [Ab]

Dried plasma spot [Ab] AND HCV RNA [Ab] AND storage [Ab]

Web of Science (ISI Citation Index)

Dried blood spot [topic] AND Hepatitis C [topic]

Dried plasma spot [topic] AND Hepatitis C [topic]

Dried blood spot [topic] AND HCV RNA [topic]

Dried plasma spot [topic] AND HCV RNA [topic]

Dried blood spot [topic] AND HCV [topic] AND genotype [topic]

Dried plasma spot [topic] AND HCV [topic] AND genotype [topic]

Dried blood spot [topic] AND HCV RNA [topic] AND storage [Ab]

Dried plasma spot [topic] AND HCV RNA [topic] AND storage [Ab]

CAB abstracts

Dried blood spot [all fields] AND Hepatitis C [all fields]

Dried plasma spot [all fields] AND Hepatitis C [all fields]

Dried blood spot [all fields] AND HCV RNA [all fields]

Dried plasma spot [all fields] AND HCV RNA [all fields]

Annex 5.10. PICO 8 - Diagnostic accuracy of HBsAg/HBeAg test versus NAT to confirm successful treatment response: a meta-analysis and review of the literature

Authors

; Team lead: , ,* , , , , , , and .

Affiliations

1 London School of Hygiene and Tropical Medicine team
* Co-leaders of this Review

1. Executive summary

Background: Advances in hepatitis B virus detection technology create new opportunities for enhancing screening, referral and treatment. The purpose of this review was to determine the diagnostic accuracy of HBsAg or HBeAg test versus nucleic acid testing (NAT) to confirm successful treatment response among patients receiving treatment for HBV.

Method: A literature search was conducted focused on hepatitis B, diagnostic tests and diagnostic accuracy. Studies were included if they evaluated an assay to determine the sensitivity and specificity of a HBsAg or HBeAg test compared to a quantitative HBV RNA reference among humans. Two reviewers performed a quality assessment of the studies and extracted data for estimating test accuracy.

Results: It was found that, despite HBV NAT being considered the gold standard in confirming response to treatment, both HBsAg and HBeAg were useful in monitoring patients receiving treatment as in many resource-limiting settings NAT is not readily available. Studies showed that the kinetics of HBsAg and HBV DNA followed similar profiles during treatment with pegylated interferon (PEG-IFN) and follow up in patients who developed sustained virological response (SVR). Further studies determined that this correlation was present for all four genotypes. It was also reported that HBsAg quantification can allow for detection of active cases of chronic HBV from true inactive carriers, therefore reducing the need to rigorously monitor HBV DNA levels. Studies showed that HBeAg was capable of differentiating late responders from non-responders to HBV DNA after 24 weeks of treatment.

Conclusions: There is limited evidence for the sole use of HBsAg or HBeAg compared to HBV DNA for monitoring treatment response. More studies are needed to determine which tests for HBV antigen detection may be useful as a marker of treatment response for which therapeutic agent.

2. Background

An estimated 240 million individuals worldwide1 are chronically infected with hepatitis B virus (HBV) and there are an estimated 4 million acute HBV infections each year. Of those with chronic hepatitis B infection, 20–30% will develop cirrhosis2 or hepatocellular carcinoma,3 leading to approximately 650 000 deaths each year.4 However, most individuals with chronic HBV infection are not aware of their serostatus, contributing to delayed diagnosis and complications from advanced disease.5 HBV testing is critically important in order to refer infected individuals to HBV treatment and care, to refer uninfected individuals to vaccination and to mobilize prevention and control efforts.

The introduction of NAT is an integral step in the control of the disease as it allows for rapid diagnosis and early treatment of HBV. The virus can be transmitted by blood from asymptomatic donors with acute HBV infection before the development of HBsAg or an anti-HBc response. Therefore, NATs can used to detect HBV DNA in a donor’s blood before antigen or antibody response are detected.6 Though NAT testing has been proven to be more sensitive in detecting viral infections, serological testing is better suited for the detection of active infections.7

Treatment with tenofovir or entecavir is effective for HBV. Their efficacy can be measured by a sustained reduction in viral load, but the quantitative HBsAg response may remain high. The data for measuring HBsAg quantitatively largely works for interferon-based agents. Locarini reviewed the literature on quantitative HBsAg in hepatology and highlighted some of the challenges of quantitative HBsAg testing in using other therapeutic agents.

In March 2015, the World Health Organization (WHO) published the first guidelines for the prevention, care and treatment of individuals with chronic HBV infection.5 These guidelines focused on assessment for treatment eligibility, initiation of first-line therapies, switching and monitoring. These initial guidelines did not include screening recommendations. Given the large burden of HBV in low- and middle-income settings where there are limited or no existing HBV testing guidelines, there is a substantial need for HBV testing guidelines.

Advances in HBV detection technology create new opportunities for enhancing screening, referral and treatment. Previous systematic reviews on hepatitis B infection have focused on immunological responses,7 surveillance of cirrhosis8 and treatment.9 Existing systematic reviews1013 on hepatitis B testing focused on point-of-care (POC) tests and included tests with unclear reference standards. No systematic reviews have examined the diagnostic accuracy of using HBsAg/HBeAg compared to HBV DNA detection to monitor treatment response.

PICO 8Among patients receiving treatment for HBV, what is the diagnostic accuracy of HBsAg/HBeAg test versus NAT to confirm successful treatment response?
PPatients receiving treatment for HBV
IHBsAg/HBeAg testing
CNAT for HBV DNA detection
ODiagnostic accuracy
True negatives (TNs) – who are screen negative and have cleared the HBV infection.
False negatives (FN) – who are screen negative but have HBV infection. These will be misclassified and treatment will be stopped resulting in disease progression leading to liverrelated morbidity (fibrosis, cirrhosis, end-stage liver disease, hepatocellular carcinoma), progression of liver disease and mortality.
True positives (TP) – who are screen positive and truly have HBV infection. This will increase the number of treated cases and cure rate.
False positives (FP) – who are screen positive, but do not have HBV infection. (These will continue treatment inappropriately, and and will have unnecessary referral).
Costs – cost of testing strategy, including lab reagents and running costs, cost of further evaluation of a false positive.
Cost–effectiveness
Acceptability to health-care workers and patients
Other outcomes (missed cases of liver disease because of false-negative results, unnecessary referral, investigations and/or treatment in false positives).

3. Objectives

The purpose of this review was to identify evidence on the sensitivity and specificity of HBsAg/HBeAg compared to HBV DNA detection for HBV treatment monitoring and to summarize the key test characteristics associated with detection of HBsAg/HBeAg.

4. Methodology

We followed standard guidelines and methods for systematic review and meta-analyses of diagnostic tests.14,15 We prepared a protocol for the literature search, article selection, data extraction and assessment of methodological quality.

Selection criteria

i. Types of studies

We included observational studies and randomized controlled trials (RCTs) that provide original data from patient specimens, including cross-sectional and case–control studies, and studied HBsAg/HBeAg testing compared to a reference standard of HBV DNA detection.

ii. Participants

Little information on participants was provided in the selection of papers included in the systematic review; therefore, we set a wide inclusion criterion. We included patients of all age groups from all settings and countries as well as all types of specimens.

iii. Index tests

Studies that utilized commercially available HBsAg/HBeAg and HBV DNA assays were eligible for inclusion. The following four are the index tests included:

  • Architect HBsAg assays, Abbott
  • COBAS AMPLICOR TM HBV Test v2.0 assay. Roche Diagnostics Systems
  • IMx HBeAg assay, Abbott
  • Iprobe, Abbott

iv. Reference standard

The reference standards acceptable for a definitive diagnosis included tests for detection of HBV by the following HBV DNA detection techniques—polymerase chain reaction (PCR), branched-chain DNA (bDNA), or transcription-mediated amplification (TMA) and DNA hybridization assays.

Outcome measures

Sensitivity refers to the proportion of samples with true HBV infection diagnosed with positive HBsAg/HBeAg test confirmed with a positive HBV DNA detection method.

Specificity refers to the proportion of samples with negative HBsAg/HBeAg test confirmed with a negative HBV DNA detection method.

Search methods

A database search of LILACS, MEDLINE, EMBASE, PubMed, Scopus, Web of Science, Cochrane and WHO Global Index Medicus was performed through April 2015. No language restriction was applied. The references of published articles found in the above databases were searched for additional pertinent materials.

Study selection proceeded in three stages. First, titles/abstracts were screened by a single reviewer according to standard inclusion and exclusion criteria. Second, full manuscripts were obtained and assessed against inclusion criteria. Papers were accepted or rejected and reasons for rejection were specified. Third, two independent reviewers assessed each manuscript and differences were resolved by a third independent reviewer.

Data extraction

Information on the following variables were extracted by a reviewer if the study met the exclusion and inclusion criteria—first author, total sample size, country (and city) of sampling, sample type (oral fluid, finger-prick, venous blood, etc.), point-of-care (Y/N), eligibility criteria, reference standard, manufacturer, raw cell numbers (true positives, false negatives, false positives, true negatives), sources of funding and reported conflicts of interest. We define point of care as being able to give a result within 60 min and having the results guide clinical management at the same encounter.

Assessment of methodological quality

Study quality was evaluated using the QUADAS-2 tool,16 the STARD checklist17 and the GRADE method.18 QUADAS includes domains to evaluate bias in the following categories—risk of bias (patient selection, index test, reference standard, flow and timing); applicability concerns (patient selection, index test, reference standard). The GRADE method evaluates the strength of evidence by assessing the risk and probability of bias, imprecision and inconsistency as well as dose– respondent gradient and residual confounding.18

5. Results

PRISMA flowchart

Fig. 1. PRISMA flow diagram outlining study selection examining diagnostic accuracy of HBV antibody tests compared to HBV DNA in confirming successful treatment response.

Fig. 1PRISMA flow diagram outlining study selection examining diagnostic accuracy of HBV antibody tests compared to HBV DNA in confirming successful treatment response

Characteristics of included studies

Only two of the studies analysed met the PICO criteria and data were extracted from both these studies. These studies took place in Sweden and the United States of America. The patient population for the Larsson 2013 study was derived from a clinical setting; there was no information on the patient population for the Perrillo 1993 study. The assays evaluated for this systematic review were Architect HBsAg assays, COBAS AMPLICOR TM HBV Test v2.0 assay, IMx HBeAg assay and Iprobe. Of these two studies, only one reported sensitivity/specificity of HBsAg and one reported sensitivity/specificity of HBeAg.

The lack of information on these diagnostic accuracy measures is a large limitation in the quality of the studies. Other issues with the quality of these studies were insufficient information on the populations studied, randomization and sample collection.

Table 1Description of study design, study population and setting of all studies (n=2)

First authorSample type & sizeCountryTreatmentStudy populationEligibility criteriaIndex diagnostic testReference testSensitivitySpecificity
1Larrson, 2013Liver tissue and blood sample N= 160SwedenINFInfectious Disease clinic N =160Patients with chronic HBVArchitect HBsAg assays, AbbottCOBAS AMPLICORT M HBV Test v2.0 assay. Roche34%89%
3Perrillo, 1993Plasma N= 34United States of AmericaINF?29 patients on treatment and 5 neg. controlsIMx HBeAg assay, AbbottIprobe, Abbott95%44%

Larsson et al. (2013) monitored HBsAg levels (Architect assays, Abbott) and HBV DNA quantitation (COBAS AMPLICORTM HBV monitor, Roche) in 160 patients treated for chronic HBV infection at the Infectious Disease Clinic at Sahlgrenska University Hospital between 1993 and 1995. Sensitivity of HBsAg compared to HBV DNA was 34% and the specificity was 89%. A correlation between HBsAg and HBV DNA in serum samples (R2 = 0.39; P< 0.0001) was also noted, in that a 90% reduction of HBV DNA corresponded to a 48% decline in HBsAg. The authors also measured HBeAg levels and found that HBeAg-positive patients had a 300 times higher HBV DNA/HBsAg ratio compared to those who were HBeAg-negative. These results indicate that HBsAg quantification could be complementary to HBV DNA quantification for treatment monitoring and confirming successful treatment response.

Perrillo et al. (1993) evaluated whether the HBeAg assay (Abbott IMX) was capable of providing comparable information to HBV DNA assays (Iprobe, Abbott) during and after IFN therapy in 29 consecutive, IFN-treated patients and five untreated controls. The authors found that decremental and incremental changes in HBeAg concentration during and after therapy mirrored those observed with HBV DNA with a significant correlation (R = 0.768 P>0.0001). Only 56% of HBV DNA-negative patients tested positive for HBeAg but 95% of HBV DNA-positive samples were also positive for HBeAg. Though this information allows us to understand that HBeAg concentrations can provide similar clinically relevant information compared to HBV DNA assays, it is difficult to state the accuracy of these tests against each other as they are traditionally used to measure different indicators.

Narrative summary of each systematic review’s findings

Monitoring response to treatment is an essential mechanism in the control of HBV and requires both the sustained disappearance of HBV DNA and the clearance of HBsAg/HBeAg from the blood. The systematic review showed that monitoring of HBeAg concentration can provide clinically relevant information, though only two of the 6464 studies identified for screening (Larrson et al. 2013 and Perrillo et al. 1993) were included in the systematic review as they were the sole articles that met both the inclusion and exclusion criteria for PICO 8 (showed sensitivity and specificity of assays).

i. Diagnostic accuracy of nucleic acid testing

HBV DNA is essential when determining the presence of the virus as it is quantitatively expressed and allows for prompt detection of HBV. With the advent of reverse transcriptase-polymerase chain reaction (RT-PCR), it quickly became regarded as the gold standard or confirming response to therapy due to its accuracy and cost–effectiveness. However, in many resource-limited settings, such assays are not widely available, therefore it is important to determine if HBsAg or HBeAg can be used for monitoring response to treatment.19

ii. Diagnostic accuracy of HBsAg test compared to HBV DNA

Although they did not include specific accuracy values, three supplemental studies provided useful information on the quantitation of HBsAg for treatment monitoring in chronic HBV patients. Martinot-Peignoux et al. (2015) reported that the kinetics of HBsAg and HBV DNA followed similar profiles during treatment with PEG-IFN and follow up in patients who developed SVR (solid line) (see Fig. 2).18

Fig. 2. Serum HBV DNA and HBsAg kinetics during treatment with PEG-IFN and follow up in patients who developed SVR (solid line).

Fig. 2Serum HBV DNA and HBsAg kinetics during treatment with PEG-IFN and follow up in patients who developed SVR (solid line)20

This was confirmed by Ganji et al. (2011) who that showed HBsAg had strong correlation with HBV DNA (r =0.69; P<0.01) for both genotypes investigated.20 Larsson et al. 2014 further proved that that there was a correlation between HBsAg and HBV DNA for all four genotypes (Fig. 3).19 This highlights the potential for HBsAg to be a useful serological marker to predict response to treatment.

Fig. 3 (A-D). Correlation between HBsAg and HBV DNA in genotypes A–D.

Fig. 3 (A-D)Correlation between HBsAg and HBV DNA in genotypes A–D

Fig. 3 (E). Box plot of HBsAg levels in HBeAg-positive and -negative patients by genotype (no significant differences).

Fig. 3 (E)Box plot of HBsAg levels in HBeAg-positive and -negative patients by genotype (no significant differences)19

Another important use for HBsAg assays is in monitoring treatment response for HBeAg-negative chronic patients with low HBV DNA levels. Sonneveld et al. (2011) reported that when monitoring PEG-IFN treatment in patients with chronic hepatitis B, HBsAg reduction is most pronounced in patients who achieve a response to therapy at 6 months post treatment.19 This suggests that HBsAg quantification can allow for detection of active cases of chronic HBV from true inactive carriers, thereby reducing the need to rigorously monitor HBV DNA levels.

Fig. 4. Hepatitis B surface antigen decline during PEG-IFN treatment of hepatitis B e antigen (HBeAg)-positive and HBeAg-negative patients26.

Fig. 4Hepatitis B surface antigen decline during PEG-IFN treatment of hepatitis B e antigen (HBeAg)-positive and HBeAg-negative patients26

iii. Diagnostic accuracy of HBeAg test compared to HBV DNA

Monitoring HBeAg has been shown to be important due to its association with the disappearance of replicative viral intermediates and its persistence in the blood once HBV DNA has cleared.19 Using PEG-IFN alfa-2a, Fried et al. (2008) showed that HBeAg levels proved to be a stronger indicator of non-response compared to HBV DNA after 24 weeks of treatment. Lower levels of HBV DNA were seen to closely predict seroconversion (Table 2).

Table 2Serum HBV DNA at weeks 12 and 24 of treatment: relationship to HBeAg seroconversion

HBV DNA (log10 copies/mL)Patients with HBeAg Seroconversion at Week 72
Week 12Week 24
<364%69%
3–549%41%
5–729%19%
≥721%14%

It was also shown that those who reached HBeAg seroconversion had a consistent decline in their levels of HBeAg and remained at the lowest levels while under the follow-up period. This was in contrast to those who failed to achieve seroconversion after treatment was discontinued, as a rebound was observed allowing for better determining of seroconversion and a higher negative predictive value (Fig. 5). This highlights the importance of HBeAg in differentiating late responders from non-responders and is an important aspect of treatment.22

Fig. 5. HBV DNA levels: responders versus non-responders at 24 weeks post treatment – HBeAg seroconversion.

Fig. 5HBV DNA levels: responders versus non-responders at 24 weeks post treatment – HBeAg seroconversion23

However, monitoring treatment response using HBeAg can be complicated as the response may vary with the therapy used. Non-interferon agents rarely cause HBeAg loss or might cause only a transient HBeAg loss while on therapy. Interferon agents are toxic and might convert ~35% of HBeAg positives to negatives but only in a subset of people with high alanine aminotransferase (ALT).23

Monitoring HBV treatment response remains a challenge. Guidelines for chronic HBV management and treatment state that the ideal end-point of treatment should be dictated by a lack of detectable HBsAg. The use of HBsAg/HBeAg as a marker to detect sustained virological response is essential, because on-treatment decrease in HBV DNA shows similar patterns for both sustained responders and relapsers (Fig. 3).20 Due to the infrequency of obtaining this point with the current anti-HBV agents, the primary goal of antiviral therapy is defined as viral remission, PCR non-detectability (<300 copies/mL [57 IU/mL]).19,21

For the time being, NAT can be used as the reference standard to confirm this response to therapy. More studies are needed to determine which tests for HBV antigen detection may be useful as effective markers of treatment response for therapeutic agents.

References

A. Reference list of studies that met criteria for inclusion in the analysis

1.
Larsson R , EilardA, MalmströmS, HannounC, DhillonAP, NorkransG, et al. HBsAg quantification for identification of liver disease in chronic hepatitis B virus carriers. Liver Int. 2014;34(7):238–45. [PubMed: 24118747]
2.
Perrillo R , MimmsL, SchechtmanK, RobbinsD, CampbellC. Monitoring of antiviral therapy with quantitative evaluation of HBeAg: a comparison with HBV DNA testing. Hepatology. 1993;18(6):1306–12. [PubMed: 8244253]

B. Reference list from background

1.
Ott JJ , StevensGA, GroegerJ, WiersmaST. Global epidemiology of hepatitis B virus infection: new estimates of age-specific HBsAg seroprevalence and endemicity. Vaccine. 2012;30(12):2212–19. [PubMed: 22273662]
2.
Ganem D , PrinceAM. Hepatitis B virus infection – natural history and clinical consequences. N Engl J Med. 2004;350(11):1118–29. [PubMed: 15014185]
3.
Fattovich G , StroffoliniT, ZagniI, DonatoF. Hepatocellular carcinoma in cirrhosis: incidence and risk factors. Gastroenterology. 2004;127(5Suppl 1):S35–S50. [PubMed: 15508101]
4.
Lozano R , NaghaviM, ForemanK, LimS, ShibuyaK, AboyansV, et al. Global and regional mortality from 235 causes of death for 20 age groups in 1990 and 2010: a systematic analysis for the Global Burden of Disease Study 2010. Lancet. 2012;380(9859):2095–128. [PubMed: 23245604]
5.
Guidelines for the Prevention, Care, and Treatment of Persons with Chronic Hepatitis B Infection. Geneva: World Health Organization; 2015 (http://apps​.who.int/iris​/bitstream/10665​/154590/1/9789241549059_eng​.pdf?ua=1&ua=1, accessed 06 June 2016). [PubMed: 26225396]
6.
Krajden M , McNabbG, PetricM. The laboratory diagnosis of hepatitis B virus. Can J Infect Dis Med Microbiol. 2005;16(2):65–72. [PMC free article: PMC2095015] [PubMed: 18159530]
7.
Stramer SL , WendU, CandottiD, FosterGA, HollingerFB, DoddRY, et al. Nucleic acid testing to detect HBV infection in blood donors. N Engl J Med. 2011;364(3):236–47. [PubMed: 21247314]
8.
Fabrizi F , MartinP, DixitV, BunnapradistS, DulaiG. Meta-analysis: the effect of age on immunological response to hepatitis B vaccine in end-stage renal disease. Aliment Pharmacol Ther. 2004;20(10):1053–62. [PubMed: 15569107]
9.
Thompson Coon J , RogersG, HewsonP, WrightD, AndersonR, CrampM, et al. Surveillance of cirrhosis for hepatocellular carcinoma: systematic review and economic analysis. Health Technol Assess. 2007;11(34):1–206. [PubMed: 17767898]
10.
Qin XK , LiP, HanM, LiuJP. [Xiaochaihu Tang for treatment of chronic hepatitis B: a systematic review of randomized trials]. [Article in Chinese]. Zhong Xi Yi Jie He Xue Bao. 2010;8(4):312–20. [PubMed: 20388470]
11.
Hwang SH , OhHB, ChoiSE, KimHH, ChangCL, LeeEY, et al. [Meta-analysis for the pooled sensitivity and specificity of hepatitis B surface antigen rapid tests]. [Article in Korean]. Korean J Lab Med. 2008;28(2):160–8. [PubMed: 18458514]
12.
Shivkumar S , PeelingR, JafariY, JosephL, PaiNP. Rapid point-of-care first-line screening tests for hepatitis B infection: a meta-analysis of diagnostic accuracy (1980–2010). Am J Gastroenterol. 2012;107(9):1306–13. [PubMed: 22641308]
13.
Khuroo MS , KhurooNS, KhurooMS. Accuracy of rapid point-of-care diagnostic tests for hepatitis B surface antigen – systematic review and meta-analysis. J Clin Exp Hepatol. 2014;4(3):226–40. [PMC free article: PMC4284203] [PubMed: 25755565]
14.
CRD’s guidance for undertaking reviews in health care. York: Centre for Reviews and Dissemination; 2008.
15.
Pai M , MccullochM, Gorman, JD, PaiN, EnanoriaW, KennedyG, et al. Systematic reviews and meta-analyses: an illustrated, step-by-step guide. Natl Med J India. 2004;17(2):86–95. [PubMed: 15141602]
16.
Whiting PF , RutjesAW, WestwoodME, MalletS, DeeksJJ, ReitsmaJB, et al. QUADAS-2: a revised tool for the quality assessment of diagnostic accuracy studies. Ann Intern Med. 2011;155(8):529–36. [PubMed: 22007046]
17.
Bossuyt PM , ReitsmaJB, BrunsDE, GatsonisCA, GlasziuPP, IrwigLM, et al. The STARD statement for reporting studies of diagnostic accuracy: explanation and elaboration. 2003;138(1):W1–W12. [PubMed: 12513067]
18.
Larsson SB , EilardA, MalmströmS, HannounC, DhillonAP, NorkransG, et al. HBsAg quantification for identification of liver disease in chronic hepatitis B virus carriers. Liver Int. 2014;34(7):e238–e45. [PubMed: 24118747]
19.
Perrillo R , MimmsL, SchechtmanK, RobbinsD, CampbellC. Monitoring of antiviral therapy with quantitative evaluation of HBeAg: a comparison with HBV DNA testing. Hepatology. 1993;18(6):1306–12. [PubMed: 8244253]
20.
Ganji A , EsmaeilzadehA, GhafarzadeganK, HelalatH, RafatpanahH, MokhtarifarA. Correlation between HBsAg quantitative assay results and HBV DNA levels in chronic HBV. Hepat Mon. 2011;11(5):342–5. [PMC free article: PMC3212769] [PubMed: 22087158]
21.
Martinot-Peignoux M , AsselahT, MarcellinP. HBsAg quantification to optimize treatment monitoring in chronic hepatitis B patients. Liver Int. 2015;35(1):82–90. [PubMed: 25529092]
22.
Fried MW , PiratvisuthT, LauGK, MarcellinP, ChowWC, CooksleyG, et al. HBeAg and hepatitis B virus DNA as outcome predictors during therapy with peginterferon alfa-2a for HBeAg-positive chronic hepatitis B. Heptaology. 2008;47(2):428–34. [PubMed: 18220290]
23.
Viganò M , LamperticoP. ClinicaliImplications of HBsAg quantification in patients with chronic hepatitis B. Saudi J Gastroenterol. 2012;18(2):81–6. [PMC free article: PMC3326981] [PubMed: 22421711]

Annex 5.11. PICO 10 - Interventions to optimize the chronic viral hepatitis care continuum: a systematic review and meta-analysis of interventions to improve hepatitis B and C screening, linkage to care, treatment uptake, treatment adherence, and viral suppression

Authors

Team Leaders: , MD,1 ,2 and , MD PhD3. , , , , , and .

Contact

Corresponding author: Joseph Tucker (ude.cnu.dem@rekcutdj)

Abstract

Background: Recent advances in hepatitis B virus (HBV) and hepatitis C virus (HCV) therapeutics have ushered in a new era of effectively addressing chronic viral hepatitis. To optimize the real-world effectiveness of these medicines requires engaging and retaining individuals from screening through care and ultimately viral suppression. We carried out a systematic review of operational interventions to enhance chronic viral hepatitis screening, linkage to care, treatment uptake, treatment adherence, and ultimately viral suppression.

Methods: The review was registered in PROSPERO (42014015094) and carried out according to PRISMA guidelines. We searched PubMed, EMBASE, the WHO library, Clinicaltrials.gov, International Clinical Trials Registry Platform, Psychinfo, and Cinahl. We included randomized controlled trials (RCT) or controlled non-randomized studies (NRS) targeting one or more steps along the chronic viral hepatitis (HBV, HCV) continuum of care. We used the Cochrane risk of bias tool and GRADE methodology to assess the quality of included studies. Pool data from studies of similar interventions were included in the meta-analyses for each specific step of the care continuum.

Results: We identified 7581 citations and included 54 studies. All studies except one were from high-income countries. Studies reported outcomes for chronic viral hepatitis screening, linkage to care, treatment uptake, treatment adherence, or viral suppression. No studies evaluated interventions to improve HBV treatment uptake or treatment adherence. Six randomized controlled trials (RCTs) showed that lay health worker HBV test promotion interventions increased HBV testing rates (RR = 2.68 [1.82–3.93], moderate quality evidence). Two NRS and one RCT found clinician reminders to prompt HCV screening during clinical visits increased HCV testing rates (RR = 3.70 [1.81–7.57], very low-quality evidence). Three RCTs demonstrated that interventions facilitating referral and scheduling to specialist sites increased patient attendance at HCV specialist visits (RR = 1.57 [1.03–2.41], moderate-quality evidence). Coordinated care between mental health and treatment specialists along with psychological therapy and counselling for patients with mental health and/or substance use comorbidities increased HCV treatment initiation (OR = 3.03 [1.24–7.37]), improved treatment completion (RR = 1.22 [1.05–1.41]), and increased sustained virological response (SVR) (RR = 1.21 [1.07–1.38]) compared to usual care (very low-quality evidence). Nurse-led therapeutic educational interventions improved treatment completion (RR = 1.14 [1.05–1.23], low-quality evidence) and increased SVR (OR = 1.93 [1.44–2.59], low-quality evidence).

Conclusion: A range of relatively simple, inexpensive operational interventions can significantly improve engagement and retention along the chronic viral hepatitis care continuum. In addition, integrated approaches to hepatitis screening, care and treatment for specific vulnerable populations are effective. In the era of highly effective antiviral therapies, further implementation science research specifically carried out in low and middle-income settings, is needed to optimize engagement and retention for people living with HBV and HCV in the chronic viral hepatitis continuum of care.

Systematic review and meta-analysis manuscript

1. Background

Globally, 250 million people are chronically infected with hepatitis B virus (HBV),1 and 80–140 million are chronically infected with hepatitis C virus (HCV)2,3 resulting in 1.45 million annual deaths – the seventh leading cause of mortality worldwide. Chronic HBV and HCV responsible for over 90% of these deaths.4 Recent advances therapeutic in HBV and HCV therapeutics are now providing the impetus for substantial changes in the clinical management of chronic viral hepatitis.

Optimizing the high efficacy of these new medicines will require engagement and retention across the care continuum, ranging from initial screening to viral suppression (HBV) or cure (HCV) (Fig. 1). Similar to the HIV continuum of care, each step of the chronic viral hepatitis continuum of care is contingent on the previous steps. This importance of the entire HBV care continuum is underlined in Australia where although 57% of the estimated population living with HBV are diagnosed, only 8% receive viral load testing and only 5% are on treatment.5 Operational interventions may enhance engagement and retention at each step along the continuum of care: screening, linkage to care, treatment uptake, treatment adherence, and viral suppression.

Population-level data on the viral hepatitis treatment care continuum for viral hepatitis is limited, though even in high-income countries only a small fraction of the estimated population living with HBV or HCV are ultimately treated and achieve viral suppression.5,6 Indeed, large proportions of people living with viral hepatitis B and C are unaware of their infection, especially those from vulnerable groups and those living in low- and middle-income countries.7,810

To investigate the potential of operational strategies to facilitate engagement and retention in the care continuum, we conducted a systematic review to identify interventions in adults living with chronic HBV or HCV infection. We further quantified the effect size of these interventions and highlighted gaps in knowledge on progression through the care continuum.

2. Methods

We searched PubMed, EMBASE, WHO library, International Clinical Trials Registry Platform, Psychinfo, and Cinahl for full-text or abstract entries published before 31 December 2014. Accepted scientific conference abstracts and clinical trials registered on Clinicaltrials.gov were also screened. References of articles selected for inclusion were searched for additional citations. Only peer-reviewed English language randomized controlled trials (RCT) or controlled non-randomized studies (NRS) were included. Where study details were unclear, we contacted authors directly.

Details on our search strategy can be found in Supplementary Materials. Briefly, we included studies on operational interventions at any point in the chronic viral hepatitis continuum for people living with diagnosed or undiagnosed chronic viral hepatitis. Only studies where the primary or secondary outcomes were engagement, retention, or progression along the care continuum were included. Exclusion criteria included study designs lacking a comparator or control, dissertations, studies enrolling only pediatric populations, and publications failing to report the outcome data necessary for extraction.

Titles, abstracts, and full-texts were sequentially screened for inclusion by two authors independently, with a third author consulted where there was disagreement. Reasons for excluding abstracts and full-texts were recorded. The PRISMA flowchart for included studies is shown in Fig. 2. Data extraction was also performed independently by two reviewers. Differences in the data extracted by the two reviewers was first attempted to be reconciled through discussion. A third reviewer was consulted if disagreement remained. The following variables were extracted: authors, journal of publication, publication year, study design, studied population, inclusion criteria, exclusion criteria, participant characteristics, sample size, study context, intervention description, control description, duration of intervention, results, and conclusions. Data was extracted and analyzed according to an intention-to-treat approach, even if individual authors reported results or conclusions based on per-protocol analyses.

Following data extraction, risk of bias was assessed for each included RCT and NRS using the Cochrane Collaboration’s risk of bias tool. Risk of bias was ranked along six domains: selection bias, performance bias, detection bias, attrition bias, reporting bias, and other bias. Detailed risk of bias tables for each stage of the chronic viral hepatitis continuum of care are included in Supplementary Materials.

All included publications were assessed for comparability on the basis of intervention type, control condition, and outcome. Studies determined to be similar for intervention, control, and outcome were included in meta-analyses to determine pooled effect size. Pooled risk or odds ratios with confidence intervals and forest plots were generated using a random-effects model in Review Manager 5.3. The degree of heterogeneity between studies in a comparison was assessed by calculating I2.

When studies only reported odds ratios with confidence intervals, data was pooled using the generic inverse variance method. If a portion of the studies included in a comparison reported outcomes that had been adjusted using matching or statistical modeling (e.g. regression modelling), a sub-analysis was generated using only adjusted results. Funnel plots were used to screen for reporting bias.

The strength of evidence was assessed according to the methodology described by the GRADE working group, and a GRADE table was generated for each meta-analysis and sub-analysis. Where specific interventions were directed at specific populations (e.g. mental health or substance use patients living with hepatitis C) we did not downgrade for indirectness as any recommendation from this analysis would be relevant to that specific population. For imprecision, the pooled sample size for each meta-analysis was compared against the optimal information size (OIS), which was calculated using an alpha of 0.05 and power of 80%.

Comparisons determined to be most relevant to current viral hepatitis treatment guidelines were included in the results section. All other comparisons can be found in Supplementary Materials.

3. Results

A total of 11 806 titles were identified through database searches, and 19 additional titles were identified through searching article references and contacting authors. After duplicates were removed, 7581 titles were screened according to standard inclusion and exclusion criteria. 469 abstracts were selected for further screening, 353 of which were excluded. Based on the results of abstract screening, 116 articles were selected for full-text review. Ultimately, 54 studies were selected for inclusion in this systematic review,1164 including 45 full-text publications,11,13,14,1631,3339,41,4547,4955,5764 5 abstracts,12,15,32,40,48 and 4 clinical trials4244,56 (Table 1). Of the 54 total included studies, 31 were included a meta-analysis that calculated a pooled effect size (Fig. 2).

Of the total 54 included studies, 37 reported an outcome along the HCV continuum of care, 15 reported an outcome along the HBV continuum of care, and 2 studies reported outcomes involving both HBV and HCV. Interventions to improve retention along the HBV continuum of care were limited to screening and linkage to care, while interventions to improve retention along the HCV continuum of care addressed all five steps. The most commonly reported outcomes among included studies were HCV treatment adherence (including treatment completion) and HCV viral suppression, with 21 and 20 studies, respectively, followed by HBV and HCV screening, with 15 and 11 studies, respectively. HBV and HCV linkage to care and treatment uptake were comparatively less well studied (Table 1). None of the interventions to improve HBV or HCV screening specifically targeted symptomatic or asymptomatic individuals.

All included studies were conducted in high-income countries, except a single study conducted in Turkey.31 Of the included studies, 44.4% (24/54) were RCTs, with seven of those being cluster RCTs, and the remaining 55.5% (30/54) of included studies were NRS. Sample sizes ranged from 21 to 36,987 (Table 1).

Thirteen meta-analyses were performed where studies were determined to be similar in terms of intervention, control and outcome so that reported data could be pooled. The number of studies included in a meta-analysis ranged from two to six. The limited number of studies in each comparison prevented us from performing stratified analyses for risk of bias, intervention intensity, and other relevant factors. Funnel plots did not detect reporting bias for any of the 13 meta-analyses.

Nearly half (7/15) of the interventions to improve HBV screening were lay health worker (LHW) HBV test promotion interventions.16,29,38,5355,64 Six of the seven LHW-led interventions were one-time activities that delivered educational content tailored to a particular community’s cultural and social context.16,29,5355,64 All six studies targeted Asian communities in the United States or Canada. Results from these six studies were pooled in a meta-analysis. Self-reported HBV testing rates were higher among groups that received a single LHW educational intervention to improve HBV knowledge and promote testing compared to groups that received no or unrelated educational interventions (RR = 2.68, CI 95; 1.82–3.93). All studies found LHW-led interventions had a positive effect on HBV screening; however, these results were moderately heterogeneous (I2 = 56%). This heterogeneity in effect size may be due to differing study design (three were RCTs randomized by cluster, and three were RCTs randomized by individual) and intervention setting (three were home visits, and three were delivered at a community-based organization).

Unlike interventions to improve HBV screening, which were primarily delivered in community settings, all 11 of the interventions to improve HCV screening either targeted health-care providers or took place at an established health-care facility.18,19,21,2325,32,36,41,50,51 At this stage in the HCV continuum of care, the two most common interventions were clinician reminders to prompt HCV screening during clinical visits (three studies)21,32,36 and pre-test counselling with on-site HCV testing at a health-care facility serving high-risk populations (three studies).19,41,50 Clinician reminders to prompt HCV screening during clinical visits consistently increased HCV testing rates compared to no clinician reminders (RR = 3.70, CI 95; 1.81–7.57). While all three studies found clinician reminders to have a positive effect on HCV screening rates, there was a large degree of heterogeneity between reported effect sizes (I2 = 99%). Providers were prompted by reminders to order HCV tests if patients belonged to a high-risk birth cohort (one study),32 reported risk behaviour (one study),21 or both (one study).36 Two studies used physical reminder stickers attached to patient charts,21,36 while one study incorporated reminders into an electronic medical records system.32 All three studies examined patients seeing primary care providers in New York City clinics.

Three interventions had a facilitated referral component where staff at a site of established care actively assisted HCV+ patients with a history of substance use in scheduling specialist visits.19,39,50 Interventions that provided facilitated referral increased patient attendance to HCV specialist visits compared to no facilitated referral in all three studies (RR = 1.57, CI 95; 1.03–2.41). However, there was significant heterogeneity between reported effect sizes (I2 = 74%). Some of the interventions in this meta-analysis provided patient education and case management at varying degrees of intensity in addition to facilitated referral, which may partially explain why the three interventions reported widely varying effect sizes.

In certain contexts HCV+ patients had been deemed ineligible for HCV treatment because of ongoing mental health and/or substance use comorbidities. Individually tailored mental health counselling and motivational therapy to treat mental health and/or substance use issues increased the number of patients who were referred eligible to treatment compared to usual care (OR = 3.43, CI 95; 1.81–6.49). There was little heterogeneity in this meta-analysis (I2 = 0%) despite the fact standards for treatment eligibility differed between the two included studies.22,30

Along the treatment uptake, treatment adherence, and viral suppression steps of the HCV continuum of care, six interventions provided “integrated” or “multidisciplinary” care.11,20,30,46,62,63 These interventions involved regular contact between mental health and specialist treatment providers throughout treatment, and also arranged regular psychological therapy and counselling for patients with mental health and/or substance use comorbidities. Some interventions also provided varying degrees of patient education and case management before and during treatment. Coordinated care between mental health and treatment specialists along with psychological therapy and counselling for patients with mental health and/or substance use comorbidities increased HCV treatment initiation (OR = 3.03, CI 95; 1.24–7.37), improved treatment completion (RR = 1.22, CI 95; 1.05–1.41), and increased SVR (RR = 1.21, CI 95; 1.07–1.38) compared to usual care. Studies included in these meta-analyses differed in terms of additional services provided beyond coordinated care, percentages of patients with mental health and/or substance use comorbidities, and patient genotype. However, little heterogeneity in effect size was found for treatment adherence and viral suppression.

An additional six studies investigated the impact of educational activities about HCV infection, treatment, side-effects of therapy, and the importance of treatment adherence for HCV+ patients beginning or maintained on interferon-based therapy.14,33,37,42,48,52 Nurse-led therapeutic educational sessions were found to improve treatment completion (RR = 1.14, CI 95; 1.05–1.23) and increase SVR (OR = 1.93, CI 95; 1.44–2.59).

Meta-analyses for interventions to improve HBV screening

Single culturally tailored LHW educational session to improve HBV knowledge and promote testing vs no or unrelated educational session for self-reported HBV screening.

Image annex5f110
Quality assessmentNo. of patientsEffectQuality
No. of studiesStudy designRisk of biasInconsistencyIndirectnessImprecisionOther considerationsSingle LHW educational sessionNo or unrelated educational sessionRelative (95% CI)Absolute (95% CI)
HBV screening
6Randomized trialsSerious1Not seriousNot serious2Not serious3None255/1344
(19.0%)
92/1413
(6.5%)
RR 2.68
(1.82–3.93)
109 more per 1000 (from 53 more to 191 more)ⴲⴲⴲ◯
Moderate
6.6%110 more per 1000 (from 54 more to 192 more)
1

6/6 studies are at high risk of detection bias because the outcome was self-reported HBV screening 6 months post intervention. 5/6 studies are at high risk of attrition bias because the ratio of participants with missing data to participants with HBV screening outcome was high (>1.0).

2

Although all included studies involved Asian immigrants in North America, this was not judged to be a significant enough difference in populations to downgrade because the intervention strategies are not exclusive to Asian immigrant populations.

3

The confidence interval is not wide. The OIS was calculated to be 222, and the pooled sample size exceeded the OIS. 3/6 included studies were cluster RCTs, none of which performed analyses that accounted for clustering. Consequently, this meta-analysis commits a unit-of-analysis error and produces over-precise results. Additionally, no ICC were reported in the included studies, so statistical methods could not be used to reduce the effective sample size of the cluster RCTs. Despite this limitation, it is unlikely proper adjustment for cluster design would significantly impact the precision of the pooled results.

II. Meta-analyses for interventions to improve HCV screening

Clinician reminder to prompt HCV screening during clinical visits with or without supplementary provider education vs no clinician reminder for HCV screening.

Image annex5f111
Quality assessmentNo. of patientsEffectQuality
No. of studiesStudy designRisk of biasInconsistencyIndirectnessImprecisionOther considerationsClinical testing reminderNo reminderRelative (95% CI)Absolute (95% CI)
HCV screening
3Other design1Serious2Serious3Not seriousSerious4None55185/33253
(15.6%)
976/19694 (5.0%)RR 3.70
(1.81–7.57)
134 more per 1000 (from 40 more to 326 more)ⴲ◯◯◯
very low
6.0%161 more per 1000 (from 48 more to 393 more)
1

This meta-analysis includes 1 cluster RCT and 2 NRS.

2

Drainoni (2012) is at high risk of performance bias and did not employ methods to adjust for confounding potentially introduced by its non-randomized study design. Krauskopf (2014) did not report comparability of randomized clusters and therefore was at high risk of bias.

3

All included studies report a risk ratio >1.0. However, I2 = 99%. The high degree of heterogeneity may be due to differences between HCV screening algorithms used in each intervention.

4

Although the pooled sample size exceeds the calculated OIS, the confidence interval is wide. Additionally, Krauskopf (2014) was a cluster RCT that did not account for clustering in its analysis. Consequently, this metaanalysis commits a unit-of-analysis error and produces overprecise results. No ICC was reported, so statistical methods could not be used to reduce the effective sample size of the cluster RCT.

5

All included studies report a risk ratio >2.0. However, the pooled results have not been upgraded for large effect because the non-randomized design of 2/3 studies introduces a significant possibility of confounding.

III. Meta-analyses for interventions to improve HCV linkage to care

Facilitated referral and scheduling to specialist visit by staff at site of established care with or without supplementary HCV education and post-test counselling vs no facilitated referral for attendance at HCV specialist visit.

Image annex5f112
Quality assessmentNo. of patientsEffectQuality
No. of studiesStudy designRisk of biasInconsistencyIndirectnessImprecisionOther considerationsFacilitated referral to specialist visit at site of established careNo facilitated referralRelative (95% CI)Absolute (95% CI)
Attended HCV specialist visit
3Randomized trialsNot serious1Serious2Not seriousNot serious3None151/243
(62.1%)
72/194
(37.1%)
RR 1.57
(1.03– 2.41)
212 more per 1000 (from 11 more to 523 more)ⴲⴲⴲ◯
Moderate
37.2%212 more per 1000 (from 11 more to 525 more)
1

Rosenberg (2010) relied on self-reported HCV status and self-reported attendance to an HCV specialist visit, putting the study at high risk of detection bias. However, because this study had a relatively small sample size it was not judged to put the entire metaanalysis at high risk of bias.

2

I2 = 85%. This high degree of heterogeneity may be due to differences between the intensity of interventions in the included studies.

3

The confidence interval is not wide. The OIS was calculated to be 124, and the pooled sample size exceeded the OIS.

Individually tailored mental health counselling and motivational therapy for HCV+ patients with mental health and/or substance use comorbidities vs usual care for physician referral to initiate treatment.

Unadjusted results.

Unadjusted results

Adjusted results.

Adjusted results

Quality assessmentNo. of patientsEffectQuality
No. of studiesStudy designRisk of biasInconsistencyIndirectnessImprecisionOther considerationsIndividually tailored mental health counselling and motivational therapyUsual careRelative (95% CI)Absolute (95% CI)
Physician referral to initiate treatment
2Other design1Serious2Not seriousNot serious3Not serious4None66/120 (55.0%)35/130
(26.9%)
RR 2.04
(1.48–2.80)
280 more per 1000 (from 129 more to 485 more)ⴲ◯◯◯
Very low
25.3%263 more per 1000 (from 121 more to 455 more)
Adjusted physician referral to initiate treatment
2Other design1Serious5Not seriousNot serious3Serious6None–/120–/165OR 3.43
(1.81– 6.49)
0 fewer per 1000 (from 0 fewer to 0 fewer)ⴲ◯◯◯
Very low
1

Evon (2011) is a RCT, while Knott (2006) is a NRS.

2

Knott (2006) is at high risk of detection bias because the outcome was subjective and determined by the physician overseeing treatment who was not blinded. Unadjusted results from Knott (2006) were used in this meta-analysis that did not employ methods to adjust for confounding potentially introduced by its non-randomized study design.

3

The decision to not downgrade for indirectness assumes guidelines are applied to other contexts where mental health or substance use comorbidities are also contraindications to recommending HCV+ patients for treatment.

4

The confidence interval is not wide. The OIS was calculated to be 94, and the pooled sample size exceeded the OIS.

5

Knott (2006) is at high risk of detection bias because the outcome was subjective and determined by the physician overseeing treatment who was not blinded.

6

The confidence interval for the pooled adjusted outcomes is wide.

IV. Meta-analyses for interventions to improve HCV treatment initiation

Coordinated care between mental health and treatment specialists with psychological therapy and counselling for patients with mental health and/or substance use comorbidities vs usual care for treatment initiation

Unadjusted results.

Unadjusted results

Adjusted results.

Adjusted results

Quality assessmentNo. of patientsEffectQuality
No. of studiesStudy designRisk of biasInconsistencyIndirectnessImprecisionOther considerationsCoordinated care with psychological therapy and counsellingUsual careRelative (95% CI)Absolute (95% CI)
Treatment initiation
3Other design1Serious2Serious3Not seriousSerious4None116/253 (45.8%)94/263
(35.7%)
RR 1.36
(0.94–1.97)
129 more per 1000 (from 21 fewer to 347 more)ⴲ◯◯◯
Very low
53.9%194 more per 1000 (from 32 fewer to 522 more)
Adjusted treatment initiation
2Other design5Not seriousSerious6Not seriousSerious7None–/252–/295OR 3.03
(1.24– 7.37)
0 fewer per 1000 (from 0 fewer to 0 fewer)ⴲ◯◯◯
very low
1

Ho (2015) is a RCT, while Ahmed (2013) and Knott (2006) are NRS.

2

Unadjusted results from Ahmed (2013) and Knott (2006) were used in this meta-analysis that did not employ methods to adjust for confounding potentially introduced by their non-randomized study design.

3

I2 = 77%. This high degree of heterogeneity may be due to differences between the populations under investigation. Ahmed (2013) included general HCV+ patients, while Ho (2015) and Knott (2006) only included patients with mental health and/or substance use comorbidities. Interventions also differed between studies. Ho (2015) provided additional case management, and Ahmed (2013) provided participants with therapeutic education and community support programmes in addition to coordinated care and psychological support.

4

The confidence interval is not wide. However, the OIS was calculated to be 741, and the pooled sample size did not meet this threshold.

5

Ho (2015) is a RCT, while Knott (2006) is a NRS.

6

I2 = 74%. This high degree of heterogeneity may be due to differences between the interventions under investigation. Ho (2015) provided case management in addition to coordinated care and psychological support.

7

The confidence interval for pooled adjusted results is wide.

V. Meta-analyses for interventions to improve HCV-sustained virological response

Coordinated care between mental health and treatment specialists with psychological therapy and counselling for patients with mental health and/or substance use comorbidities vs usual care for SVR

Image annex5f117
Quality assessmentNo. of patientsEffectQuality
No. of studiesStudy designRisk of biasInconsistencyIndirectnessImprecisionOther considerationsCoordinated care with psychological therapy and counsellingUsual careRelative (95% CI)Absolute (95% CI)
SVR
5Other designSerious1Not seriousNot seriousNot serious2None330/514 (64.2%)168/332
(50.6%)
RR 1.21
(1.07–1.38)
106 more per 1000 (from 35 more to 192 more)ⴲ◯◯◯
Very low
41.2%86 more per 1000 (from 29 more to 156 more)
1

Curcio (2010) is at high risk of performance bias because of differences between the treatment received by the two cohorts besides the intervention under examination. Knott (2006) did not employ methods to adjust for confounding potentially introduced by its non-randomized study design.

2

The confidence interval is not wide. The OIS was calculated to be 434, and the pooled sample size exceeded the OIS.

Nurse-led therapeutic educational sessions with information on HCV infection, treatment, side-effects, and/or adherence vs no therapeutic education for SVR

Unadjusted results.

Unadjusted results

Adjusted results.

Adjusted results

Adjusted results

Quality assessmentNo. of patientsEffectQuality
No. of studiesStudy designRisk of biasInconsistencyIndirectnessImprecisionOther considerationsTherapeutic educationNo specific educationRelative (95% CI)Absolute (95% CI)
SVR
6Other design1Serious2Serious3Not seriousNot serious4None491/844
(58.2%)
452/913
(49.5%)
RR 1.23
(1.03–1.47)
114 more per 1000 (from 15 more to 233 more)ⴲ◯◯◯
Very low
50.0%115 more per 1000 (from 15 more to 235 more)
Adjusted SVR
4Other design5Not serious6Not seriousNot seriousNot seriousNone–/651–/809OR 1.93
(1.44– 2.59)
2 fewer per 1000 (from 1 fewer to 3 fewer)ⴲⴲ◯◯
Low
1

Larrey (2011) is a RCT. Cacoub (2008), Lubega (2013), Renou (2009), Tait (2009), and Merck (2007) are NRS.

2

Tait (2009) and Merck (2007) did not employ methods to adjust for confounding potentially introduced by nonrandomized study design. Tait (2009) and Cacoub (2008) are both at high risk of performance bias, and Merck (2007) is at high risk of attrition bias.

3

Tait (2009) reports a risk ratio that is <1.0 while all other included studies report a risk ratio >1.0. Additionally, I2 = 68%.

4

The confidence interval is not wide. The OIS was calculated to be 1029, and the pooled sample size exceeded the OIS.

5

Larrey (2011) is a RCT. Cacoub (2008), Lubega (2013), and Renou (2009) are NRS.

6

Cacoub (2008) is at high risk of performance bias because there was no standardization of intervention procedures. However, this risk of bias is not sufficient to downgrade the quality of evidence.

4. Discussion

This systematic review and meta-analysis demonstrated that operational interventions can improve engagement, retention, or progression through the chronic viral hepatitis care continuum. Specifically, LHW HBV screening promotion activities increased HBV test uptake, while clinician reminders to prompt HCV screening during clinical visits increase HCV testing rates. Coordinated care between hepatitis and mental health specialists along with psychological therapy and counselling for patients with mental health and/or substance use comorbidities can increase HCV treatment initiation, improve treatment completion, and result in higher SVR rates.

Our review covered all 5 major steps along the continuum of care for HBV and HCV. Previous systematic reviews examining progression along the care continuum have either limited their analysis to specific components of the care continuum,65 or limited analysis to either HBV or HCV.66 Additionally, these reviews did not focus on studies that had comparison groups. We used GRADE methodology to rigorously evaluate the quality of reported evidence and our data substantially extend the 2012 NICE guidelines – Hepatitis B and C: ways to promote and offer testing to people at increased risk of infection.

Our results demonstrate that culturally appropriate lay health workers educational programs to promote HBV testing are effective. All six studies had consistently favorable results with relatively strong study designs and were graded as moderate quality evidence. Although all these interventions were conducted among Asian immigrant populations in the US, this intervention may be relevant in a range of other settings. Our findings are consistent with the growing body of evidence demonstrating that lay health workers can effectively perform a range of interventions that would otherwise be undertaken by trained medical personnel. The lay health workers in the six studies received training in order to help tailor the educational intervention and this training component was relatively simple and of low cost. Qualitative investigation supports these types of interventions as being feasible and acceptable to both those individuals screened and lay health workers themselves.67 While the importance of cultural context in developing interventions to improve HBV screening in high-risk populations and the usefulness of community settings in the delivery of healthcare is important, the low-cost nature of this intervention could facilitate its used in resource limited settings. Task shifting to LHW are well documented as strengthening service delivery capacity in a variety of clinical settings in low- and middle-income countries.6871

Our results show that clinician reminders to prompt HBV and HCV screening during clinical visits increased HCV testing rates. While of obvious use in electronic medical records, one included study used a clinical “risk screening” sticker placed on a print charts.21 Clinician reminders are consistent with the broader shift towards standardizing clinical practice, including provider initiated screening and systems-based approaches to improving clinical outcomes. While this style of intervention does not operate through the lens of addressing patient barriers, implementation is relatively easy and similar systems have demonstrated effectiveness in multiple disease modalities, such as breast72 and colorectal cancer screening.73

We found that coordinating care between mental health and treatment specialists along with psychological therapy and counselling for patients with mental health and/or substance use comorbidities was effective in promoting HCV treatment initiation, treatment completion, and achieving SVR. Hepatitis C disproportionally affects individuals with comorbid mental health or substance use issues. Traditionally, services for hepatitis, mental health and addiction have been provided by separate clinicians or teams often located in different health facilities. This may contribute to HCV treatment dropout and/or treatment failure.74 While the interventions addressing multidisciplinary or integrated care in this review were diverse, a likely key contributor to improved outcomes was co-location and coordination of services. Integrating HCV screening and treatment with mental health and addiction services is feasible and acceptable to the targeted clients.75,76 Our funding also builds on the limited literature regarding integration of HIV and mental health services, which can also improve treatment outcomes.77

We identified substantial gaps in current knowledge examining progress along the chronic viral hepatitis continuum of care. Implementation science in viral hepatitis will become increasingly important as access to effective HBV and HCV medicines expands across the world. High quality evidence provides a strong basis for forming guidelines recommendations for program managers, clinicians and others working in the field. Most of our included studies were graded low or very low. The lack of studies with robust design in particular in HCV screening and HBV treatment are a significant gap. Our analysis found no studies investigating HBV treatment uptake, adherence, or viral suppression.

While we did not provide an economic analysis of the value of incorporating operational interventions in the viral hepatitis care continuum, mathematical modelling in HCV suggests that imperfect follow-up during the HCV care continuum greatly reduces the real-world effectiveness of HCV therapy.78 It follows that interventions impacting on multiple steps along the care continuum are more resource efficient. Future research should focus quantifying the costs and effectiveness of elements or combinations of interventions to optimize treatment outcome.

There are several limitations to our review. First, outcomes that were studied were intermediate outcomes related to diagnosis and treatment, not disease end-points such as morbidity and mortality associated with HBV and HCV. However, it is well known that treatment of HBV or HCV infection reduces liver-related deaths, hepatocellular carcinoma incidence and all-cause mortality.79,80 Second, almost all studies addressing treatment uptake, adherence, and viral suppression in HCV were carried out with interferon-based therapies. Current DAA-based regimens are simpler to administer, more effective, and better tolerated. In the era of DAAs, with near 100% efficacy, retention and progression along the care continuum is likely to become an important determinant of achieving SVR. Finally, all included studies were carried out in high-income settings, with the exception of one study from Turkey. More implementation science research is needed in low- and middle-income contexts where the majority of people living with chronic viral hepatitis live.

Our systematic review demonstrates that a range of relatively simple, inexpensive operational interventions can significantly improve engagement and retention along the chronic viral hepatitis care continuum. In addition, we identified the importance of integrated approaches to hepatitis screening, care and treatment for specific vulnerable populations. Further implementation science research, robust in design and specifically carried out in low and middle-income settings, is needed to evaluate current gaps in our knowledge to improve engagement and retention for people living with HBV and HCV in the chronic viral hepatitis continuum of care.

1. Figures and tables

Fig. 1. Overview of the stages comprising the viral hepatitis treatment continuum, including testing, linkage to care, enrolment in care, treatment uptake, treatment adherence, and viral suppression.

Fig. 1Overview of the stages comprising the viral hepatitis treatment continuum, including testing, linkage to care, enrolment in care, treatment uptake, treatment adherence, and viral suppression

Fig. 2. PRISMA flow diagram outlining study selection for this systematic review of interventions to optimize retention across the chronic viral hepatitis continuum of care.

Fig. 2PRISMA flow diagram outlining study selection for this systematic review of interventions to optimize retention across the chronic viral hepatitis continuum of care

Table 1Summary table of characteristics of included studies

AuthorYearPublication typeStudy designHCV or HBVIntervention typePopulationLocationStages with reported outcomesSample size
Ahmed, 12013Full-text articleNRSHCVCoordinated care between menial health and treatment specialists with psychological therapy and counseling for patients with mental health and/or substance use comorbiditiesPatients eligible for HCVUnited KingdomTreatment uptake
Treatment adherence
Treatment outcome
82
Arora, S.2011Full-text articleNRSHCVTraining and support for primary care physiciansPatients on HCV treatmentUnited StatesTrealment adherence
Treatment outcome
407
Asihana, A2012AbstractNRSHBVNew facility testing protocol and provider educationPatients receiving chemotherapyAustraliaHBV screening229
Bastani, R.2015Full-text articleCluster RCTHBVSingle culturally-tailored lay health worker educational session to improve HBV knowledge and promote testingKorean AmericansUnited StatesHBV screening1123
Bonkovsky, H2008Full-text articleRCTHCVDirectly observed therapyPatients on HCV treatment and enrolled in MMTUnited StatesTrealment adherence
Trealment outcome
48
Bruce, RD2012Full-text articleRCTHCVDirectly observed therapyPatients on HCV treatment and enrolled in MMTUnited StatesTreatment uptake
Treatment outcome
21
Cacoub, P2008Full-text articleNRSHCVNurse-led therapeutic educational sessionsPatients on HCV treatmentFranceTreatment adherence
Treatment outcome
674
Carrion, JA2013Full-text articleNRSHCVCoordinated care between mental health and treatment specialists with psychological therapy and counseling for patients with mental health and/or substance use co morbiditiesPatients on HCV treatmentSpainTreatment adherence
Treatment outcome
447
Chakrabarty, G2013AbstractRCTHBVBloodspol testingHousehold or sexual contacls of patients with diagnosed chronic HBVNot specifiedHBV screening79
Chen, MS2013Full-text articleRCTHBVSingle culturally-tailored lay health worker educational session to improve HBV knowledge and promote testingHmong AmericansUnited StatesHBV screening260
Chen, WL2014Full-text articleRCTHCVTelecare therapeutic education and nursing supportPatients on HCV treatmentTaiwanTreatment adherence
Treatment outcome
298
Cioe, P2013Full-text articleNRSHCVDirectly observed therapyPatients on HCV treatmentUnited StatesTreatment outcome155
Craine, N2014Full-text articleCluster RCTHCVInstitutional adoption of bloodspot testingPrisonersUnited KingdomHCV screeningNot specified
Cullen, W2006Full-text articleCluster RCTHCVFacilitated referral and scheduling to specialist visit by staff at site of established care with supplementary HCV educationPatients enrolled in MMTIrelandHCV screening
HCV linkage lo care
Treatment uptake
196
Curcio, F2010Full-text articleNRSHCVCoordinated care between mental health and treatment specialists with psychological therapy and counseling for patients with mental health and/or substance use comorbiditiesPatients on HCV treatment with substance use comorbiditiesItalyTreatment adherence
Treatment oulcome
48
Drainoni, M2012Full-text articleNRSHCVClinician reminder to use screening algorithm with provider educationPatients attending urban clinics in Bronx, NYUnited StatesHCV Screening8981
Evon, DM2011Full-text articleRCTHCVPsychological therapy and counseling for patients with mental health and/or substance use comorbidities without coordinated careHCV+ patients with mental health and/or substance abuse comorbidities previously denied treatmentUnited StatesHCV linkage to care
Treatment uptake
101
Hagedom, H2007Full-text articleNRSBothNew testing protocol, patient education, counseling, and facilitated referral with provider educationPatients attending substance use disorder clinicUnited StatesHBV screening
HCV screening
HBV linkage to care
HCV linkage to care
275
Helsper, C2010Full-text articleNRSHCVRegional education campaign for providersPatients attending primary care practicesNetherlandsHCV screeningNot specified
Hickman, M2008Full-text articleCluster RCTHCVInstitutional adoption of bloodspot testingPatients attending drug clinics or prisonersUnited KingdomHCV screening12350
Hirsch, A2014Full-text articleNRSHCVExpanded viral load confirmatory testingPatients receiving care through the veteran’s affairs systemUnited StatesHCV linkage to care3039
Ho, S2015Full-text articleRCTHCVCoordinated care between mental health and treatment specialists with psychological therapy and counseling for patients with mental health and/or substance use comorbidities and case managementHCV+ patients with mental health and/or substance abuse comorbiditiesUnited SlatesTreatment uptake
Treatment adherence
Treatment outcome
363
Hsu, L2013Full-text articleRCTHBVClinician reminder to use screening algorithmAsian AmericansUnited StatesHBV screening175
Hussein, M2010Full-text articleNRSHCVTelecare therapeutic education and nursing supportPatients on HCV treatmentUnited SlatesTreatment adherence9352
Juon, H2014Full-text articleCluster RCTHBVSingle culturally-tailored lay health worker educational session to improve HBV knowledge and promote testingAsian AmericansUnited StatesHBV screening446
Knott, A2006Full-text articleNRSHCVCoordinated care between mental health and treatment specialists with psychological therapy and counseling for patients with mental health and/or substance use comorbiditiesHCV+ patients with mental health and/or substance abuse comorbiditiesUnited StatesHCV linkage to care
Treatment uptake
Treatment adherence
Treatment outcome
149
Koruk, I2011Full-text articleNRSHBVNew testing protocol with provider educationPregnant womenTurkeyHBV screening36987
Krauskopf, K2014AbstractCluster RCTHCVClinician reminder to use screening algorithm without provider educationPatients attending primary care clinic born between 1945 and 1965United SlatesHCV screening26697
Lan, CL2012Full-text articleNRSHCVTherapeutic and psychological educational sessions tailored to patients with substance use and/or mental health comorbiditiesPatients on HCV treatment with alcohol dependenceFranceTreatment outcome146
Larrey, D2011Full-text articleRCTHCVNurse-led therapeutic educational sessionsPatients on HCV treatmentFranceTreatment adherence
Treatment outcome
244
Lee, R2010Full-text articleNRSHBVNew testing protocol with provider educationPatients on intravenous chemotherapyCanadaHBV screening285
Litwin, A2012Full-text articleNRSHCVClinician reminder to use screening algorithm with provider educationPatients on HCV treatmentUnited StatesHCV screening25737
Lubega, S2013Full-text articleNRSHCVNurse-led therapeutic educational sessionsPatients on HCV treatmentUnited StatesTreatment uptake
Treatment adherence
Treatment outcome
118
Ma, G2011Full-text articleNRSHBVTargeted outreach with interactive education and counseling sessions by lay health workers and active CBO involvementKorean AmericansUnited StatesHBV screening158
Masson, CL2013Full-text articleRCTHCVFacilitated referral and scheduling to specialist visit by staff at site of established care with motivational interviewing and case managementHCV+ patients enrolled in MMTUnited StatesHCV linkage to care286
Matthews, H2012AbstractNRSHBVElectronic patient referral systemPatients receiving antenatal careUnited KingdomHBV linkage to Care102
Merchant, R2014Full-text articleRCTHCVHCV educational sessions, pretest counseling, and on-site testing at healthcare facilities serving high-risk populationsPatients in emergency department wilh self-reported recent drug useUnited StatesHCV screening395
Merck Sharp & Dohme Corp.2007Clinical trialNRSHCVNurse-led therapeutic educational sessionsPatients on HCV treatmentPolandTreatment adherence
Treatment outcome
99
Merck Sharp & Dohme Corp.2009Clinical trialNRSHCVPsychological supportPatients on HCV treatmentAustriaTreatment adherence601
Merck Sharp & Dohme Corp.2009Clinical trialNRSHCVPsychological supportPatients on HCV treatmentFranceTreatment adherence568
Mostert, MC2004Full-text articleNRSHBVPatient educational letter and provider educationPatients with positive HBeAg resultNetherlandsHBV linkage to care189
Neri, S2010Full-text articleRCTHCVCoordinated care between mental health and treatment specialists with psychological therapy and counseling for patients with mental health and/or substance use comorbiditiesPatients on HCV treatmentItalyTreatment adherence
Treatment outcome
211
Ramsey, S.2011Full-text articleRCTHCVTherapeutic and psychological educational sessions tailored to patients with substance use and/or mental health comorbiditiesPatients on HCV treatment and enrolled in MMTUnited StatesTreatment adherence29
Reimer, J2013Full-text articleNRSHCVTherapeutic and psychological educational sessions tailored to patients with substance use and/or mental health comorbiditiesPatients on HCV treatment and enrolled in OSTGermanyTreatment adherence
Treatment outcome
189
Renou, C2009AbstractNRSHCVNurse-led therapeutic educational sessionsPatients on HCV treatmentFranceTreatment outcome424
Rifai, MA2006Full-text articleNRSHCVInpatient substance use treatment with HCV testing and therapeutic education, followed by psychological therapy and counseling for patients with mental health and/or substance use comorbidities throughout treatmentHCV+ patients with substance use comorbiditiesUnited StatesTreatment uptake
Treatment outcome
158
Rosenberg, SD2010Full-text articleRCTBothHCV educational sessions, pretest counseling, and on-site testing at healthcare facilities serving high-risk populationsPatients with mental health and/or substance use comorbiditiesUnited StatesHBV screening
HCV screening
HCV linkage to care
236
Sahajian, F2004Full-text articleNRSHCVRegional education campaign for providersPatients with HCV exposure risk factorsFranceHCV screening6104
Tait, JM2009Full-text articleNRSHCVPatient education, counseling, and facilitated referral, and therapeutic educationPatients with positive HCV serology resultUnited KingdomHCV linkage to care
Treatment adherence
Treatment outcome
1305
Taylor, V2013Full-text articleRCTHBVSingle culturally-tailored lay health worker educational session to improve HBV knowledge and promote testingCambodian AmericansUnited StatesHBV screening250
Taylor, V2011Full-text articleCluster RCTHBVSingle culturally-tailored lay health worker educational session to improve HBV knowledge and promote testingAsian CanadiansCanadaHBV screening218
Taylor, V2009Full-text articleRCTHBVSingle culturally-tailored lay health worker educational session to improve HBV knowledge and promote testingChinese Americans. Chinese CanadiansUnited States, CanadaHBV Screening460
Teleen, Norman2014Clinical trialNRSHCVTraining and support for primary care physiciansPatients on HCV treatmentUnited StatesTreatment adherence197
Van Der Veen, Y2013Full-text articleRCTHBVOnline educational website with culturally-tailored educational contentTurkish migrants in the NetherlandsNetherlandsHBV screening1400

5. Supplementary materials

1. Additional comparisons, forest plots and GRADE tables

New institutional testing protocol for at-risk populations with education and testing promotion activities for providers vs. previous standard of care for HBV screening

Image annex5f122
Quality assessmentNo. of patientsEffectQuality
No. of studiesStudy designRisk of biasInconsistencyIndirectnessImprecisionOther considerationsNew institutional testing protocol and provider educationPrevious standard of careRelative (95% CI)Absolute (95% CI)
HBV screening
3Beforeafter studiesSerious1Serious2Not seriousSerious3None418391/18526
(99.3%)
3126/19021
(16.4%)
RR 3.77
(2.04–6.97)
455 more per 1000 (from 171 more to 981 more)ⴲ◯◯◯
Very low
16.4%456 more per 1000 (from 171 more to 982 more)
1

3/3 included studies did not employ methods to adjust for confounding potentially introduced by non-randomized study design.

2

All included studies report a risk ratio >1.0. However, I2 = 91%. The high degree of heterogeneity may be due to the different at-risk populations under investigation between studies (pregnant women, patients starting chemotherapy, and patients with substance use comorbidities) or differences in the intensity of interventions between studies.

3

Although the pooled sample size exceeds the calculated OIS, the confidence interval is wide.

4

All included studies report a risk ratio >2.0. However, the pooled results have not been upgraded for large effect because the non-randomized design of the included studies introduces a significant possibility of confounding.

HCV educational sessions, pretest counselling, and on-site testing at healthcare facilities serving high-risk populations vs. no educational and counselling sessions for HCV screening

Image annex5f123
Quality assessmentNo. of patientsEffectQuality
No. of studiesStudy designRisk of biasInconsistencyIndirectnessImprecisionOther considerationsFacility-based education and counsellingNo educational and counselling sessionsRelative (95% CI)Absolute (95% CI)
HCV screening
3Randomized trialsNot serious1Serious2Not seriousSerious3None250/383
(65.3%)
162/358
(45.3%)
RR 2.15
(0.80–5.79)
520 more per 1000 (from 91 fewer to 1000 more)ⴲⴲ◯◯
Low
27.2%312 more per 1000 (from 54 fewer to 1000 more)
1

Rosenberg (2010) is at high risk of detection bias because the control group outcome was self-reported. The introduced systematic bias would not necessarily exaggerate the reported effect size, so the quality of evidence was not downgraded.

2

One reported risk ratio is at 1.0 while two are > 1.0, and I2 = 96%. The high degree of heterogeneity may be due to different study contexts. Cullen (2006) and Rosenberg (2010) examined interventions at facilities where patients had established care. Merchant (2014) examined an intervention at a hospital emergency department. Additionally, Merchant (2014) offered onsite testing to both intervention and control groups, while the other included studies did not.

3

Although the pooled sample size exceeds the calculated OIS of 193, the confidence interval is wide. Additionally, Cullen (2006) was a cluster RCT that did not account for clustering in its analysis. Consequently, this meta-analysis commits a unitof-analysis error and produces over-precise results. No ICC was reported, so statistical methods could not be used to reduce the effective sample size of the cluster RCT.

Coordinated care between mental health and treatment specialists with psychological therapy and counselling for patients with mental health and/or substance use comorbidities vs usual care for treatment completion

Image annex5f124
Quality assessmentNo. of patientsEffectQuality
No. of studiesStudy designRisk of biasInconsistencyIndirectnessImprecisionOther considerationsCoordinated care with psychological therapy and counsellingUsual careRelative (95% CI)Absolute (95% CI)
Treatment completion
4Other design1Serious2Not seriousNot seriousSerious3None144/214 (67.3%)103/185
(55.7%)
RR 1.22
(1.05–1.41)
122 more per 1000 (from 28 more to 228 more)ⴲ◯◯◯
Very low
52.5%115 more per 1000 (from 26 more to 215 more)
1

Neri (2010) and Ho (2015) are RCTs. Knott (2006) and Curcio (2010) are NRS.

2

Curcio (2010) was at high risk of performance bias because intervention and control treatment were delivered at significantly different institutions. Knott (2006) did not employ methods to adjust for confounding potentially introduced by its non-randomized study design.

3

The confidence interval is not wide. However, the OIS was calculated to be 553, and the pooled sample size did not meet this threshold.

Nurse-led therapeutic educational sessions with information on HCV infection, treatment, side effects, and/or adherence vs no therapeutic education for treatment adherence

Image annex5f125

Nurse-led therapeutic educational sessions with information on HCV infection, treatment, side-effects, and/or adherence vs no therapeutic education for treatment completion

Image annex5f126
Quality assessmentNo. of patientsEffectQuality
No. of studiesStudy designRisk of biasInconsistencyIndirectnessImprecisionOther considerationsTherapeutic educationNo specific educationRelative (95% CI)Absolute (95% CI)
Treatment adherence
3Cohort studiesSerious1Serious2Not seriousSerious3None215/490
(43.9%)
157/401
(39.2%)
RR 1.08
0.87–1.34)
31 more per 1000 (from 51 fewer to 133 more)ⴲ◯◯◯
Very low
59.0%47 more per 1000 (from 77 fewer to 200 more)
Treatment completion
4Other design4Serious5Not seriousNot seriousNot serious6None321/414
(77.5%)
380/551
(69.0%)
RR 1.14
(1.05 to 1.23)
97 more per 1000 (from 34 more to 159 more)ⴲ◯◯◯
Very low
68.2%95 more per 1000 (from 34 more to 157 more)
1

3/3 studies did not employ methods to adjust for confounding potentially introduced by their non-randomized study design. Cacoub (2008) was also at high risk of performance bias because the intervention was not standardized, and at high risk of detection bias because the outcome was assessed through self-report.

2

Included studies report risk ratios on both sides of 1.0 and I2 = 64%.

3

The confidence interval is not wide. However, the OIS was calculated to be 3,481, and the pooled sample size did not meet this threshold.

4

Larrey (2011) is a RCT. Merck (2007), Tait (2009) and Renou (2009) are NRS.

5

Tait (2009) and Merck (2007) both did not employ methods to adjust for confounding potentially introduced by their non-randomized study design. Additionally, Tait (2009) was at high risk of performance bias due to study design.

6

The confidence interval is not wide. The OIS was calculated to be 861, and the pooled sample size exceeded the OIS.

Directly observed interferon therapy vs self-administered interferon therapy for SVR

Unadjusted results.

Unadjusted results

Adjusted results.

Adjusted results

Quality assessmentNo. of patientsEffectQuality
No. of studiesStudy designRisk of biasInconsistencyIndirectnessImprecisionOther considerationsDirectly observed therapySelf-administered therapyRelative (95% CI)Absolute (95% CI)
SVR
3Other design1Serious2Not seriousNot seriousSerious3None63/133
(47.4%)
35/86 (40.7%)RR 1.14
(0.84–1.56)
57 more per 1000 (from 65 fewer to 228 more)ⴲ◯◯◯
Very low
33.3%47 more per 1000 (from 53 fewer to 187 more)
Adjusted SVR
3Other design1Serious4Not seriousNot seriousSerious5None–/133–/86OR 1.49
(0.72–3.08)
1 fewer per 1000 (from 1 fewer to 3 fewer)ⴲ◯◯◯
Very low
1

Bruce (2012) and Bonkovsky (2008) are RCTs. Cioe (2013) is a NRS.

2

Bruce (2012) is at high risk of attrition bias and reporting bias. Bruce (2012) also had significant baseline differences between the intervention and control groups but methods were not used to adjust for potential confounding. Unadjusted results from Cioe (2013) were used in this meta-analysis that did not employ methods to adjust for confounding potentially introduced by its non-randomized study design.

3

The confidence interval is not wide. However, the OIS was calculated to be 1801, and the pooled sample size did not meet this threshold.

4

Bruce (2012) is at high risk of attrition bias and reporting bias. Bruce (2012) also had significant baseline differences between the intervention and control groups but methods were not used to adjust for potential confounding.

5

The confidence interval for the pooled adjusted results is wide.

Risk of bias tables

Risk of bias assessment for included studies with interventions for HBV screening

AuthorYearOutcome measureStudy designSelection bias (random sequence)Selection bias (allocation concealment)Performance biasDetection biasAttrition biasReporting biasOther bias
Baslam2015HBV screeningCluster RCTLow riskLow riskUnclear riskHigh riskHigh riskUnclear riskUnclear risk
Juon2014HBV screeningCluster RCTUnclear riskUnclear riskUnclear riskHigh riskUnclear riskUnclear riskHigh risk
Taylor2011HBV screeningCluster RCTUnclear riskUnclear riskLow riskHigh riskHigh riskUnclear riskUnclear risk
Chakrabarty2013HBV screeningRCTUnclear riskUnclear riskUnclear riskHigh riskHigh riskUnclear riskUnclear risk
Chen, MS2013HBV screeningRCTUnclear riskUnclear riskLow riskHigh riskHigh riskLow riskLow risk
Hsu2013HBV screeningRCTUnclear riskUnclear riskLow riskLow riskLow riskUnclear riskUnclear risk
Rosenberg2010HBV screeningRCTUnclear riskUnclear riskLow riskHigh riskUnclear riskLow riskLow risk
Taylor2013HBV screeningRCTLow riskUnclear riskLow riskHigh riskHigh riskUnclear riskLow risk
Taylor2009HBV screeningRCTUnclear riskUnclear riskLow riskHigh riskHigh riskUnclear riskLow risk
Van Der Veen2013HBV screeningRCTUnclear riskUnclear riskLow riskLow riskUnclear riskUnclear riskLow risk
Asthana2012HBV screeningNRSHigh riskHigh riskUnclear riskLow riskUnclear riskUnclear riskHigh risk
Hagedorn2007HBV screeningNRSHigh riskHigh riskUnclear riskLow riskUnclear riskUnclear riskHigh risk
Koruk2011HBV screeningNRSHigh riskHigh riskUnclear riskLow riskUnclear riskUnclear riskHigh risk
Lee2010HBV screeningNRSHigh riskHigh riskUnclear riskLow riskUnclear riskUnclear riskHigh risk
Ma2012HBV screeningNRSHigh riskHigh riskHigh riskHigh riskUnclear riskUnclear riskHigh risk

Risk of bias assessment for included studies with interventions for HCV screening

AuthorYearOutcome measureStudy designSelection bias (random sequence)Selection bias (allocation concealment)Performance biasDetection biasAttrition biasReporting biasOther bias
Craine2014HCV screeningCluster RCTHigh riskUnclear riskUnclear riskLow riskHigh riskLow riskHigh risk
Cullen, W2006HCV screeningCluster RCTLow riskUnclear riskLow riskLow riskLow riskUnclear riskUnclear risk
Hickman2008HCV screeningCluster RCTLow riskUnclear riskLow riskLow riskUnclear riskUnclear riskHigh risk
Krauskopf2014HCV screeningCluster RCTUnclear riskUnclear riskUnclear riskUnclear riskUnclear riskUnclear riskHigh risk
Merchant2014HCV screeningRCTLow riskUnclear riskLow riskLow riskLow riskLow riskLow risk
Rosenberg2010HCV screeningRCTUnclear riskUnclear riskLow riskHigh riskUnclear riskLow riskLow risk
Drainoni2012HCV screeningNRSHigh riskHigh riskHigh riskLow riskLow riskUnclear riskHigh risk
Hagedorn2007HCV screeningNRSHigh riskHigh riskUnclear riskLow riskUnclear riskUnclear riskHigh risk
Helsper2010HCV screeningNRSHigh riskHigh riskHigh riskLow riskUnclear riskUnclear riskHigh risk
Litwin2012HCV screeningNRSHigh riskHigh riskUnclear riskLow riskUnclear riskUnclear riskUnclear risk
Sahajian2004HCV screeningNRSHigh riskHigh riskHigh riskLow riskUnclear riskUnclear riskHigh risk

Risk of bias assessment for included studies with interventions for HBV linkage to care

AuthorYearOutcome measureStudy designSelection bias (random sequence)Selection bias (allocation concealment)Performance biasDetection biasAttrition biasReporting biasOther bias
Matthews2012HBV linkage to careNRSHigh riskHigh riskUnclear riskLow riskUnclear riskUnclear riskHigh risk
Mostert2004HBV linkage to careNRSHigh riskHigh riskHigh riskLow riskUnclear riskUnclear riskHigh risk

Risk of bias assessment for included studies with interventions for HCV linkage to care

AuthorYearOutcome measureStudy designSelection bias (random sequence)Selection bias (allocation concealment)Performance biasDeteciton biasAttrition biasReporting biasOther bias
Cullen, W2006HCV linkage to careCluster RCTLow riskUnclear riskLow riskLow riskLow riskUnclear riskUnclear risk
Evon2011HCV linkage to careRCTLow riskLow riskLow riskLow riskLow riskLow riskLow risk
Masson2013HCV linkage to careRCTLow riskLow riskLow riskLow riskUnclear riskLow riskLow risk
Rosenberg2010HCV linkage to careRCTUnclear riskUnclear riskLow riskHigh riskUnclear riskLow riskLow risk
Hagedorn2007HCV linkage to careNRSHigh riskHigh riskUnclear riskLow riskUnclear riskUnclear riskHigh risk
Hirsch2014HCV linkage to careNRSHigh riskHigh riskUnclear riskUnclear riskUnclear riskUnclear riskHigh risk
Knott2006HCV linkage to careNRSHigh riskHigh riskUnclear riskHigh riskLow riskUnclear riskUnclear risk
Tait2009HCV linkage to careNRSHigh riskHigh riskHigh riskLow riskUnclear riskUnclear riskHigh risk

Risk of bias assessment for included studies with interventions for treatment uptake

AuthorYearOutcome measureStudy designSelection bias (random sequence)Selection bias (allocalion concealment)Performance biasDetection biasAttrition biasReporting biasOther bias
Cullen, W2006Treatment uptakeCluster RCTLow riskUnclear riskLow riskLow riskLow riskUnclear riskUnclear risk
Bruce2012Treatment uptakeRCTUnclear riskUnclear riskLow riskLow riskLow riskHigh riskUnclear risk
Evon2011Treatment uptakeRCTLow riskLow riskLow riskLow riskLow riskLow riskLow risk
Ho2015Treatment uptakeRCTLow riskLow riskLow riskLow riskLow riskLow riskLow risk
Ahmed2013Treatment uptakeNRSHigh riskHigh riskUnclear riskLow riskLow riskUnclear riskHigh risk
Knott2006Treatment uptakeNRSHigh riskHigh riskUnclear riskLow riskLow riskUnclear riskUnclear risk
Lubega2013Treatment uptakeNRSHigh riskHigh riskUnclear riskLow riskUnclear riskUnclear riskUnclear risk
Rifai2006Treatment uptakeNRSHigh riskHigh riskHigh riskLow riskLow riskUnclear riskUnclear risk

Risk of bias assessment for included studies with interventions for treatment adherence and completion

AuthorYearOutcome measureStudy designSelection bias (random sequence)Selection bias (allocation concealment)Performance biasDetection biasAttrition biasReporting biasOther bias
Bonkovsky2008AdherenceRCTUnclear riskUnclear riskLow riskLow riskLow riskUnclear riskLow risk
Chen, WL2014AdherenceRCTUnclear riskUnclear riskLow riskLow riskLow riskUnclear riskLow risk
Ho2015AdherenceRCTLow riskLow riskLow riskLow riskLow riskLow riskLow risk
Larrey2011AdherenceRCTUnclear riskUnclear riskUnclear riskLow riskLow riskUnclear riskLow risk
Neri2010AdherenceRCTLow riskUnclear riskLow riskUnclear riskLow riskUnclear riskLow risk
Ramsey2011AdherenceRCTLow riskUnclear riskLow riskLow riskUnclear riskLow riskUnclear risk
Ahmed2013AdherenceNRSHigh riskHigh riskHigh riskLow riskLow riskUnclear riskHigh risk
Arora2011AdherenceNRSHigh riskHigh riskHigh riskLow riskLow riskUnclear riskHigh risk
Cacoub2008AdherenceNRSHigh riskHigh riskHigh riskHigh riskUnclear riskUnclear riskUnclear risk
Carrion2013AdherenceNRSHigh riskHigh riskUnclear riskUnclear riskLow riskLow riskHigh risk
Curcio2010AdherenceNRSHigh riskHigh riskHigh riskLow riskLow riskUnclear riskUnclear risk
Hussein2010AdherenceNRSHigh riskHigh riskHigh riskLow riskUnclear riskUnclear riskUnclear risk
Knott2006AdherenceNRSHigh riskHigh riskUnclear riskLow riskLow riskUnclear riskHigh risk
Lubega2013AdherenceNRSHigh riskHigh riskUnclear riskLow riskLow riskUnclear riskHigh risk
Merck2007AdherenceNRSHigh riskHigh riskUnclear riskUnclear riskLow riskLow riskHigh risk
Merck (Austria)2009AdherenceNRSHigh riskHigh riskUnclear riskUnclear riskLow riskLow riskHigh risk
Merck (France)2009AdherenceNRSHigh riskHigh riskUnclear riskUnclear riskLow riskLow riskHigh risk
Reimer2013AdherenceNRSHigh riskHigh riskHigh riskLow riskLow riskLow riskUnclear risk
Renou2009AdherenceNRSHigh riskHigh riskUnclear riskUnclear riskUnclear riskUnclear riskUnclear risk
Tait2009AdherenceNRSHigh riskHigh riskHigh riskLow riskUnclear riskUnclear riskHigh risk
Teleen2014AdherenceNRSHigh riskHigh riskUnclear riskLow riskLow riskLow riskHigh risk

Risk of bias assessment for included studies with interventions for viral suppression

AuthorYearOutcome measureStudy designSelection bias (random sequence)Selection bias (allocation concealment)Performance biasDetection biasAttrition biasReporting biasOther bias
Bonkovsky2008SVRRCTUnclear riskUnclear riskLow riskLow riskUnclear riskUnclear riskLow risk
Bruce2012SVRRCTUnclear riskUnclear riskLow riskLow riskHigh riskHigh riskUnclear risk
Chen, WL2014SVRRCTUnclear riskUnclear riskLow riskLow riskLow riskUnclear riskLow risk
Ho2015SVRRCTLow riskLow riskLow riskLow riskUnclear riskLow riskLow risk
Larrey2011SVRRCTUnclear riskUnclear riskUnclear riskLow riskUnclear riskUnclear riskLow risk
Neri2010SVRRCTLow riskUnclear riskLow riskLow riskUnclear riskUnclear riskLow risk
Ahmed2013SVRNRSHigh riskHigh riskHigh riskLow riskUnclear riskUnclear riskH(gh risk
Arora2012SVRNRSHigh riskHigh riskHigh riskLow riskLow riskUnclear riskUnclear risk
Cacoub2008SVRNRSHigh riskHigh riskHigh riskLow riskLow riskUnclear riskUnclear risk
Carrion2013SVRNRSHigh riskHigh riskUnclear riskLow riskUnclear riskLow riskUnclear risk
Cioe2013SVRNRSHigh riskHigh riskUnclear riskLow riskLow riskUnclear riskUnclear risk
Curcio2010SVRNRSHigh riskHigh riskHigh riskLow riskUnclear riskUnclear riskUnclear risk
Knott2006SVRNRSHigh riskHigh riskUnclear riskLow riskUnclear riskUnclear riskHigh risk
Lan2012SVRNRSHigh riskHigh riskUnclear riskLow riskLow riskHigh riskUnclear risk
Lubega2013SVRNRSHigh riskHigh riskUnclear riskLow riskUnclear riskUnclear riskUnclear risk
Merck2007SVRNRSHigh riskHigh riskUnclear riskLow riskHigh riskLow riskHigh risk
Reimer2014SVRNRSHigh riskHigh riskHigh riskLow riskLow riskLow riskUnclear risk
Renou2009SVRNRSHigh riskHigh riskUnclear riskUnclear riskUnclear riskUnclear riskUnclear risk
Rifai2006SVRNRSHigh riskHigh riskHigh riskLow riskLow riskUnclear riskUnclear risk
Tait2009SVRNRSHigh riskHigh riskHigh riskLow riskUnclear riskUnclear riskHigh risk

3. Cochrane risk of bias tool rubric

DomainSupport for judgementReview authors’ judgement
Selection bias
Random sequence generation Describe the method used to generate the allocation sequence in sufficient detail to allow an assessment of whether it should produce comparable groups.Selection bias (biased allocation to interventions) due to inadequate generation of a randomized sequence.
Allocation concealment Describe the method used to conceal the allocation sequence in sufficient detail to determine whether intervention allocations could have been foreseen in advance of, or during, enrolment.Selection bias (biased allocation to interventions) due to inadequate concealment of allocations prior to assignment
Performance bias
Blinding of participants and personnel: Assessments should be made for each main outcome (or class of outcomes) Describe all measures used, if any, to blind study participants and personnel from knowledge of which intervention a participant received. Provide any information relating to whether the intended blinding was effective.Performance bias due to knowledge of the allocated interventions by participants and personnel during the study
Detection bias
Blinding of outcome assessment: Assessments should be made for each main outcome (or class of outcomes) Describe all measures used, if any, to blind outcome assessors from knowledge of which intervention a participant received. Provide any information relating to whether the intended blinding was effective.Detection bias due to knowledge of the allocated interventions by outcome assessors
Attrition bias
Incomplete outcome data: Assessments should be made for each main outcome (or class of outcomes) Describe the completeness of outcome data for each main outcome, including attrition and exclusions from the analysis. State whether attrition and exclusions were reported, the numbers in each intervention group (compared with total randomized participants), reasons for attrition/exclusions where reported, and any re-inclusions in analyses performed by the review authors.Attrition bias due to amount, nature or handling of incomplete outcome data
Reporting bias
Selective reporting State how the possibility of selective outcome reporting was examined by the review authors and what was found.Reporting bias due to selective outcome reporting
Other bias
Other sources of bias State any important concerns about bias not addressed in the other domains in the tool.
If particular questions/entries were prespecified in the review’s protocol, responses should be provided for each question/entry.
Bias due to problems not covered elsewhere in the table

PICO table

PICO table

PICO
PIndividuals living with chronic hepatitis B or C (diagnosed or undiagnosed) or providers caring for these patients.
IOperational interventions delivered in conjunction with screening, care, or treatment of hepatitis
CStandard of care or no intervention
ORetention and progression along the continuum of care

Search strategy

Potential search terms

Population:

Hepatitis B OR HBV OR CHB

Hepatitis C OR HCV OR CHC

Chronic viral hepatitis

Intervention

Intervention

Counselling

Education or educate

Teach

Training

Program

Engagement

Alcohol and reduce, reduction, cessation

Outcome

Screen OR screened OR screening

Test OR tested OR testing

Linking OR linkage

Refer OR referral

Uptake

Retain OR retained OR retention

Adherence OR adhere

Compliance OR comply

PubMed search strategy

(Hepatitis B OR HBV OR CHB[tiab] OR Hepatitis C OR HCV OR CHC[tiab] OR chronic viral hepatitis[tiab] OR chronic viral hepatitis[mh]) AND (Intervention[tiab] OR counselling[tiab] OR education[tiab] OR educate[tiab] OR teach[tiab] OR training[tiab] OR program[tiab] OR Engagement[tiab] OR (alcohol[tiab] AND (reduce OR reduction OR cessation OR decrease)) AND (Uptake[tiab] OR Adherence[tiab] OR adhere[tiab] OR Compliance[tiab] OR comply[tiab] OR retain[tiab] OR retained[tiab] OR Retention[tiab] OR Screen[tiab] OR screened[tiab] OR screening[tiab] OR test[tiab] OR tested[tiab] OR testing[tiab] OR Linkage[tiab] OR linking[tiab] OR refer[tiab] OR Referral[tiab])

Additional information on study selection, inclusion criteria and exclusion criteria

Authors of included abstracts were contacted to determine whether the same data had been later published as a full-text article in a peer-reviewed journal, in which case the abstract would be excluded and full-text article included.

Study selection proceeded in three stages. First, two reviewers screened titles obtained from the initial search strategy according to standard inclusion and exclusion criteria. Second, abstracts for all titles identified for further review were assessed independently by two reviewers for inclusion. If there was disagreement, a third reviewer determined final inclusion. Finally, full texts for all abstracts identified for further review were assessed independently by two reviewers for inclusion. If there was disagreement, a third reviewer determined final inclusion.

References

1.
Ott JJ , StevensGA, GroegerJ, WiersmaST. Global epidemiology of hepatitis B virus infection: new estimates of age-specific HBsAg seroprevalence and endemicity. Vaccine. 2012;30(12):2212–19. [PubMed: 22273662]
2.
Gower E , EstesC, BlachS, Razavi-ShearerK, RazaviH. Global epidemiology and genotype distribution of the hepatitis C virus infection. J Hepatol. 2014;61:(1 Suppl):S45–S57. [PubMed: 25086286]
3.
Hanafiah KM , GroegerJ, FlaxmanAD, WiersmaST. Global epidemiology of hepatitis C virus infection: new estimates of age-specific antibody to hepatitis C virus seroprevalence. Hepatology. 2012;57(4):1333–42. [PubMed: 23172780]
4.
Global Burden of Disease Study C. Global, regional, and national incidence, prevalence, and years lived with disability for 301 acute and chronic diseases and injuries in 188 countries, 1990–2013: a systematic analysis for the Global Burden of Disease Study 2013. Lancet. 2015;386(9995):743–800. [PMC free article: PMC4561509] [PubMed: 26063472]
5.
Allard NL , MacLachlanJH, CowieBC. The cascade of care for Australians living with chronic hepatitis B: measuring access to diagnosis, management and treatment. Aust N Z J Public Health. 2015;39(3):255–9. [PubMed: 25716519]
6.
Yehia BR , SchranzAJ, UmscheidCA, Lo ReV, 3rd. The treatment cascade for chronic hepatitis C virus infection in the United States: a systematic review and meta-analysis. PLoS One. 2014;9(7):e101554. [PMC free article: PMC4079454] [PubMed: 24988388]
7.
Brouard C , Le StratY, LarsenC, Jauffret-RoustideM, LotF, PillonelJ. The undiagnosed chronically-infected HCV population in France. Implications for expanded testing recommendations in 2014. PLoS One. 2015;10(5):e0126920. [PMC free article: PMC4427442] [PubMed: 25961575]
8.
Hagan LM , WolpePR, SchinaziRF. Treatment as prevention and cure towards global eradication of hepatitis C virus. Trends Microbiol. 2013;21(12):625–33. [PMC free article: PMC7700888] [PubMed: 24238778]
9.
Viner K , KuncioD, NewbernEC, JohnsonCC. The continuum of hepatitis C testing and care. Hepatology. 2015;61(3):783–9. [PubMed: 25348499]
10.
Dore GJ , WardJ, ThurszM. Hepatitis C disease burden and strategies to manage the burden (Guest Editors Mark Thursz, Gregory Dore and John Ward). J Viral Hepat. 2014;21: Suppl 1:1–4. [PubMed: 24713003]
11.
Ahmed I , HabibiAN, IqbalJ, NiazZ, NaqviAA. Improving outcome in hepatitis C management: A need for dedicated multi-disciplinary service to improve compliance with treatment. J Gastroenterol Hepatol. 2013;2(8):737–9.
12.
Asthana AK , ChoongJ, LubelJS. Education does not improve hepatitis B screening uptake in those receiving cytotoxic chemotherapy-time for alternative strategies. J Gastroenterol Hepatol. 2012;27:162.
13.
Bruce RD , EisermanJ, AcostaA, GoteC, LimJK, AlticeFL. Developing a modified directly observed therapy intervention for hepatitis C treatment in a methadone maintenance program: implications for program replication. Am J Drug Alcohol Abuse2012;38(3):206–12. [PMC free article: PMC5573865] [PubMed: 22242700]
14.
Cacoub P , OuzanD, MelinP, LangJP, RotilyM, FontangesT, et al. Patient education improves adherence to peg-interferon and ribavirin in chronic genotype 2 or 3 hepatitis C virus infection: a prospective, real-life, observational study. World J Gastroenterol. 2008;14(40):6195–203. [PMC free article: PMC2761581] [PubMed: 18985810]
15.
Chakrabarty G , RiceP, FortonDM. Randomized controlled trial of home-based self-administered dried blood spot testing versus written advice for community screening of hepatitis B contacts. Hepatology2013;58(4):616A.
16.
Chen MS, Jr., FangDM, StewartSL, LyMY, LeeS, DangJH, et al. Increasing hepatitis B screening for hmong adults: results from a randomized controlled community-based study. Cancer Epidemiol Biomarkers Prev.. 2013;22(5):782–91. [PMC free article: PMC3650126] [PubMed: 23613027]
17.
Chen WL , ChiuWT, WuMS, HsuMH, TsaiSH. Translational research of telecare for the treatment of hepatitis C. Biomed Res Int. 2014;2014:195097. [PMC free article: PMC4071777] [PubMed: 25013762]
18.
Craine N , WhitakerR, PerrettS, ZouL, HickmanM, LyonsM. A stepped wedge cluster randomized control trial of dried blood spot testing to improve the uptake of hepatitis C antibody testing within UK prisons. Eur J Public Health. 2015;25(2):351–7. [PMC free article: PMC4376964] [PubMed: 25061233]
19.
Cullen W , StanleyJ, LangtonD, KellyY, StainesA, BuryG. Hepatitis C infection among injecting drug users in general practice: a cluster randomised controlled trial of clinical guidelines’ implementation. Br J Gen Pract. 2006;56(532):848–56. [PMC free article: PMC1927093] [PubMed: 17132352]
20.
Curcio F , Di MartinoF, CapraroC, AngelucciF, BullaF, CaprioN, et al. Together – to take care: multidisciplinary management of hepatitis C virus treatment in randomly selected drug users with chronic hepatitis. J Addict Med. 2010;4(4):223–32. [PubMed: 21769040]
21.
Drainoni ML , LitwinAH, SmithBD, KoppelmanEA, McKeeMD, ChristiansenCL, et al. Effectiveness of a risk screener in identifying hepatitis C virus in a primary care setting. Am J Public Health. 2012;102(11):e115–e121. [PMC free article: PMC3477946] [PubMed: 22994166]
22.
Evon DM , SimpsonK, KixmillerS, GalankoJ, DoughertyK, GolinC, et al. A randomized controlled trial of an integrated care intervention to increase eligibility for chronic hepatitis C treatment. Am J Gastroenterol. 2011;106(10):1777–86. [PMC free article: PMC3683982] [PubMed: 21769136]
23.
Hagedorn H , DieperinkE, DingmannD, DurfeeJ, HoSB, IsenhartC, et al. Integrating hepatitis prevention services into a substance use disorder clinic. J Subst Abuse Treat. 2007;32(4):391–8. [PubMed: 17481462]
24.
Helsper CW , van EssenGA, BontenMJ, de WitNJ. A support programme for primary care leads to substantial improvements in the effectiveness of a public hepatitis C campaign. Fam Pract. 2010;27(3):328–32. [PubMed: 20223833]
25.
Hickman M , McDonaldT, JuddA, NicholsT, HopeV, SkidmoreS, et al. Increasing the uptake of hepatitis C virus testing among injecting drug users in specialist drug treatment and prison settings by using dried blood spots for diagnostic testing: a cluster randomized controlled trial. J Viral Hepat. 2008;15(4):250–54. [PubMed: 18086182]
26.
Hirsch AA , LawrenceRH, KernE, Falck-YtterY, ShumakerDT, WattsB. Implementation and evaluation of a multicomponent quality improvement intervention to improve efficiency of hepatitis C screening and diagnosis. Jt Comm J Qual Patient Saf. 2014;40(8):351–7. [PubMed: 25208440]
27.
Hsu L , BowlusCL, StewartSL, NguyenTT, DangJ, ChanB, et al. Electronic messages increase hepatitis B screening in at-risk Asian American patients: a randomized, controlled trial. Dig Dis Sci. 2013;58(3):807–14. [PMC free article: PMC3578075] [PubMed: 23073671]
28.
Hussein M , BennerJS, LeeD, SestiAM, BattlemanDS, Brock-WoodC. Propensity score matching in the evaluation of drug therapy management programs: an illustrative analysis of a program for patients with hepatitis C virus. Qual Manag Health Care. 2010;19(1):25–33. [PubMed: 20042931]
29.
Juon HS , LeeS, StrongC, RimalR, KirkGD, BowieJ. Effect of a liver cancer education program on hepatitis B screening among Asian Americans in the Baltimore-Washington metropolitan area, 2009–2010. Prev Chronic Dis. 2014;11:130258. [PMC free article: PMC3921910] [PubMed: 24503341]
30.
Knott A , DieperinkE, WillenbringML, HeitS, DurfeeJM, WingertM, et al. Integrated psychiatric/medical care in a chronic hepatitis C clinic: effect on antiviral treatment evaluation and outcomes. Am J Gastroenterol. 2006;101(10):2254–62. [PubMed: 17032190]
31.
Koruk I , KorukST, CopurAC, SimsekZ. A intervention study to improve HBsAg testing and preventive practices for hepatitis B in an obstetrics hospital. Türk Silahl Kuvvetleri Koruyucu Hekim Bül. 2011;10(3):287–92.
32.
Krauskopf K , KilN, SofianouA, et al. Evaluation of an electronic health record prompt for hepatitis C antibody screening of baby boomers in primary care – a cluster randomized control trial. Journal of General Internal Medicine2014;29:S88–S89.
33.
Larrey D , SalseA, RibardD, BoutetO, Hyrailles-BlancV, NiangB, et al. Education by a nurse increases response of patients with chronic hepatitis C to therapy with peginterferon-alpha2a and ribavirin. Clin Gastroenterol Hepatol. 2011;9(9):781–5. [PubMed: 21683161]
34.
Le Lan C , Guillygomarc’hA, DanielouH, Le DréauG, LainéF, VédeilhiéC, et al. A multi-disciplinary approach to treating hepatitis C with interferon and ribavirin in alcohol-dependent patients with ongoing abuse. J Hepatol. 2012;56(2):334–40. [PubMed: 21756854]
35.
Lee R , VuK, BellCM, HicksLK. Screening for hepatitis B surface antigen before chemotherapy: current practice and opportunities for improvement. Curr Oncol. 2010;17(6):32–8. [PMC free article: PMC2993437] [PubMed: 21151407]
36.
Litwin AH , SmithBD, DrainoniML, McKeeD, GiffordAL, KoppelmanE, et al. Primary care-based interventions are associated with increases in hepatitis C virus testing for patients at risk. Dig Liver Dis. 2012;44(6):497–503. [PubMed: 22342471]
37.
Lubega S , AgbimU, SurjadiM, MahoneyM, KhaliliM. Formal hepatitis C education enhances HCV care coordination, expedites HCV treatment and improves antiviral response. Liver Int. 2013;33(7):999–1007. [PMC free article: PMC3692599] [PubMed: 23509897]
38.
Ma GX , GaoW, TanY, ChaeWG, RheeJ. A community-based participatory approach to a hepatitis B intervention for Korean Americans. Prog Community Health Partnersh. 2012;6(1):7–16. [PMC free article: PMC5573181] [PubMed: 22643783]
39.
Masson CL , DelucchiKL, McKnightC, HettemaJ, KhaliliM, MinA, et al. A randomized trial of a hepatitis care coordination model in methadone maintenance treatment. Am J Public Health. 2013;103(10):e81–e88. [PMC free article: PMC3853128] [PubMed: 23947319]
40.
Matthews HC , McLeodMA, OakesK, McCurdyG, ZuckermanM. CareyI, et al. Perinatal hepatitis B in a high prevalence inner city population: direct electronic referral improves care. Gut. 2012;61(Suppl 2):A79–A80.
41.
Merchant RC , BairdJR, LiuT, TaylorLE, MontagueB, NirenbergT. Does a brief intervention increase HIV/HCV screening among drug-using emergency department patients?Acad Emerg Med. 2014;21(5):S305–S306. [PMC free article: PMC4135533] [PubMed: 25125271]
42.
ClinicalTrials​.gov [website]. Compliance of HCV genotype 1 infected patients receiving PegIntron/Rebetol and a Patient Assistance Program (Study P04671). ClinicalTrials​.gov identifier NCT00728494 (https:​//clinicaltrials​.gov/ct2/show/NCT00728494, accessed 08 June 2016).
43.
ClinicalTrials​.gov [website]. Adherence in patients receiving pegintron pen/Rebetol for hepatitis C in conjunction with a patient assistance program (Study P04281)(COMPLETED). 2009. ClinicalTrials​.gov identifier NCT00723892 (https:​//clinicaltrials​.gov/ct2/show/NCT00723892, accessed 08 June 2016).
44.
ClinicalTrials​.gov [website]. Adherence in patients receiving pegintron/Rebetol for hepatitis C in conjunction with a psychotherapy support program (Study P04252) (COMPLETED). 2009. ClinicalTrials​.gov identifier NCT00723892 (https:​//clinicaltrials​.gov/ct2/show/NCT00723892, accessed 08 June 2016).
45.
Mostert MC , RichardusJH, de ManRA. Referral of chronic hepatitis B patients from primary to specialist care: making a simple guideline work. J Hepatol. 2004;41(6):1026–30. [PubMed: 15582137]
46.
Neri S , BertinoG, PetraliaA, GiancarloC, RizzottoA, CalvagnoGS, et al. A multidisciplinary therapeutic approach for reducing the risk of psychiatric side effects in patients with chronic hepatitis C treated with pegylated interferon alpha and ribavirin. J Clin Gastroenterol. 2010;44(9):e210–e217. [PubMed: 20838237]
47.
Reimer J , SchmidtCS, SchulteB, GansefortD, GölzJ, GerkenG, et al. Psychoeducation improves hepatitis C virus treatment during opioid substitution therapy: a controlled, prospective multicenter trial. Clin Infect Dis. 2013;57: Suppl 2:S97–S104. [PubMed: 23884073]
48.
Renou C , LahmekP, ParienteA, et al. Impact of therapeutic education on the outcome of chronic hepatitis C treatment. Hepatology. 2009;50:729A.
49.
Rifai MA , MolesJK, LehmanLP, Van der LindenBJ. Hepatitis C screening and treatment outcomes in patients with substance use/dependence disorders. Psychosomatics. 2006;47(2):112–21. [PubMed: 16508022]
50.
Rosenberg SD , GoldbergRW, DixonLB, WolfordGL, SladeEP, HimelhochS, et al. Assessing the STIRR model of best practices for blood-borne infections of clients with severe mental illness. Psychiatr Serv. 2010;61(9):885–91. [PMC free article: PMC3632357] [PubMed: 20810586]
51.
Sahajian F , ExclerG, BaillyF, Caillat-ValletE, TrépoC, SepetjanM, et al. Hepatitis C screening practices among private practitioners: impact of an information campaign. Gastroenterol Clin Biol. 2004;28(8–9):714–19. [PubMed: 15646538]
52.
Tait JM , McIntyrePG, McLeodS, NathwaniD, DillonJF. The impact of a managed care network on attendance, follow-up and treatment at a hepatitis C specialist centre. J Viral Hepat. 2010;17(10):698–704. [PubMed: 20002561]
53.
Taylor VM , BastaniR, BurkeN, TalbotJ, SosC, LiuQ, et al. Evaluation of a hepatitis B lay health worker intervention for Cambodian Americans. J Community Health. 2013;38(3):546–53. [PMC free article: PMC3633619] [PubMed: 23299978]
54.
Taylor VM , GregoryHislop T, BajdikC, TehC, LamW, AcordaE, et al. Hepatitis B ESL education for Asian immigrants. J Community Health. 2011;36(1):35–41. [PMC free article: PMC2952282] [PubMed: 20559696]
55.
Taylor VM , HislopTG, TuSP, TehC, AcordaE, YipMP, et al. Evaluation of a hepatitis B lay health worker intervention for Chinese Americans and Canadians. J Community Health. 2009;34(3):165–72. [PMC free article: PMC2735565] [PubMed: 19127416]
56.
ClinicalTrials​.gov [website]. Impact of physician directed education on patient compliance with hepatitis C therapy (OPTIMAL) (COMPLETED). 2014. ClinicalTrials​.gov identifier NCT01405027 (https:​//clinicaltrials​.gov/ct2/show/NCT01405027, accessed 08 June 2016).
57.
van der Veen YJ , van EmpelenP, de ZwartO, VisserH, MackenbachJP, RichardusJH. Cultural tailoring to promote hepatitis B screening in Turkish Dutch: a randomized control study. Health Promot Int. 2014;29(4):692–704. [PubMed: 23574695]
58.
Arora S , ThorntonK, MurataG, DemingP, KalishmanS, DionD, et al. Outcomes of treatment for hepatitis C virus infection by primary care providers. N Engl J Med. 2011;364(23):2199–2207. [PMC free article: PMC3820419] [PubMed: 21631316]
59.
Bonkovsky HL , TiceAD, YappRG, BodenheimerHCJr, MontoA, RossiSJ, et al. Efficacy and safety of peginterferon alfa-2a/ribavirin in methadone maintenance patients: randomized comparison of direct observed therapy and self-administration. Am J Gastroenterol. 2008;103(11):2757–65. [PubMed: 18684176]
60.
Ramsey SE , EnglerPA, SteinMD, BrownRA, CioeP, KahlerCW, et al. Effect of CBT on depressive symptoms in methadone maintenance patients undergoing treatment for hepatitis C. J Addict Res Ther. 2011;2(2):2–10. [PMC free article: PMC3130194] [PubMed: 21743837]
61.
Cioe PA , SteinMD, PromratK, FriedmannPD. A comparison of modified directly observed therapy to standard care for chronic hepatitis C. J Community Health. 2013;38(4):679–84. [PMC free article: PMC3706524] [PubMed: 23471655]
62.
Ho SB , BrauN, CheungR, LiuL, SanchezC, SklarM, et al. Integrated care increases treatment and improves outcomes of patients with chronic hepatitis C virus infection and psychiatric illness or substance abuse. Clin Gastroenterol Hepatol. 2015;13(11):2005–14.e1–3. [PubMed: 25724704]
63.
Carrion JA , Gonzalez-ColominasE, Garcia-RetortilloM, CañeteN, CireraI, CollS, et al. A multidisciplinary support programme increases the efficiency of pegylated interferon alfa-2a and ribavirin in hepatitis C. J Hepatol. 2013;59(5):926–33. [PubMed: 23811030]
64.
Bastani R , GlennBA, MaxwellAE, JoAM, HerrmannAK, CrespiCM, et al. Cluster-randomized trial to increase hepatitis B testing among Koreans in Los Angeles. Cancer Epidemiol Biomarkers Prev.. 2015;24(9):1341–9. [PMC free article: PMC4560609] [PubMed: 26104909]
65.
Shah HA , Abu-AmaraM. Education provides significant benefits to patients with hepatitis B virus or hepatitis C virus infection: a systematic review. Clin Gastroenterol Hepatol. 2013;11(8):922–33. [PubMed: 23639601]
66.
Meyer JP , MoghimiY, MarcusR, LimJK, LitwinAH, AlticeFL. Evidence-based interventions to enhance assessment, treatment, and adherence in the chronic Hepatitis C care continuum. The Int J Drug Policy. 2015;26(10):922–35. [PMC free article: PMC4577454] [PubMed: 26077144]
67.
Glenton C , ColvinCJ, CarlsenB, et al. Barriers and facilitators to the implementation of lay health worker programmes to improve access to maternal and child health: qualitative evidence synthesis. Cochrane Database Syst Rev. 2013;(10):CD010414. [PMC free article: PMC6396344] [PubMed: 24101553]
68.
Mwai GW , MburuG, TorpeyK, FrostP, FordN, SeeleyJ. Role and outcomes of community health workers in HIV care in sub-Saharan Africa: a systematic review. J Int AIDS Soc.. 2013;16:18586. [PMC free article: PMC3772323] [PubMed: 24029015]
69.
Patel V , WeissHA, ChowdharyN, NaikS, PednekarS, ChatterjeeS, et al. Lay health worker led intervention for depressive and anxiety disorders in India: impact on clinical and disability outcomes over 12 months. Br J Psychiatry. 2011;199(6):459–466. [PMC free article: PMC3227809] [PubMed: 22130747]
70.
Joshi R , AlimM, KengneAP, JanS, MaulikPK, PeirisD, et al. Task shifting for non-communicable disease management in low and middle income countries – a systematic review. PLoS One. 2014;9(8):e103754. [PMC free article: PMC4133198] [PubMed: 25121789]
71.
Kredo T , AdeniyiFB, BateganyaM, PienaarED. Task shifting from doctors to non-doctors for initiation and maintenance of antiretroviral therapy. Cochrane Database Syst Rev2014;(7):CD007331. [PubMed: 24980859]
72.
Mandelblatt JS , GoldK, O’MalleyAS, TaylorK, CagneyK, HopkinsJS, et al. Breast and cervix cancer screening among multiethnic women: role of age, health, and source of care. Prev Med. 1999;28(4):418–25. [PubMed: 10090871]
73.
Green BB , WangCY, AndersonML, ChubakJ, MeenanRT, VernonSW, et al. An automated intervention with stepped increases in support to increase uptake of colorectal cancer screening: a randomized trial. Ann Intern Med. 2013;158(5 Pt 1):301–11. [PMC free article: PMC3953144] [PubMed: 23460053]
74.
Willenbring ML . Integrating care for patients with infectious, psychiatric, and substance use disorders: concepts and approaches. AIDS2005;19 (Suppl 3):S227–S237. [PubMed: 16251823]
75.
Norman J , WalshNM, MugavinJ, StoovéMA, KelsallJ, AustinK, et al. The acceptability and feasibility of peer worker support role in community-based HCV treatment for injecting drug users. Harm Reduct J. 2008;5:8. [PMC free article: PMC2291043] [PubMed: 18298862]
76.
Sylvestre D , LoftisJ, HauserP, GenserS, CesariH, BorekN, et al. Co-occurring hepatitis C, substance use, and psychiatric illness: treatment issues and developing integrated models of care. J Urban Health. 2004;81(4):719–34. [PMC free article: PMC3455918] [PubMed: 15466851]
77.
Hoang T , GoetzMB, YanoEM, RossmanB, AnayaHD, KnappH, et al. The impact of integrated HIV care on patient health outcomes. Med Care. 2009;47(5):560–7. [PMC free article: PMC3108041] [PubMed: 19318998]
78.
Linas BP , BarterDM, LeffJA, AssoumouSA, SalomonJA, WeinsteinMC, et al. The hepatitis C cascade of care: identifying priorities to improve clinical outcomes. PloS One. 2014;9(5):e97317. [PMC free article: PMC4026319] [PubMed: 24842841]
79.
van der Meer AJ . Value anti-hepatitis C virus therapy by its clinical efficacy. Hepatology. 2015;62(2):334–6. [PubMed: 25892650]
80.
Hosaka T , SuzukiF, KobayashiM, SekoY, KawamuraY, SezakiH, et al. Long-term entecavir treatment reduces hepatocellular carcinoma incidence in patients with hepatitis B virus infection. Hepatology. 2013;58(1):98–107. [PubMed: 23213040]
Copyright © World Health Organization 2017.

Sales, rights and licensing. To purchase WHO publications, see http://apps.who.int/bookorders. To submit requests for commercial use and queries on rights and licensing, see http://www.who.int/about/licensing.

Third-party materials. If you wish to reuse material from this work that is attributed to a third party, such as tables, figures or images, it is your responsibility to determine whether permission is needed for that reuse and to obtain permission from the copyright holder. The risk of claims resulting from infringement of any third-party-owned component in the work rests solely with the user.

Some rights reserved. This work is available under the Creative Commons Attribution-NonCommercial-ShareAlike 3.0 IGO licence (CC BY-NC-SA 3.0 IGO; https://creativecommons.org/licenses/by-nc-sa/3.0/igo).

Under the terms of this licence, you may copy, redistribute and adapt the work for non-commercial purposes, provided the work is appropriately cited, as indicated below. In any use of this work, there should be no suggestion that WHO endorses any specific organization, products or services. The use of the WHO logo is not permitted. If you adapt the work, then you must license your work under the same or equivalent Creative Commons licence. If you create a translation of this work, you should add the following disclaimer along with the suggested citation: “The translation was not created by the World Health Organization (WHO). WHO is not responsible for the content or accuracy of this translation. The original English edition shall be the binding and authentic edition”.

Any mediation relating to disputes arising under the licence shall be conducted in accordance with the mediation rules of the World Intellectual Property Organization.

Bookshelf ID: NBK442287

Views

In this Page

Related information

  • PMC
    PubMed Central citations
  • PubMed
    Links to PubMed

Recent Activity

Your browsing activity is empty.

Activity recording is turned off.

Turn recording back on

See more...