U.S. flag

An official website of the United States government

NCBI Bookshelf. A service of the National Library of Medicine, National Institutes of Health.

Prevention of Mother-to-Child Transmission of Hepatitis B Virus: Guidelines on Antiviral Prophylaxis in Pregnancy. Geneva: World Health Organization; 2020 Jul.

Cover of Prevention of Mother-to-Child Transmission of Hepatitis B Virus: Guidelines on Antiviral Prophylaxis in Pregnancy

Prevention of Mother-to-Child Transmission of Hepatitis B Virus: Guidelines on Antiviral Prophylaxis in Pregnancy.

Show details

Web Annex BSystematic review of the performance of hepatitis B e antigen test, as an alternative to HBV DNA, to assess eligibility for initiating antiviral therapy during pregnancy

, , , , , and .

Author Information and Affiliations

List of abbreviations

AASLD

American Association for the Study of Liver Diseases

AFR

African Region

AMR

Region of the Americas

APASL

Asian Pacific Association for the Study of the Liver

BCP

basal core promoter

CHB

chronic hepatitis B virus infection

CIA

counting immunoassay

CLIA

chemiluminescence immunoassay

CNKI

China National Knowledge Infrastructure

EASL

European Association for the Study of the Liver

EIA

enzyme immunoassay

EMR

Eastern Mediterranean Region

ESS

effective sample size

EUR

European Region

FIA

fluoroimmunoassay

FN

false negative

FP

false positive

GHSS

Global Health Sector Strategy

GRADE

Grading of Recommendations Assessment, Development and Evaluation

HBcrAg

hepatitis B core-related antigen

HBeAg

hepatitis B e antigen

HBIG

hepatitis B immunoglobulin

HBsAg

hepatitis B surface antigen

HBV

hepatitis B virus

HCC

hepatocellular carcinoma

HCV

hepatitis C virus

HDV

hepatitis D virus

lnDOR

log diagnostic odds ratio

MTCT

mother-to-child transmission

N/A

not applicable

NAT

nucleic acid test

NLR

negative likelihood ratio

N/R

not reported

PC

precore

PCR

(real-time) polymerase chain reaction

PLR

positive likelihood ratio

QUADAS-2

Quality Assessment of Diagnostic Accuracy Studies

RDT

rapid diagnostic test

RIA

radioimmunoassay

Se

sensitivity

SEAR

South-East Asia Region

Sp

specificity

SROC

summary receiver operating characteristic curve

TBD

timely birth dose of hepatitis B vaccine

TN

true negative

TP

true positive

VL

viral load

WPR

Western Pacific Region

WHO

World Health Organization

95% CI

95% confidence interval

1. Background

Currently, the World Health Organization (WHO) estimates that chronic hepatitis B virus (HBV) infection affects close to 260 million persons and causes an estimated 900 000 deaths annually through manifestations of chronic liver disease, such as cirrhosis or hepatocellular carcinoma (HCC). The regions with the highest prevalence of chronic HBV infection (CHB) are the Western Pacific and Africa (1). In 2016, the World Health Assembly endorsed the Global Health Sector Strategy (GHSS) on viral hepatitis, which calls for an elimination of HBV worldwide as a public health threat by 2030, to be accomplished through reducing the incidence of CHB by 90%, and its mortality by 65% (2).

Chronic infection is more likely to develop when HBV is acquired early in life, and therefore, perinatal mother-to-child transmission (MTCT) is a major contributor to the incidence of CHB (3). Moreover, the risk of developing chronic liver disease, including HCC, may be higher in those who acquired CHB through MTCT compared to those who ended up with CHB through horizontal transmission later in life (4,5).

In order to achieve the WHO’s global hepatitis elimination plan, it is imperative to prevent MTCT of HBV (6). Since 2009, WHO makes a universal recommendation to administer timely hepatitis B vaccines to all newborn babies within 24 hours of birth to prevent MTCT and early childhood transmission (7). Although the birth dose vaccines alone should be enough to prevent MTCT from mothers with CHB who have low HBV viral replication (8,9), 20–30% of women with high viral load infect their newborns despite timely birth dose vaccination (9,10). Therefore, in resource-rich countries, pregnant women are screened for hepatitis B surface antigen (HBsAg), and subsequently for hepatitis B e antigen (HBeAg), to identify high-risk infants who would benefit from hepatitis B immunoglobulin (HBIG) in addition to timely birth dose vaccination (11). However, despite this active and passive immunoprophylaxis, a substantial proportion of infants are still infected when their mothers have a very high viral load, particularly when the serum HBV DNA level exceeds 200 000 IU/mL (12). Consequently, in high-income countries, HBV DNA quantification has become a part of antenatal HBV testing to identify highly viraemic women who have a residual risk of MTCT despite administration of both hepatitis B vaccine and HBIG to neonates at birth (1214), and who thus require antiviral therapy during pregnancy for minimizing its risk (15).

However, in low- and middle-income countries, such additional measures to prevent MTCT have rarely been implemented (16). Following antenatal screening for HBsAg, it is essential to quantify serum HBV DNA levels using the nucleic acid test (NAT) to decide whom to treat and not to treat during pregnancy to prevent MTCT. However, access to NAT is severely limited in these countries. The current standard NAT assay, which is real-time polymerase chain reaction (PCR), is hardly accessible due to its high cost (US$ 60–200/assay) and its need for a sophisticated laboratory with highly skilled laboratory staff (1). Alternatively, detection of HBeAg using laboratory-based immunoassays, such as enzyme immunoassay (EIA) and chemiluminescence immunoassay (CLIA), or rapid diagnostic test (RDT) with lateral flow immunochromatographic assay, may largely overcome these limitations, because these tests may be more readily available and affordable (US$ 1–30/assay) than HBV DNA NAT in such settings (17).

2. Objectives

2.1. Primary objective

To provide a summary estimate of the performance (sensitivity and specificity) of HBeAg tests in pregnant women with CHB with the purpose of diagnosing high HBV DNA levels for the assessment of eligibility for antiviral treatment during pregnancy to prevent HBV MTCT

The definition of high maternal HBV DNA levels that warrant antiviral therapy during pregnancy varies substantially according to the regional/national guidelines as below:

○ EASL & AASLD200 000 IU/mL (13,14)
○ China2 000 000 IU/mL (18)
○ APASL1 000 000–10 000 000 IU/mL (19)
○ Australia & New Zealand10 000 000 IU/mL

Abbreviations: AASLD (American Association for the Study of Liver Diseases); APASL (Asian Pacific Association for the Study of the Liver); EASL (European Association for the Study of the Liver)

The general eligibility criteria for initiating the immediate antiviral therapy in people with CHB set the HBV DNA thresholds much lower, but also require the presence of other disease parameters (i.e. liver inflammation and/or liver fibrosis):

○ WHO20 000 IU/mL (20)
○ EASL, AASLD & APASL2000 IU/mL (13,14,19)

Because of the variability in the definition of high HBV DNA levels as an eligibility criterion for antiviral therapy, in this systematic review we defined high HBV DNA levels to be any value greater than or equal to 20 000 IU/mL.

The summary estimates (sensitivity and specificity) were reported at each of the different HBV DNA thresholds used in the included studies. In addition, the following subgroup analyses were considered whenever there were at least three studies:

  • Type of HBeAg assay
  • Type of HBV DNA assay
  • Mean/median maternal age
  • Maternal coinfection with HIV, HCV or HDV
  • Maternal HBV genotypes
  • WHO region
  • Study’s risk of bias (high vs low)

2.2. Secondary objectives

The secondary objectives were:

  • Secondary Objective 1
    To provide a summary estimate of the performance (sensitivity and specificity) of HBeAg tests in pregnant women with CHB to predict the risk of HBV MTCT, by type of HBeAg assay and type of preventive measures
  • Secondary Objective 2
    To provide a summary estimate of the performance (sensitivity and specificity) of different serum HBV DNA thresholds in pregnant women with CHB to predict the risk of HBV MTCT, by type of preventive measure

These secondary objectives were assessed within the studies included for the primary objective; no additional systematic review was conducted to respond specifically to these secondary objectives.

We also provided a Grading of Recommendations Assessment, Development and Evaluation (GRADE) review, and identified gaps in research.

2.3. Post-hoc analyses

Following the Guidelines Development Group meeting held in Geneva on 9–10 October 2019, we conducted post-hoc analyses:

-

Post-hoc analysis 1:

To assess the maternal HBV DNA threshold during pregnancy at which the risk of HBV MTCT starts to increase despite infant’s immunoprophylaxis (timely birth dose vaccine with or without HBIG)

-

Post-hoc analysis 2:

To provide a summary estimate of the performance (sensitivity and specificity) of HBeAg tests in pregnant women with CHB to diagnose HBV DNA threshold specifically defined by the analysis above

3. Methods

3.1. Narrative review question

Can HBeAg test be used instead of NAT to diagnose high HBV DNA levels in order to assess eligibility for antiviral therapy initiation in pregnant women with CHB to prevent MTCT?

3.2. PICO questions

We obtained evidence to answer the following questions (Table 1).

Table 1PICO questions for this systematic review

PICO2APICO2BPICO2C
What is the performance of HBeAg to diagnose high HBV DNA levels in pregnant women with CHB?What is the performance of HBeAg in pregnant women with CHB to predict the risk of MTCT?What is the performance of different HBV DNA thresholds in pregnant women with CHB to predict the risk of MTCT?
PopulationPregnant women with CHB*1 without concomitant anti-HBV therapySame as PICO2ASame as PICO2A
InterventionMaternal HBeAg test during pregnancy*2Same as PICO2AMaternal HBV DNA levels during pregnancy*4
  • Dichotomized into high and low using the following thresholds: ≥20,000, 10^5, 10^6, 10^7 and 10^8 IU/mL
ComparisonMaternal HBV DNA levels during pregnancy*3,*4
  • Dichotomized into high and low using the following thresholds: ≥20 000, 10^5, 10^6, 10^7, & 10^8 IU/mL
MTCT defined as:
  • HBsAg positivity or HBV DNA positivity in infants aged 6–12 months
  • Extended to 6–24 months in infants who received three doses of HBV vaccine
Same as PICO2B
OutcomesSensitivity and specificity of HBeAg tests*5 to diagnose each of different HBV DNA thresholdsSensitivity and specificity of HBeAg tests to predict MTCT*6Sensitivity and specificity of HBV DNA test to predict MTCT*6
*1

CHB was defined as HBsAg seropositivity on two occasions at least 6 months apart. However, because new HBV infections in adults are uncommon in highly endemic areas where the vast majority of HBsAg-positive people acquired the infection perinatally or during childhood, HBsAg positivity on only one occasion (at antenatal care) in women living in highly prevalent countries was assumed to reflect CHB (21).

*2

Maternal HBeAg test performed after child delivery was not considered. The test result should be reported positive or negative; an indeterminate result was not considered for the meta-analysis. Instead, the frequency of the indeterminate result in each study was extracted and reported. The following HBeAg immunoassays were considered:

  • Lateral flow immunochromatographic rapid diagnostic test (RDT)
  • Enzyme immunoassay (EIA)
  • Chemiluminescence immunoassay (CLIA)
  • Radioimmunoassay (RIA)
  • Counting immunoassay (CIA)
  • Fluoroimmunoassay (FIA)

*3

It is ideal to have both HBeAg and HBV DNA measurements from the same sample, or at least from a sampling done at the same time. However, a study was still considered whenever both markers were measured during the same period of pregnancy, even if they were not measured using samples collected on the same day.

*4

There are two types of NAT: qualitative (undetectable or detectable) and quantitative. When NAT provided a continuous value through quantification of HBV DNA levels, the value was dichotomized into high and low according to a threshold used in each included study. In order to have a wide range of estimations, the HBV DNA threshold used in each included study to dichotomize HBV DNA levels into high and low should have been greater than or equal to 20 000 IU/mL. Similarly, when NAT provided only a qualitative binary result (detectable or undetectable), the limit of detection of the qualitative NAT should have been greater than or equal to 20 000 IU/mL.

*5

For example, in the case of HBV DNA levels of ≥200 000 IU/mL, the sensitivity and specificity were defined as below:

sensitivity=No.ofwomenwithHBVDNA200000IU/mLwhotestedpositiveforHBeAgTotalno.ofwomenwithHBVDNA200000IU/mL

specificity=No.ofwomenwithHBVDNA<200000IU/mLwhotestednegativeforHBeAgTotalno.ofwomenwithHBVDNA<200000IU/mL

In order to have these estimates, a study needed to provide sufficient data for us to draw a 2x2 or 2x1 table with the cross-classification of the reference test results (high vs low HBV DNA levels) and the index test results (positive vs negative HBeAg serostatus).

*6

The outcome was stratified by the type of preventive measures: timely birth dose vaccine (yes or no); and HBIG at birth (yes or no). We only considered studies in which sensitivity and specificity estimates could be stratified by the type of preventive measure provided to the mother–child pairs. We did not consider studies that provided antiviral therapy to mothers during pregnancy, since our objective is to evaluate these HBV markers as a tool to identify pregnant women who would benefit from antiviral therapy during pregnancy.

Other inclusion and exclusion criteria: study design, languages, dates of publication

We included studies with any design, published in any language, which used an HBV DNA threshold to dichotomize HBV DNA levels into high and low. This threshold needed to be at least higher than 20 000 IU/mL. Moreover, studies needed to provide sufficient data to draw a 2x1 or 2x2 table with the cross-classification of the reference test results (high vs low HBV DNA levels) and the index test results (positive vs negative HBeAg serostatus) in pregnant women with CHB without concomitant anti-HBV therapy. We excluded studies that selected participants based on the index test (i.e. maternal HBeAg status) to avoid verification bias (22). Studies published between 1 January 2000 and 3 April 2019 were considered.

3.3. Post-hoc analyses

For the post-hoc analyses, we included studies evaluating mother–child pairs, in which child outcomes could be stratified by different maternal HBV DNA levels during pregnancy with a narrow range (≤1.0 log IU/mL; such as <4.0, 4.0–4.9, 5.0–5.9, 6.0–6.9, and ≥7.0 log IU/mL). At each stratum defined by maternal viral load, there should be ≥10 infants assessed for MTCT. We excluded studies that selected participants based on maternal HBeAg status or maternal viral load to avoid verification bias (22). Studies published between 1 January 2000 and 3 April 2019 were considered.

3.4. Search strategy

The search terms employed covered “hepatitis B infection” AND “viral load” AND “pregnancy” and their variations. The databases searched included: four English-language databases (PubMed, EMBASE, Scopus, and CENTRAL (the Cochrane Library)); and two Chinese-language databases (the China National Knowledge Infrastructure [CNKI] and the Wanfang database). The search strategies used for each of the databases are presented in Appendix A.

A manual search through the references of the included studies, as well as through those of relevant systematic reviews identified through the literature search, was undertaken to identify any further eligible studies. Expert opinion was also sought to include other relevant studies.

3.5. Conduct of the review

Titles and abstracts for all of the publications identified by the search strategy were independently screened for relevance by two reviewers (PB and KY). Following selection of potentially eligible studies, full-text reading and reviewing was independently performed. Finally, the two reviewers discussed the list of eventually eligible studies, and if discrepancies existed that could not be resolved between the two reviewers, a third reviewer (YS) was consulted in order to make the final decision. For the Chinese databases, the same procedure was followed by two independent Chinese reviewers (YL and TZ).

For all potentially eligible studies, if information was lacking within the full-text article that limited the ability to make a final decision on whether or not the study should be included, the corresponding author of that study was contacted by mail or phone.

The final protocol for this review was registered on the international prospective register of systematic reviews (PROSPERO) with the registration number: CRD42019138227 prior to starting the data analysis.

3.6. Quality appraisal

The quality of included studies was assessed independently by two reviewers.

Risk of bias and applicability of population, index and reference tests to the main review questions were evaluated using the Quality Assessment of Diagnostic Accuracy Studies (QUADAS-2) (23). A list of the signalling questions used for QUADAS2 are presented in Appendix B.

3.7. Data extraction

The data were extracted from the selected studies by the two independent reviewers for each of the English (PB and KY) and Chinese articles (YL and TZ), using a pre-piloted data extraction form (Appendix C). In case of disagreement in the data extracted between the two reviewers, a deliberation that involved a third person (YS) was carried out.

During data extraction, articles from the same study sites with overlapping recruitment periods, enrolment criteria, and treatment types were considered as being part of one study. The lead reviewer for both English (PB) and Chinese (YL) articles then followed up with the corresponding author(s) from each of the article groups in order to understand if there was any patient overlap. If the authors explicitly stated in their article that there is overlap, or if the authors responded to the email inquiry confirming overlap, or if the author did not respond, then only the data extracted from the most recently published article was used in data analysis. If authors denied any patient overlap between articles then data extracted from all the articles within the group were used. In the case of a group of articles from the same study where some articles were published in Chinese and some in English, the latest English article was included in the data analysis sheet, unless a direct communication with the study authors directed the reviewers to use a different article in the group.

3.8. Data synthesis

All statistical analyses were performed using STATA 14.2 (Stata Corp LP, College Station, TX).

Sensitivity and specificity were estimated at each of different HBV DNA thresholds used in the included studies (≥20 000 IU/mL, ≥5 log10 IU/mL, ≥6 log10 IU/mL, ≥7 log10 IU/mL and ≥8 log10 IU/mL). In case a single study presented the results at multiple HBV DNA thresholds, all the different thresholds were used. In addition, for PICO2B and 2C, sensitivity and specificity were estimated specifically for each measure of prevention for HBV MTCT. The summary statistics were pooled only when there were at least three studies.

We performed bivariate analysis for studies allowing estimation of both sensitivity and specificity. Study-specific estimates of sensitivity and specificity along with their 95% CI were graphically presented in coupled forest plots. When there were at least three studies, the summary estimates for sensitivity and specificity along with their 95% CI were obtained using the DerSimonian–Laird bivariate random effects model. Positive and negative likelihood ratios (PLR, NLR) with 95% CIs were obtained from the pooled sensitivity and specificity. When there were <3 studies, the range of sensitivity, specificity, PLR, and NLR, were presented. Pre-test probabilities were estimated by pooling the proportion of pregnant women with CHB who had high viral loads. After the variance of the proportions was stabilized using Freeman–Tukey double arcsine transformation, these estimates were pooled using the DerSimonian–Laird random-effects model (24). Post-test probabilities were computed using the pre-test probabilities and the pooled PLR and NLR.

Heterogeneity in the estimates across the studies was visually assessed using: (i) coupled forest plots displaying study-specific estimates of sensitivity and specificity, and (ii) summary scatter plots. The summary scatter plots were presented without a summary receiver operating characteristic (SROC) curve for PICO2A and with a SROC curve for PICO2B and 2C. Characteristics of the outlier studies were narratively described. A sensitivity analysis was also performed after excluding these outlier studies.

Heterogeneity was also assessed statistically, by considering the following variables as a priori potential sources of heterogeneity: type of HBeAg assay, type of reference standard (commercial PCR vs other/not reported), mean/median maternal age, maternal virological characteristics (HIV/HCV/HDV coinfection status and HBV genotypes), WHO region, and study’s risk of bias (high vs low). In addition, for PICO2B and 2C, the measures of prevention for HBV MTCT were considered. Models fitted with and without the covariate were compared using likelihood ratio tests assuming equal variances. When there was good evidence (P<0.05) to support the heterogeneity, another model was fitted with separate variances and compared to the model with equal variances to understand if the heterogeneity observed could be due to the differences in variances between studies within a category rather than differences between categories of variables identified as potential sources of heterogeneity.

To integrate estimates from studies that provided data only for sensitivity or specificity, we performed univariate analyses using the DerSimonian–Laird univariate random effects model. When the study estimates could not be pooled (<3 studies), the range of sensitivity and specificity was presented.

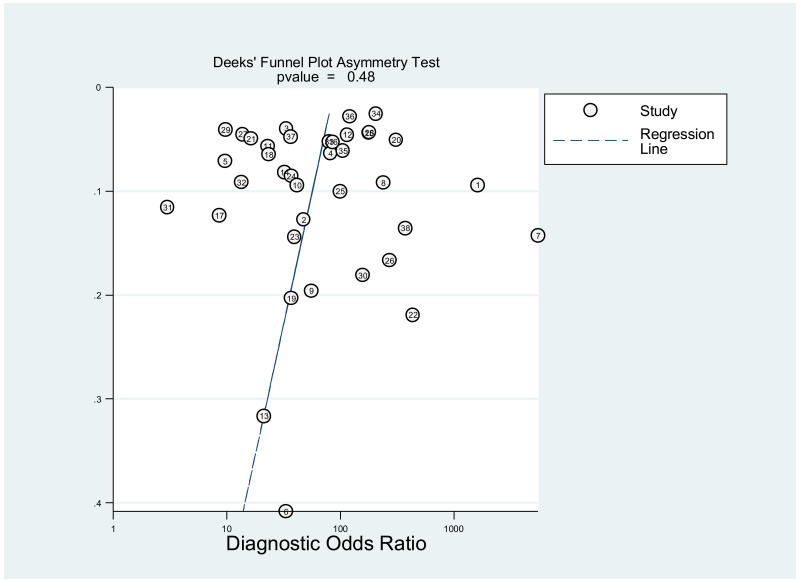
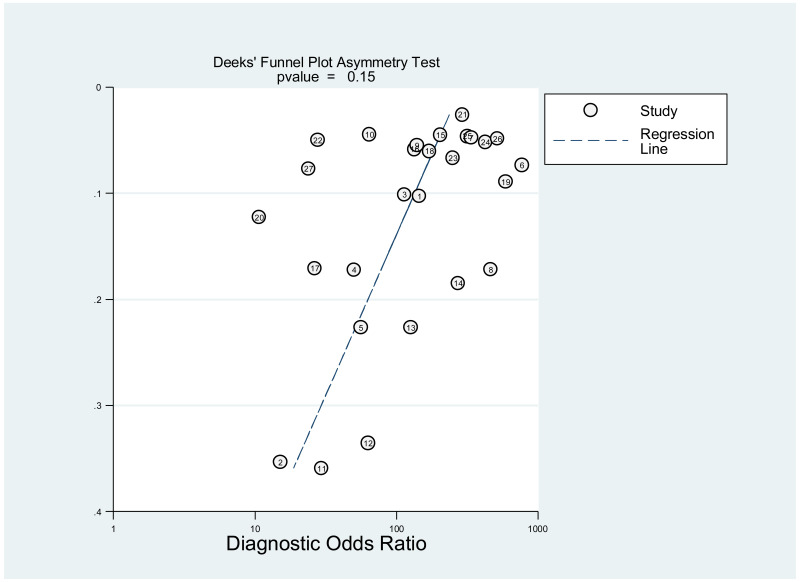
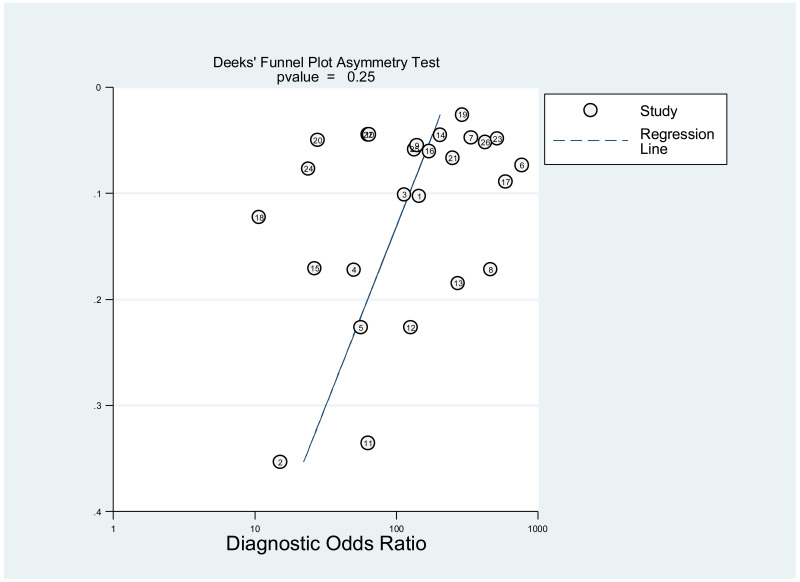
Publication bias was assessed using Deeks’ test, which was developed specifically for diagnostic accuracy reviews and is the method recommended in the Cochrane Handbook for Diagnostic Test Accuracy Reviews (25). It tests the asymmetry of the plot of log diagnostic odds ratio (lnDOR) against 1/effective sample size (ESS)1/2. The ESS is a function of the number of diseases (n1) and non-diseased participants (n2) ((4n1*n2)/(n1 + n2)) and this takes into account the numbers of diseased and non-diseased participants (26,27).

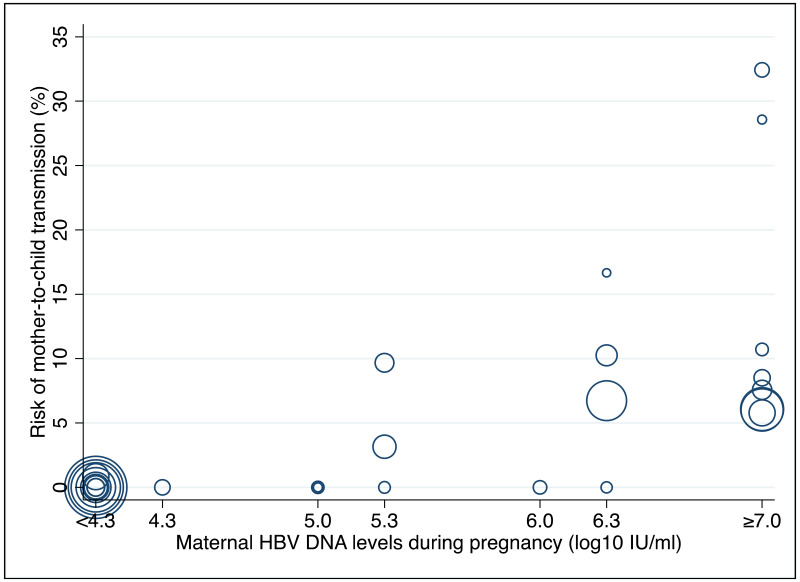
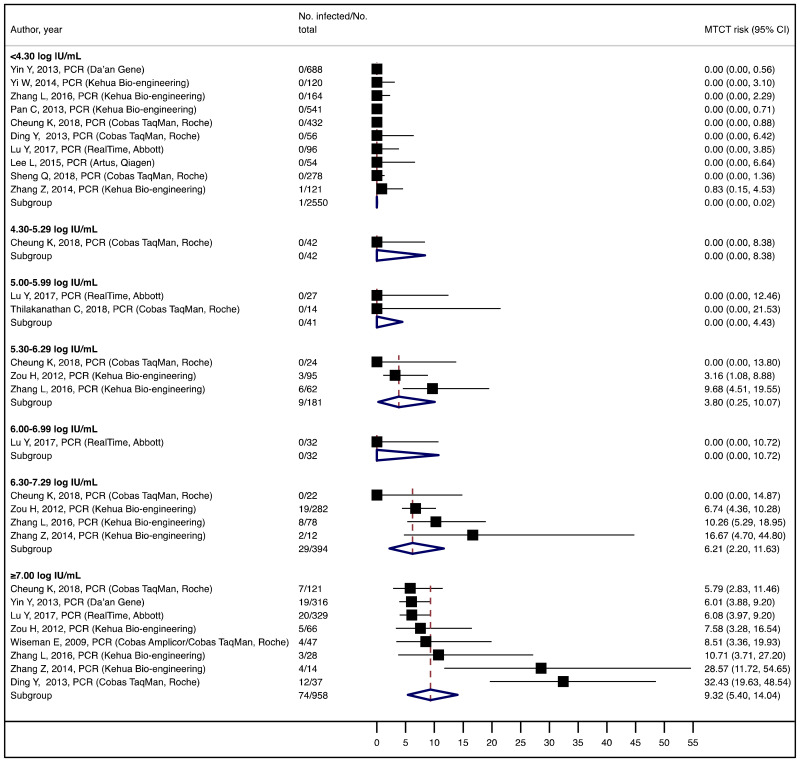
The post-hoc analysis 1 was conducted as below. For the studies using “IU/mL” as a unit for HBV DNA levels, MTCT risk was estimated for the following maternal HBV DNA levels during pregnancy: <4.00; 4.00–4.99; 5.00–5.99; 6.00–6.99; and ≥7.00 log10 IU/mL. For those using “copies/mL”, the maternal viral load was transformed into “IU/mL” (by dividing by the factor of 5) and risk was estimated for the following HBV DNA levels: <4.30; 4.30–5.29; 5.30–6.29; 6.30–7.29; and ≥7.30 log10 IU/mL. In case a single study presented the results at multiple HBV DNA thresholds, all different thresholds were used.

Once the HBV DNA level where the risk of MTCT was identified despite infants’ immunoprophylaxis, post-hoc analysis 2 was conducted. The sensitivity and specificity of the HBeAg test to diagnose this HBV DNA threshold were estimated using the method described above.

3.9. GRADE review process

For each examined PICO question, the quality of the evidence was evaluated using the Grading of Recommendations Assessment, Development and Evaluation methodology (GRADE) (28). We used this tool to evaluate: (i) the risk of bias; (ii) inconsistency (high heterogeneity); (iii) imprecision (confidence intervals); (iv) indirectness (use of surrogate outcomes); (v) reporting and publication bias; and (vi) other factors; for each of the outcomes. This eventually gave a score of high (further research is very unlikely to change the effect estimate), moderate, low or very low (all estimates are very uncertain). Decisions for the complex judgements within the GRADE table were made through study group consensus. The study group reviewers were supported in the process of completing this GRADE template through discussion and advice from a WHO-designated methodological expert, Professor Roger Chou (Oregon Health & Science University, USA). For this specific meta-analysis, the following rules were used to determine whether or not a group of studies had no serious, serious, or very serious issues with regard to GRADE criteria:

-

GRADE scoring system:

As cohorts and cross-sectional studies can provide reliable evidence for diagnostic accuracy, strength of evidence was initially rated as high quality (29). Then, strength of evidence was lowered by one degree if there was “serious” and by two degrees if there was “very serious” risk of bias, inconsistency, indirectness or imprecision. The strength of evidence was similarly lowered by one degree if publication bias was “likely” and by two degrees if the bias was “very likely” (30).

-

Risk of bias:

A study was considered as “high” overall risk of bias when multiple QUADAS-2 domains were rated as “high risk of bias”. Then, for each outcome, the number of studies with “high risk of bias” was counted. The risk of bias for the outcome was rated as “very serious”, “serious” or “not serious” when the proportion of studies rated as “high risk of bias” was >75%, >50–75% or ≤50%, respectively.

-

Indirectness:

Indirectness is linked with the level of applicability of the study population, index test or reference standard to the review question. A study was considered as “high” overall concern about applicability when at least one out of the three QUADAS-2 domains was rated as “high concern about applicability”. Then, for each outcome, the number of studies with “high concern about applicability” was counted. Indirectness for the outcome was rated as “very serious”, “serious” or “not serious” when the proportion of studies rated as “high concern about applicability” was >75%, >50–75% or ≤50%, respectively (29).

-

Imprecision:

Imprecision was considered “not serious” when an absolute range in the 95% confidence intervals (95% CI) for a pooled sensitivity or specificity was ≤20%. Imprecision was “serious” or “very serious” when the range was 20–40% or >40%. Moreover, when the cumulated sample size for all included studies was <30, it was categorized as “very serious”.

-

Inconsistency:

Inconsistency was considered “not serious” when ≥75% of studies’ estimates were within +/–20% of the pooled estimate for an outcome. Inconsistency was considered “serious” or “very serious” when this proportion was 50–75% or <50%.

-

Publication bias:

This was not assessed as part of the GRADE, because none of the studies, except one, was designed to assess diagnostic accuracy. Therefore, the analysis based on the diagnostic odds ratio seemed irrelevant.

4. Results

4.1. Flowchart for PICO questions

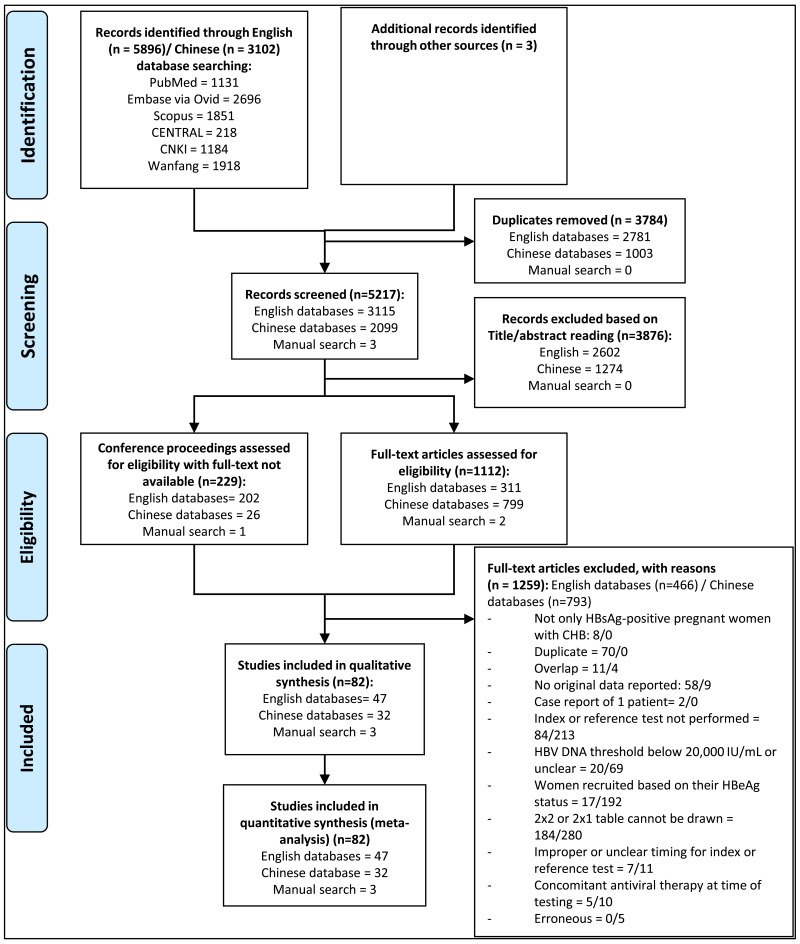
The search strategy identified a total of 9001 papers. After excluding 3784 articles in duplicate, 5217 were screened, and 1341 papers potentially eligible for the study were fully assessed. Finally, 82 papers were included in this review (Fig. 1). Reasons for exclusion are presented in Fig. 1.

Fig. 1. PRISMA diagram.

Fig. 1PRISMA diagram

4.2. PICO2A: Performance of HBeAg to identify women with high HBV DNA viral loads

Detailed characteristics of each included study are presented in Table 2.

Table 2Characteristics of the 82 studies included for the PICO2A

Author, yearPICO2ACountryOriginal study designHBV DNA threshold(s) (IU/mL)HBV DNA assayHBeAg assayMTCT clinical endpointParticipants with both index and reference standard test, nMaternal age (years)HIV, n (%)Children tested, n
Bai H, 2010 (31)BivariateChinaRetrospective cohort5 log10PCR Da’an GeneFIA (Anytest SYM-BIO)No120Mean (SD): 27.2 (3.2)UnknownN/A
Bissinger A, 2013 (32)BivariateGermanyCross-sectional5 log10PCR COBAS Taqman (Roche)ELISA (ETI-EBK PLUS Diasorin)No183Median: 31UnknownN/A
Cai J, 2005 (33)BivariateChinaCross-sectional5 log10Real-Time Fluorescence quantitative PCR (PG Biotech)ELISA (WB-2496 HBeAg Wantai)No709UnknownUnknownN/A
Cai S, 2009 (34)BivariateChinaCross-sectional20,000Real-Time Fluorescence quantitative PCR (Kelong Bio-hightech)ELISA (Intec HBeAg)No198UnknownUnknownN/A
Carey I, 2017 (35)Univariate (Specificity)UKCross-sectional5 log10PCR COBAS Taqman (Roche)CLIA (Architect Abbott)No238UnknownUnknownN/A
Carey I, 2018 (36)BivariateUKCross-sectional5 log10PCR COBAS Taqman (Roche)CLIA (Architect Abbott)No514Median: 31UnknownN/A
Chang C, 2017 (37)Univariate (Sensitivity)USARetrospective cohort5 log10PCR (unknown manufacturer)UnknownNo32Mean (SD): 29 (4)UnknownN/A
Chen T, 2018 (38)BivariateChinaProspective cohort6 log10PCR Da’an GeneCLIA (Architect Abbott)Yes499Median (Range): 27 (19-42) (n=951)Unknown499
Chen T, 2018 (39)Univariate (Sensitivity)ChinaProspective cohort6 log10PCR Da’an GeneCLIA (Architect Abbott)Yes48Median (Range): 24.25 (19-38)0/48 (0.0%)48
Chen Z, 2017 (40)BivariateChinaProspective cohort5 log10Real-Time Fluorescence quantitative PCR (Kehua Bio-engineering)ELISA (AxSYM Abbott)Yes211Mean: 26.960/211 (0.0%)168
Cheng S, 2006 (41)BivariateChinaProspective cohort20,000PCR (unknown manufacturer)ELISA (Unknown manufacturer)No110UnknownUnknownN/A
Cheung K, 2019 (42)BivariateChinaCross-sectional6, 7 & 8 log10PCR COBAS Taqman (Roche)CLIA (Elecsys Roche)No325Median (IQR): 32 (26-38)UnknownN/A
Chotun N, 2017 (43)BivariateSouth AfricaProspective cohort20,000 & 5 log10PCR COBAS Taqman (Roche)CLIA (Architect Abbott)Yes6Mean (Range): 27 (21-34)0/6 (0.0%)4
Dervisevic S, 2007 (44)BivariateUKProspective cohort5 log10PCR COBAS Taqman (Roche)UnknownNo114UnknownUnknownN/A
Ding Y, 2013 (45)BivariateChinaProspective cohort7 log10PCR COBAS Taqman (Roche)CLIA (Architect Abbott)Yes249Unknown (Range: 16-45) (n=4536)Unknown249
Dolman G, 2018 (46)BivariateUKCross-sectional5 log10UnknownCLIA (Architect Abbott)No423Median (IQR): 30 (28-35)UnknownN/A
Dopico E, 2013 (47)BivariateSpainCross-sectional7 log10PCR AbbottCLIA (Ortho Vitros)No4UnknownUnknownN/A
Dyson J, 2014 (48)BivariateUKRetrospective cohort20,000 & 7 log10UnknownUnknownNo56Median (Range): 28 (18-40) (n=81)2/81 (2.5%)N/A
Eilard A, 2019 (49)BivariateSwedenProspective cohort7 log10PCR COBAS Taqman (Roche)CLIA (Architect Abbott)Yes42Mean: 32.30/42 (0.0%)44
Elefsiniotis I, 2007 (50)BivariateGreeceCross-sectional7 log10PCR Amplicor HBV Monitor test (Roche)ELISA (AxSYM Abbott)No63UnknownUnknownN/A
Foaud HM, 2019 (51)BivariateEgyptProspective cohort5 log10Real-time PCR MX 400ELISA (ETI-EBK PLUS Diasorin)Yes41Mean: 27.30/41 (0.0%)39
Fujiko M, 2015 (52)BivariateIndonesiaCross-sectional6 log10PCR COBAS Taqman (Roche)ELISA (Monolisa HBeAg-Ab PLUS Bio-Rad)No64Median (Range): 29 (Range: 18-42)0/64 (0.0%)N/A
Godbole G, 2013 (53)BivariateUKCross-sectional6 & 7 log10PCR AbbottCLIA (Elecsys Roche or Architect Abbott)No293Median (Range): 29 (15-46)UnknownN/A
Guo F, 2007 (54)BivariateChinaCross-sectional6 log10Real-Time Fluorescence quantitative PCR (PG Biotech)ELISA (Intec HBeAg)No319UnknownUnknownN/A
Han Y, 2007 (55)BivariateChinaProspective cohort20,000PCR (Haoyuan Biotech)CLIA (Elecsys Roche)No69Mean (Range): 26 (22-38)UnknownN/A
Hao X, 2015 (56)BivariateChinaProspective cohort5 log10Real-Time Fluorescence quantitative PCR (Shanghai Fosun Pharmaceutical Group)ELISA (Kehua HBeAg test)No154Mean (SD): 27.4 (4.3)UnknownN/A
Hu Q, 2007 (57)BivariateChinaCross-sectional20,000 & 7 log10Real-Time Fluorescence quantitative PCR (PG Biotech)ELISA (Robio RongSheng)No420Mean (Range): 25 (18-37) (n=3658)0/420 (0.0%)N/A
Huang L, 2014 (58)BivariateChinaRetrospective cohort5 log10UnknownELISA (Dayou HBeAg Dakewe)No324Unknown (Range: 20-36)UnknownN/A
Jackson V, 2015 (59)Univariate (Sensitivity)IrelandRetrospective cohort6 log10Real-Time Fluorescence quantitative PCR (Kehua Bio-engineering)CLIA (Architect Abbott)Yes36Median (Range): 26 (16-40)Unknown21
Jin C, 2007 (60)BivariateChinaCross-sectional6 log10PCR Da’an GeneUnknownNo204UnknownUnknownN/A
Johannessen A, 2017 (61)BivariateEthiopiaProspective cohort6 log10PCR AbbottELISA (Vidas HBeAg/anti-Hbe Biomérieux)No63Median (Range): 28 (18-41) (n=131)UnknownN/A
Köse S, 2011 (62)BivariateTurkeyRetrospective cohort20,000 & 5,6,7 log10PCR COBAS Taqman (Roche)ELISA (Liaison Diasorin)No7Mean 26.5 (4.0)0/7 (0.0%)N/A
Kubo A, 2014 (63)BivariateUSARetrospective cohort5 &7 log10Real-Time Fluorescence quantitative PCR (Kehua Bio-engineering)ELISA (Unknown manufacturer)Yes835Mean (SD): 31 (5.3) (n=4446)Unknown835
Lao PDR T, 2012 (64)BivariateChinaCross-sectional8 log10PCR COBAS Taqman (Roche)UnknownNo56Mean: 31.95UnknownN/A
Latthaphasavang V, 2019 (65)BivariateLao PDRProspective cohort5 log10Real-time PCR (Fast-track Diagnostics)ELISA (Monolisa HBeAg-Ab PLUS Bio-Rad)Yes153Median (IQR): 28 (24-30)1/153 (0.7%)120
Lee L, 2015 (66)BivariateSingaporeProspective cohort20,000PCR artus HBV PCR Kits, QIAGENCLIA (Architect Abbott)Yes161Mean (SD): 32.4 (4.7)Unknown154
Li X, 2018 (67)BivariateChinaRetrospective cohort20,000 & 5, 6, 7 log10Real-Time Fluorescence quantitative PCR (Shanghai Fosun Pharmaceutical Group)CLIA (Architect Abbott)No716Unknown0/716 (0.0%)N/A
Li Y, 2013 (68)BivariateChinaProspective cohort20,000 & 7 log10Real-Time Fluorescence quantitative PCR (Toyobo)ELISA (Unknown manufacturer)No140Unknown0/140 (0.0%)N/A
Liang P, 2017 (69)BivariateChinaCross-sectional5 log10ABI 7500 real-time PCR system (Applied Biosystems)CLIA (Architect Abbott)No391Unknown0/391 (0.0%)N/A
Lin J, 2002 (70)BivariateChinaRetrospective cohort20,000 & 5, 6 log10Real-Time Fluorescence quantitative PCR (Biotromics technologies)ELISA (WB-2496 HBeAg Wantai)No69UnknownUnknownN/A
Liu CP, 2015 (71)Univariate (Sensitivity)ChinaRetrospective cohort6 log10PCR Da’an GeneELISA (HBeAg Santa-Cruz)Yes256Mean: 25.70/256 (0.0%)256
Liu H, 2013 (72)BivariateChinaCase-control5 log10PCR Da’an GeneCLIA (Elecsys Roche)No259Mean (SD): 28 (4)UnknownN/A
Liu Y, 2016 (73)Univariate (Sensitivity)ChinaProspective cohort6 log10ABI 7500 real-time PCR system (Applied Biosystems)CLIA (Architect Abbott)Yes110Mean 27.70/110 (0.0%)78
Lu H, 2009 (74)BivariateChinaProspective cohort5 & 8 log10Real-Time Fluorescence quantitative PCR (PG Biotech)FIA (Anytest SYM-BIO)No33Mean (Range): 26.2 (21-34)UnknownN/A
Lunel-Fabiani F, 2018 (75)BivariateCamerounProspective cohort20,000 & 5, 6, 7, 8 log10HBV Aptima, HologicUnknownYes594Median (IQR): 24 (20-30)1/592 tested (0.2%)133
Ma Y, 2014 (76)BivariateChinaProspective cohort20,000PCR (unknown manufacturer)ELISA (Unknown manufacturer)No675Mean (SD): 26.5 (2.8)UnknownN/A
Michitaka K, 2012 (77)BivariateJapanProspective cohort6 log10Real-Time Fluorescence quantitative PCR (Kehua Bio-engineering)CLIA (Unknown manufacturer)No21Median (IQR): 34 (IQR: 25-40)UnknownN/A
Peng N, 2012 (78)BivariateChinaCross-sectional5 log10Real-Time Fluorescence quantitative PCR (Kehua Bio-engineering)CLIA (Architect Abbott)No410UnknownUnknownN/A
Peng S, 2019 (79)BivariateChinaProspective cohort6 log10PCR Da’an GeneELISA (Kehua HBeAg)Yes1219Mean: 29.170/1219 (0.0%)93
Pirillo M, 2007 (80)BivariateUganda and RwandaCross-sectional6 log10In-house PCRELISA (Murex HBeAg/anti-Hbe)No7Unknown7/7 (100.0%)N/A
Pirillo M, 2015 (81)BivariateMalawiProspective cohort20,000 & 5, 6, 7, 8 log10Versant kPCR HBV DNA 1.0 (Siemens)CLIA (Architect Abbott)Yes21Median (IQR): 27 (23-30) (n=27)27/27 (100.0%)17
Punzalan C, 2012 (82)BivariateUSARetrospective cohort7 log10UnknownUnknownYes200UnknownUnknown200
Rouet F, 2004 (83)BivariateIvory CoastCross-sectional5 log10Non-PCR (Quantiplex HBV DNA, Bayer)ELISA (Murex HBeAg/anti-Hbe)No77Mean: 25 (n=501)45/77 (58.4 %)N/A
Samadi Kochaksaraei G, 2016 (84)BivariateCanadaProspective cohort7 log10PCR COBAS Taqman (Roche)CLIA (Architect Abbott)No99Median (IQR): 32 (29-35)0/99 (0.0%)N/A
Ségéral O, 2018 (85)BivariateCambodiaProspective cohort5 & 6 & 7 log10PCR targeting the S gene of HBV (PUMA HBV kit, Omunis)RDT (SD Bioline HBeAg test)No128Median (IQR): 29 (25-32) (n=250)UnknownN/A
Sellier P, 2017 (86)Univariate (Sensitivity)FranceProspective cohort5 log10PCR COBAS Taqman (Roche)CLIA (Architect Abbott)No27Mean (SD): 28.2 (4.7)0/27 (0.0%)N/A
Seo K, 2018 (87)Univariate (Sensitivity)DR KoreaRetrospective cohort6 log10PCR COBAS Taqman (Roche)RIA (Abbott-Hbe Abbott)No41Median (Range): 32 (22-40)0/41 (0.0%)N/A
Shao Z, 2011 (88)BivariateChinaProspective cohort5 & 8 log10PCR Amplicor HBV Monitor test (Roche)ELISA (AxSYM Abbott)Yes212UnknownUnknown158
Sheng Q, 2018 (89)BivariateChinaProspective cohort6 log10PCR COBAS Taqman (Roche)CLIA (Architect Abbott)No441Mean (SD): 31.1 (4.5) (n=143 14)UnknownN/A
Shi Y, 2012 (90)BivariateChinaCross-sectional20,000 & 7 log10Real-Time Fluorescence quantitative PCR (Kehua Bio-engineering)ELISA (Suzhou Sym-Bio)No452UnknownUnknownN/A
Söderström A, 2003 (91)BivariateSwedenRetrospective cohort5,6 & 7 log10PCR Amplicor HBV Monitor test (Roche)ELISA (AxSYM Abbott)Yes46UnknownUnknown264
Tang A, 2018 (92)Univariate (Sensitivity)USACross-sectional5 log10Real-Time Fluorescence quantitative PCR (Kehua Bio-engineering)CLIA or ELISA (ELISA: Quest and BioReference; CLIA: LabCorp)No203Mean (Range): 29.2 (18-55) (n=978)UnknownN/A
Tang Y, 2013 (93)BivariateChinaCross-sectional5 &7 log10Real-Time Fluorescence quantitative PCR (Kehua Bio-engineering)ELISA (Kehua HBeAg test)No500Mean (Range): 27.8 (18-40)UnknownN/A
Thilakanathan C, 2018 (94)BivariateAustraliaRetrospective cohort5 & 6 log10PCR COBAS Taqman (Roche)CLIA (Architect Abbott)Yes642Median (Range): 30 (15-44)Unknown469
Van Zonneveld M, 2003 (95)Univariate (Sensitivity)The NetherlandsProspective cohort6 log10Non-PCR (Digene Hybrid Capture I/II assay)UnknownYes8Median (Range): 20 (17-25)0/8 (0.0%)8
Wang F, 2009 (96)BivariateChinaRetrospective cohort5 log10Real-Time Fluorescence quantitative PCR (Sangon)ELISA (Kehua HBeAg test)No1237UnknownUnknownN/A
Wang J, 2015 (97)Univariate (Sensitivity)ChinaProspective cohort6 log10PCR Da’an GeneCLIA (Architect Abbott)Yes48Mean (SD): 29.31 (3.82)0/48 (0.0%)48
Wang J, 2018 (98)BivariateChinaCross-sectional6 log10Real-Time Fluorescence quantitative PCR (Kehua Bio-engineering)UnknownNo567Mean (SD): 27.27 (3.35) (n=14132)UnknownN/A
Wang L, 2016 (99)BivariateChinaRandomized controlled trial20,000 & 5,6, 7 log10PCR AbbottFIA (Anytest SYM-BIO)No31Median (Range): 28.52 (19-39)31/31 (100.0%)N/A
Wang M, 2018 (100)BivariateChinaRetrospective cohort5 log10PCR AbbottUnknownNo76Unknown (Range: 20-40)0/76 (0.0%)N/A
Wang X, 2015 (101)BivariateChinaProspective cohort5 log10Real-Time Fluorescence quantitative PCR (Shanghai Fosun Pharmaceutical Group)CLIA (Architect Abbott)No409Unknown0/409 (0.0%)N/A
Wang X, 2015 (102)BivariateChinaCase-control5 log10PCR COBAS Taqman (Roche)ELISA (Unknown manufacturer)No120UnknownUnknownN/A
Wang Z, 2018 (103)BivariateChinaCross-sectional6 log10UnknownUnknownNo253Mean (SD): 29.38 (4.77)UnknownN/A
Wei K, 2017 (104)BivariateChinaCross-sectional5, 6, 7 & 8 log10PCR AbbottCLIA (Architect Abbott)No1741Median (Range): 26 (15-43) (n=1741)0/1741 (0.0%)N/A
Wiseman, E, 2009 (105)BivariateAustraliaProspective cohort5 & 8 log10PCR Amplicor HBV Monitor test (Roche)CLIA or ELISA (AxSYM Abbott or Architect Abbott)Yes313Unknown0/313 (0.0%)138
Xu C, 2018 (106)BivariateChinaCross-sectional6 log10Real-time fluorescence quantitative PCR reagents (Shenyou Biotechnology)CLIA or ELISA (Kehua HBeAg or Architect Abbott)No214Median (IQR): 25.3 (22.7-30.2)0/214 (0.0%)N/A
Xu H, 2008 (107)BivariateChinaCross-sectional20,000 & 6 log10Real-Time Fluorescence quantitative PCR (PG Biotech)ELISA (Intec HBeAg)No198UnknownUnknownN/A
Yin Yu-zhu, 2013 (108)BivariateChinaRetrospective cohort5 &7 log10PCR Da’an GeneELISA (Intec HBeAg)Yes1355Mean (SD): 28.83 (3.92)Unknown1360
Zhang L, 2017 (109)BivariateChinaCross-sectional20,000 & 5, 6, 7, 8 log10Real-Time Fluorescence quantitative PCR (Sansure Biotech)ELISA (Unknown manufacturer)No491UnknownUnknownN/A
Zhang Q, 2009 (110)BivariateChinaRetrospective cohort20,000PCR (unknown manufacturer)ELISA (Unknown manufacturer)No80UnknownUnknownN/A
Zheng H, 2010 (111)BivariateChinaCase-control6 log10Real-Time Fluorescence quantitative PCR (Kehua Bio-engineering)ELISA (Kehua HBeAg test)No478Mean (SD): 27 (6.2)0/478 (0.0%)N/A
Zhu B, 2013 (112)BivariateChinaRetrospective cohort5 log10PCR COBAS Taqman (Roche)CLIA (Elecsys Roche)Yes53Mean (SD): 26 (4.1)0/53 (0.0%)53

4.2.1. Summary of included studies

There were 82 original studies, including 71 allowing estimation of both sensitivity and specificity, using bivariate analysis, and 11 that can be only used for the univariate analysis to estimate sensitivity only (n=10) or specificity only (n=1). Except for one randomized controlled trial, all were observational studies: 28 cross-sectional, 50 cohorts (31 prospective and 19 retrospective) and 3 case–control studies (Table 2).

Table 3 summarizes the characteristics of studies included in the PICO2A. Across all 82 studies, recruitment took place as early as 1989 and up until 2018. Most studies took place in the WHO Western Pacific Region (n=54); including China (n=47), Cambodia (n=1), Democratic Republic of Korea (n=1), Japan (n=1), Lao People’s Democratic Republic (n=1), Singapore (n=1) and Australia (n=2). Fifteen studies took place in the WHO European Region: the United Kingdom (n=6), Sweden (n=2), France (n=1), Germany (n=1), Ireland (n=1), the Netherlands (n=1), Greece (n=1), Spain (n=1) and Turkey (n=1). Six studies took place in the WHO African Region: Ivory Coast (n=1), Uganda and Rwanda (n=1), Ethiopia (n=1), Malawi (n=1), South Africa (n=1), and Cameroon (n=1). Five studies took place in WHO region of the Americas: United States of America (n=4) and Canada (n=1). One study took place in the WHO South-East Asia Region in Indonesia, and one study took place in the WHO Eastern Mediterranean Region in Egypt (Table 2).

Of 82 studies, 52 reported maternal age; mean/median maternal age was higher in EUR/AMR regions (7/10 studies reporting a mean/median maternal age ≥28 years in EUR and 4/4 in AMR) and lower in the AFR Region (only n=1/4 reporting mean/median maternal age ≥28 years). EIA was most frequently used to assess pregnant women’s HBeAg status (n=35/72, 48.6%) followed by CLIA (n=29/72, 40.3%) for all WHO regions except EUR where CLIA was more frequently used than EIA (8 using CLIA vs 4 using EIA). FIA (time-resolved fluoroimmunoassay) was used only in Chinese studies (n=3/72, 4.2%). Only 1 study (1.4%) used a rapid diagnostic test (Ségéral O et al., 2018). Most studies exclusively included women without coinfection: n=40/60 (66.7%) for HIV, n=41/50 (82.0%) for HCV and n=26/30 (86.7%) for HDV). Only a few studies reported HBV genotypes (n=24/82) and, of this, the majority had mixed genotypes (n=18/24, 75.0%). Only two studies reported the frequency of indeterminate HBeAg results: Kubo A et al., 2014 (n=4/835 (0.5%)) and Tang A et al., 2018 (n=3/200 (1.5%)).

Table 3Characteristics of studies included in PICO2A

Subgroup variablesSubgroup categoryStudies (N)%
Overall82100.0
WHO region (n=82)WPR5465.9
SEAR11.2
EUR1518.3
EMR11.2
AFR67.3
AMR56.1
HBeAg assay type (n=72)EIA3548.6
FIA34.2
CLIA2940.3
RDT11.4
Multiple34.2
CIA/RIA11.4
Mean / median maternal age (n=52)<28 years2446.2
≥28 years2853.8
HIV status (n=60)All uninfected4066.7
All infected1118.3
Mixed population915.0
HCV status (n=50)All uninfected4182.0
All infected00.0
Mixed population918.0
HDV status (n=30)All uninfected2686.7
All infected00.0
Mixed population413.3
Genotype (n=24)Genotype A28.3
Genotype B00.0
Genotype C14.2
Genotype D312.5
Genotype E00.0
Mixed population1875.0

4.2.2. Risk of bias assessment

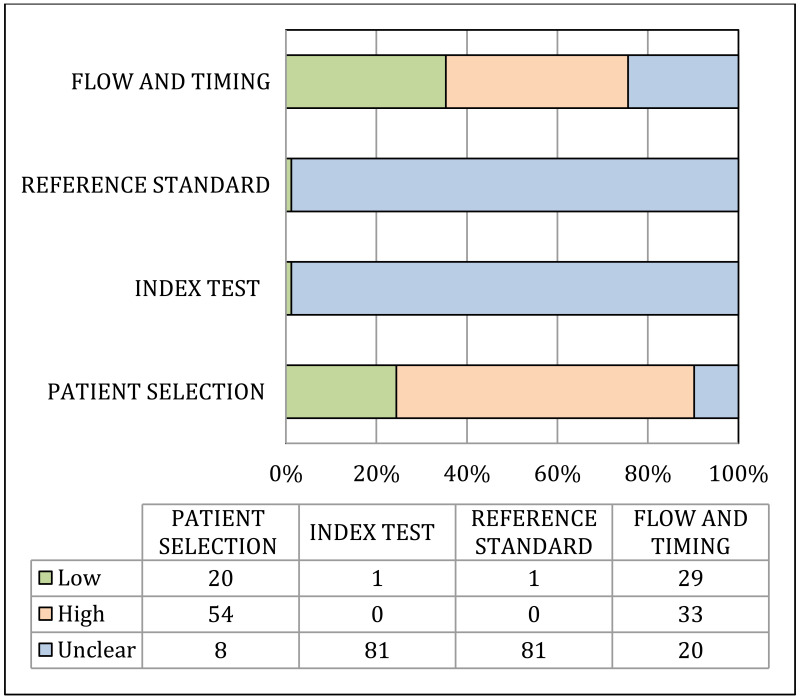
The risk of bias assessment is presented in Fig. 2 and 3 (full details are provided in Appendix D).

Only one study was designed to evaluate the diagnostic performance of an HBeAg test in pregnant women, and had the same objective as that of the PICO2A (85). Therefore, for the other diagnostic studies included, essential information was often missing. Except for the one study that shared the same objectives as PICO2A (85), all were rated as having an unclear risk of bias for both the reference standard and the index tests due to the fact that they did not state whether or not blinding was performed (Fig. 2). The risk of selection bias was high in most studies (n=54/82, 65.9%), mainly due to restrictive exclusion criteria (e.g. exclusion of HIV-, HCV-, or HDV-coinfected pregnant women).

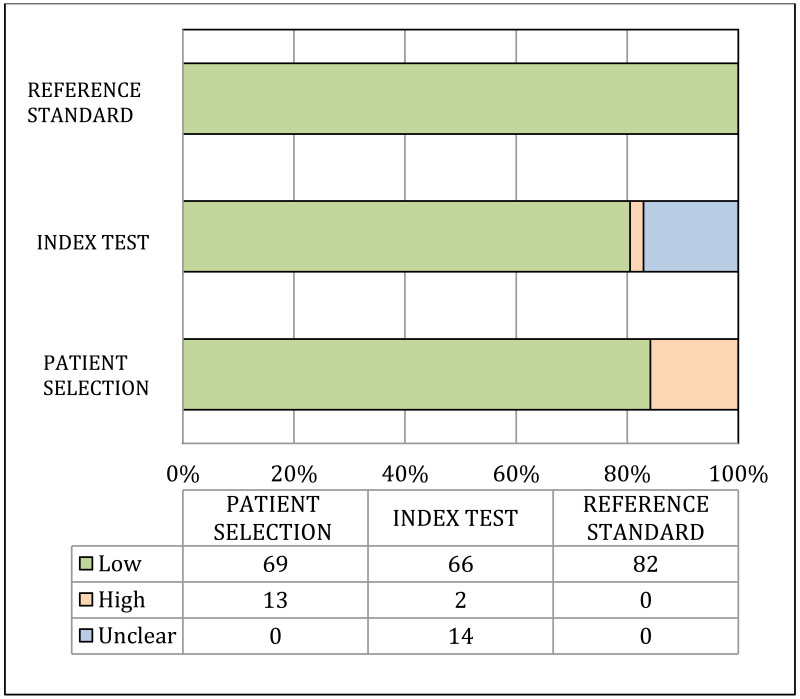
Concerns about applicability were low for most studies (Fig. 3). There was high concern for patient selection applicability in 13 studies (15.9%), due to the enrolment of pregnant women based on their HBV viral load. For two studies there was concern regarding the applicability of the index test, because HBeAg status was not systematically ascertained during the pregnancy. This was unclear for a further 14 studies (17.1%) that did explicitly report the timing of HBeAg testing or type of HBeAg assay test used.

Fig. 2. Risk of bias results for PICO2A.

Fig. 2Risk of bias results for PICO2A

Fig. 3. Concerns about applicability results for PICO2A.

Fig. 3Concerns about applicability results for PICO2A

4.2.3. Primary analysis, narrative descriptions and forest plots

4.2.3.1. Overall performance of HBeAg to identify pregnant women with high HBV DNA levels

Tables 4 and 5 present detailed performance results for PICO2A. Detailed results of the performance of HBeAg to identify pregnant women with high viral load ≥5, 6 and 7 log IU/mL are presented in the following sections.

Table 4Performance of HBeAg to identify pregnant women with high viral load, stratified by HBV DNA threshold

HBV DNA threshold (IU/mL)Meta-analysisStudies (N)Subjects (N)TP (N)FN (N)TN (N)FP (N)Se (95% CI) or Range SeSp (95% CI) or Range Sp
20,000Bivariate1945061121224259856391.0 (79.2-96.4)91.8 (83.6-96.1)
Univariate--------
5 log10Bivariate38137343486669868489584.2 (80.2-87.4)92.3 (89.5-94.5)
Univariate42142313719695891790082.5 (79.0-85.5)91.4 (88.9-93.5)
6 log10Bivariate2796512109160669169192.0 (88.2-94.6)92.7 (90.3-94.5)
Univariate34101962514300669169188.9 (84.0-92.4)91.7 (89.5-93.5)
7 log10Bivariate2488251416625972137598.0 (93.3-99.4)88.5 (80.7-93.4)
Univariate--------
8 log10Bivariate937865757257862698.5 (88.1-99.8)83.9 (77.0-89.1)
Univariate--------

Table 5Post-test probabilities of having high viral load depending on HBeAg test results in pregnant women

HBV DNA threshold (IU/mL)WHO regionStudies, NPre-test probability (%)PLR (95% CI)Post-test probability of having high viral load after positive HBeAg result (%)NLR (95% CI)Post-test probability of having high viral load after negative HBeAg result (%)
20,000Overall193411.1 (5.7-21.7)79.10.10 (0.04-0.23)3.2
WPR14368.9 (4.3-18.6)76.20.08 (0.03-0.24)3.0
AFR32131.4 (18.3-53.9)86.80.15 (0.10-0.22)3.1
5 log10Overall383111.0 (7.9-15.3)77.30.17 (0.14-0.22)5.0
WPR26377.9 (5.7-10.8)74.40.18 (0.14-0.24)6.3
AFR41926.0 (14.5-46.8)83.20.12 (0.05-0.33)2.3
6 log10Overall272212.6 (9.5-16.7)73.50.09 (0.06-0.13)1.9
WPR192410.4 (8.0-13.6)71.40.08 (0.05-0.13)1.9
AFR41624.90 (16.3-38.0)79.90.07 (0.03-0.13)1.0
7 log10Overall24148.5 (5.0-14.6)54.40.02 (0.01-0.08)0.3
WPR12144.6 (2.6-8.3)39.30.03 (0.01-0.10)0.4
AFR2185.7-19.350.5-77.70.00-0.050.0-21.6
8 log10Overall9116.1 (4.2-9.0)40.30.02 (0.00-0.16)0.2
WPR7115.7 (3.7-8.6)38.40.01 (0.00-0.49)0.1
AFR2134.5-11.136.9-59.00.00-0.030.0-10.5
4.2.3.2. Performance of HBeAg to identify pregnant women with HBV DNA ≥5 log10 IU/mL
  • Overall pooled sensitivity = 84.2% (95% CI: 80.2–87.4)
  • Overall pooled specificity = 92.3% (95% CI: 89.5–94.5)

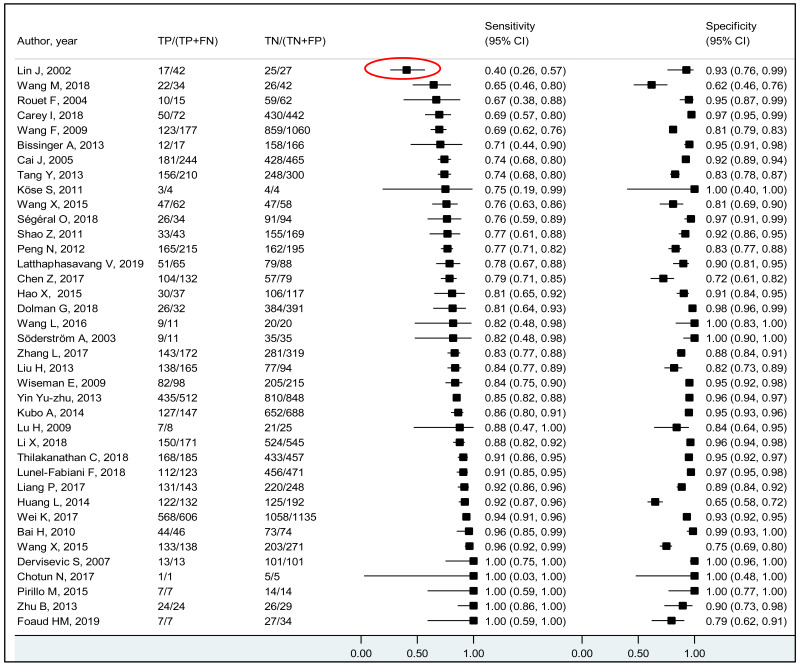
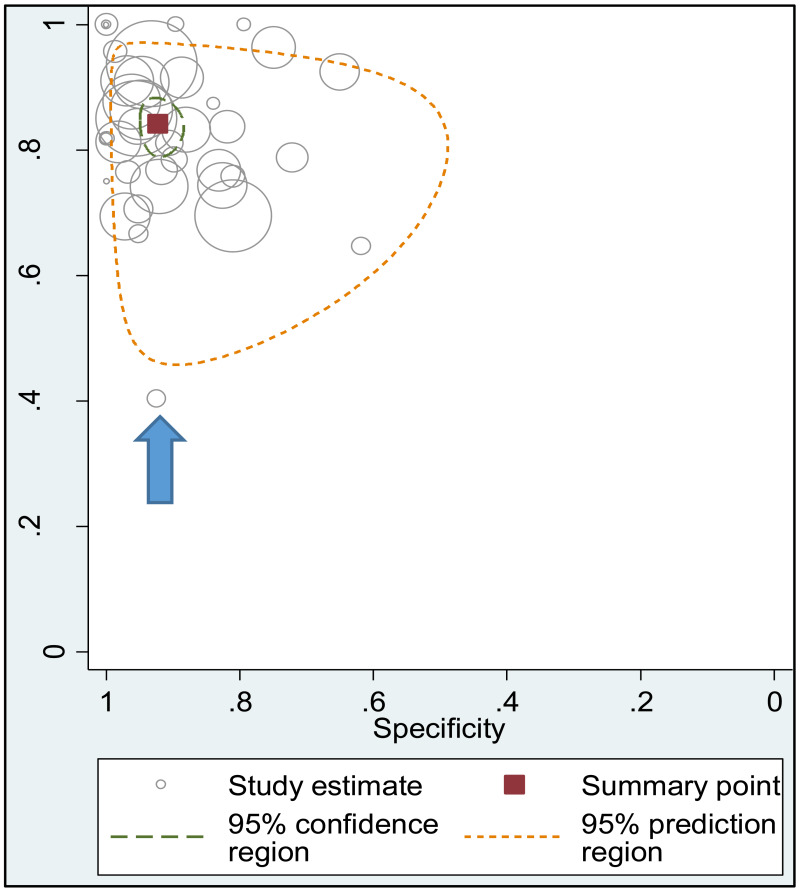
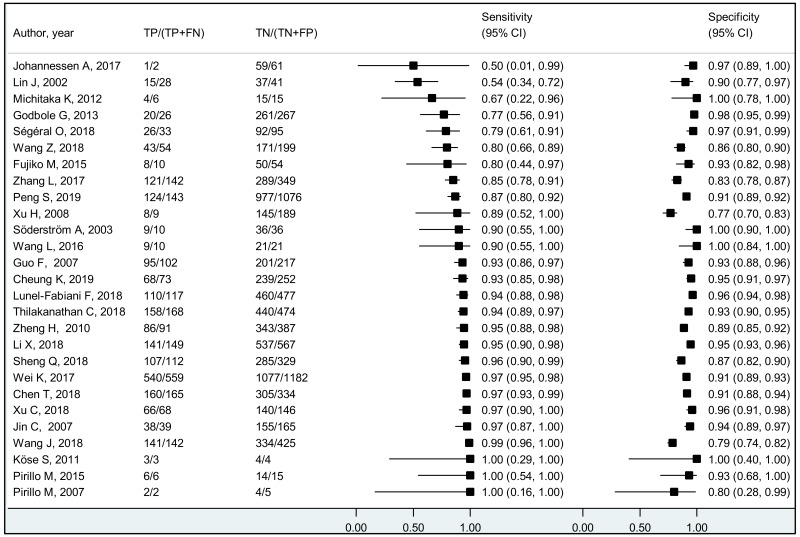
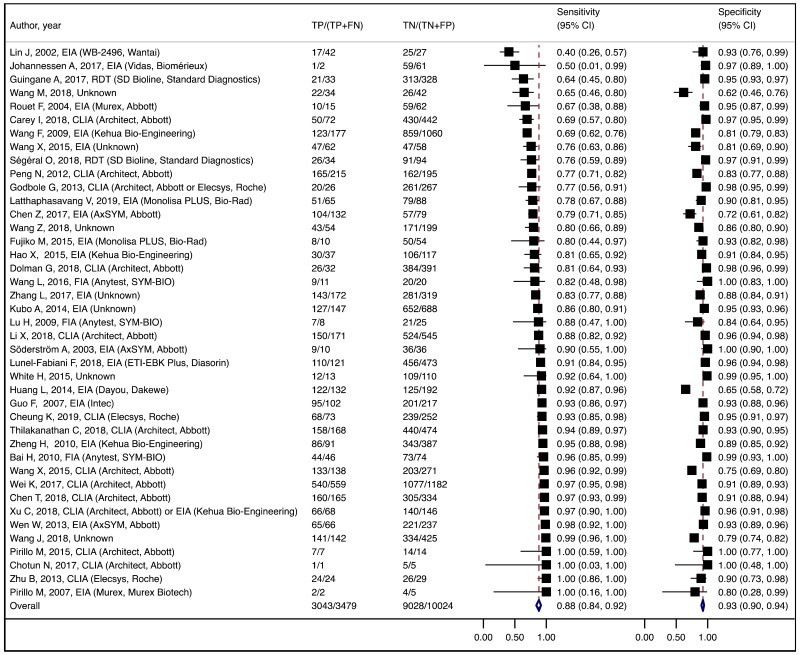
There was no evidence of publication bias (P=0.48) (Appendix G.1). However, the funnel plots for the assessment of publication bias were thought to be not very informative because only one study had the same objective as that of the PICO2A (85). We identified one outlier study (Lin J, 2002) through visual assessment of the overall coupled forest plot (Fig. 4) and the summary scatter plot (Fig. 5). This retrospective cohort study from China reported low sensitivity (40.5%) and high specificity (95.6%) of HBeAg to identify women with HBV viral load ≥5 log10 IU/mL. Recruitment was from 1999 to 2000. HBV DNA was measured using a commercial PCR (real-time fluorescence quantitative PCR [Biotromics technologies]). HBeAg was determined by tne ELISA test (WB-2496 Wantai). Maternal age and HIV status were not reported.

Fig. 4. Coupled forest plot of the performance of HBeAg to identify pregnant women with HBV viral load ≥5 log10 IU/mL.

Fig. 4Coupled forest plot of the performance of HBeAg to identify pregnant women with HBV viral load ≥5 log10 IU/mL

Fig. 5. Summary scatter plot of the performance of HBeAg to identify maternal HBV DNA ≥5 log10 IU/mL.

Fig. 5Summary scatter plot of the performance of HBeAg to identify maternal HBV DNA ≥5 log10 IU/mL

Subgroup analysis

Of the variables predefined as potential sources of heterogeneity, it was not possible to do a subgroup analysis by HCV- or HDV-coinfection status, nor by maternal HBV genotype as too few studies reported information on these factors.

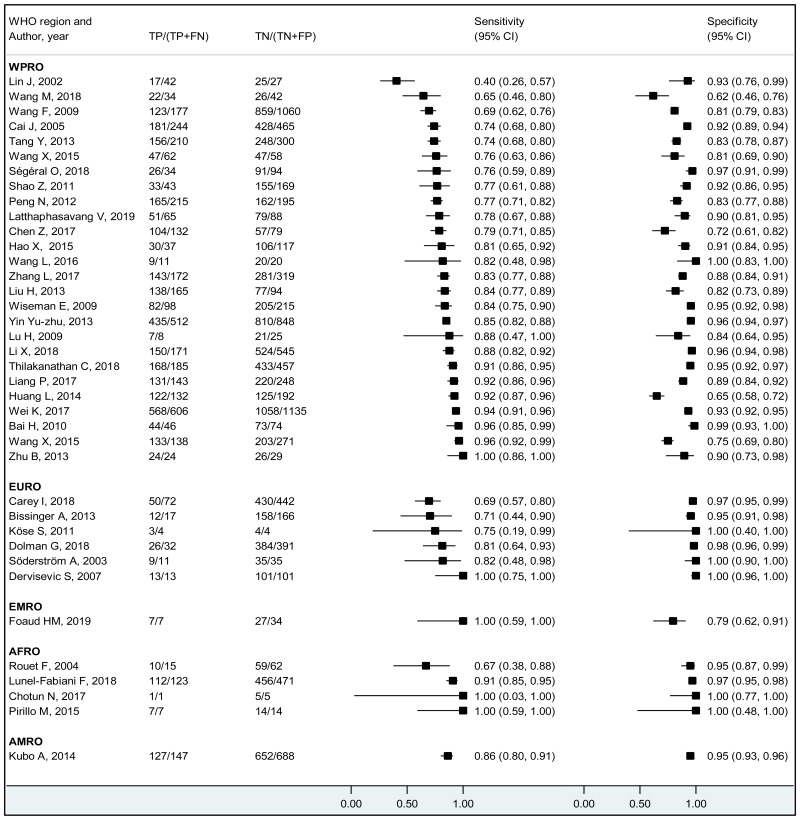
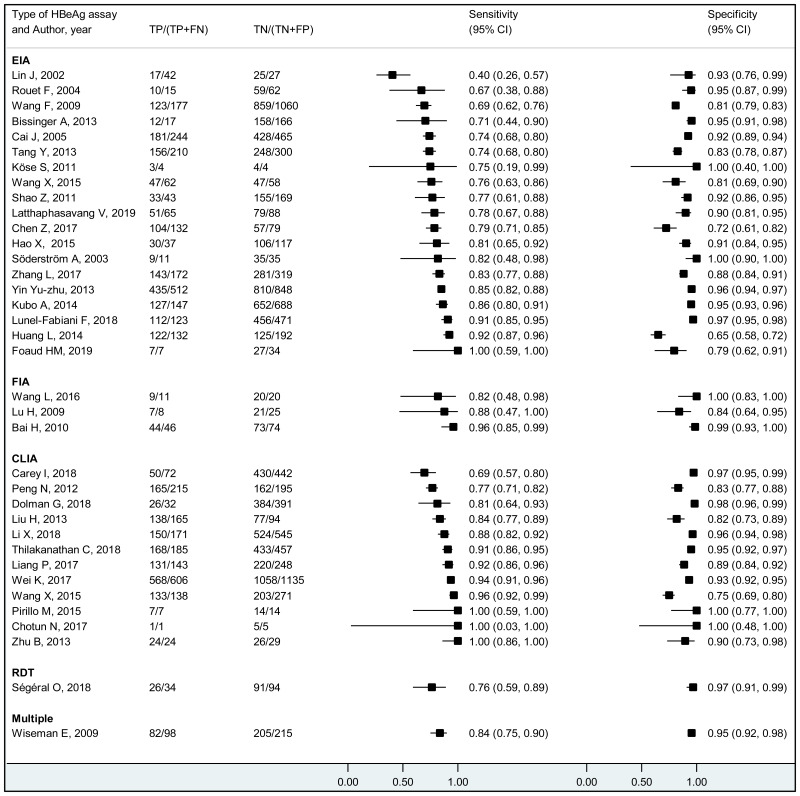
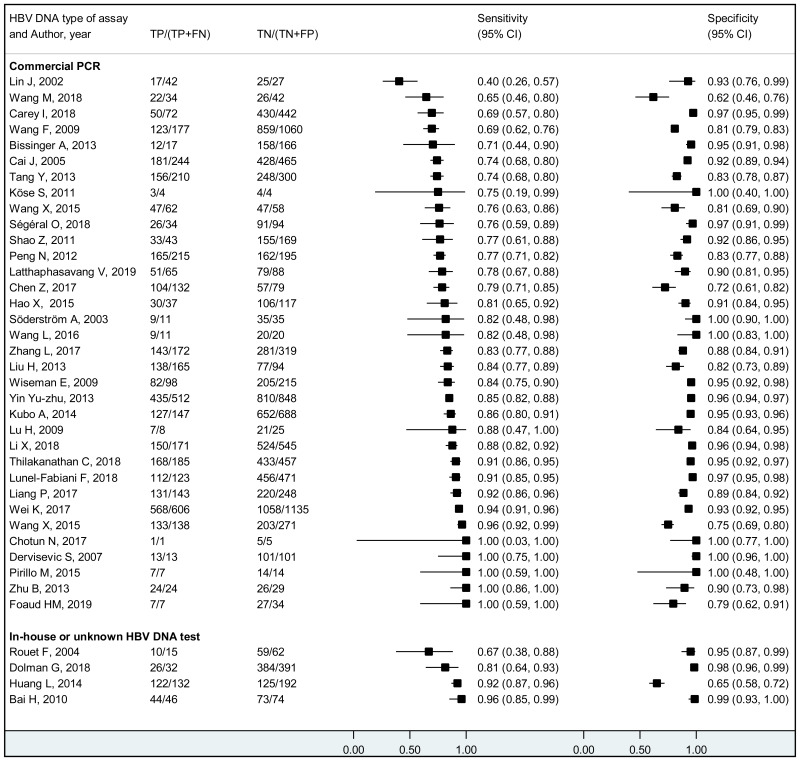
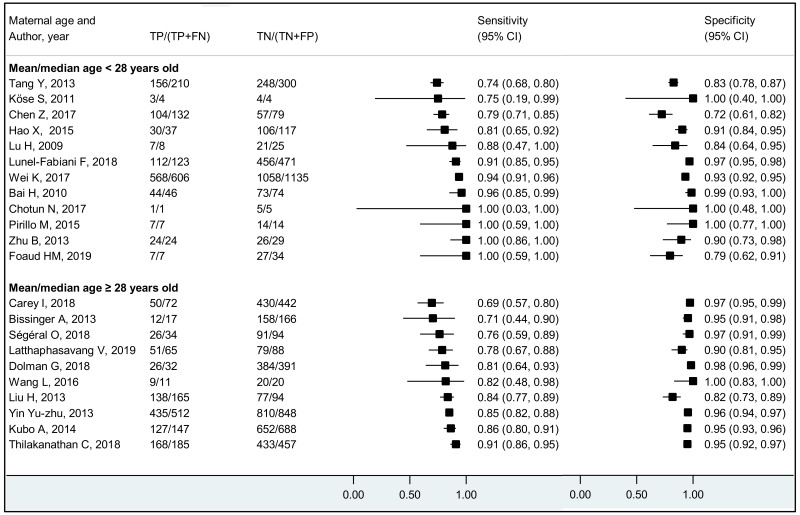
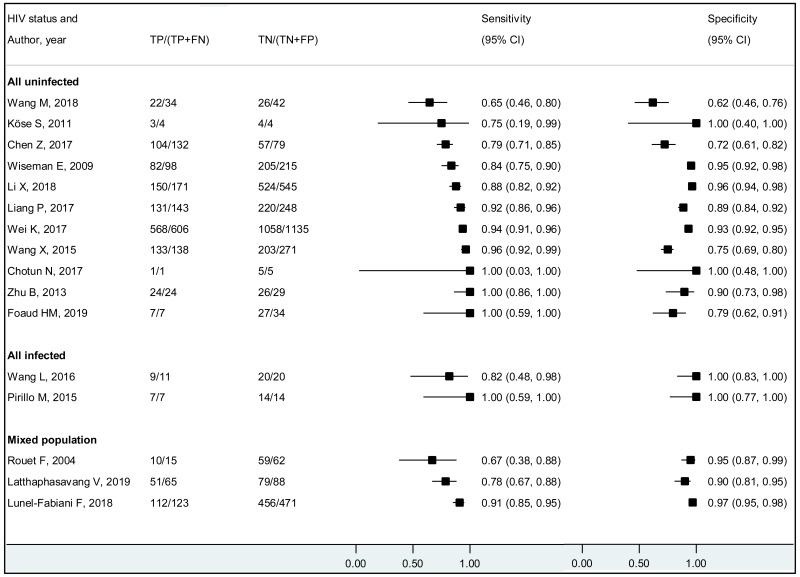
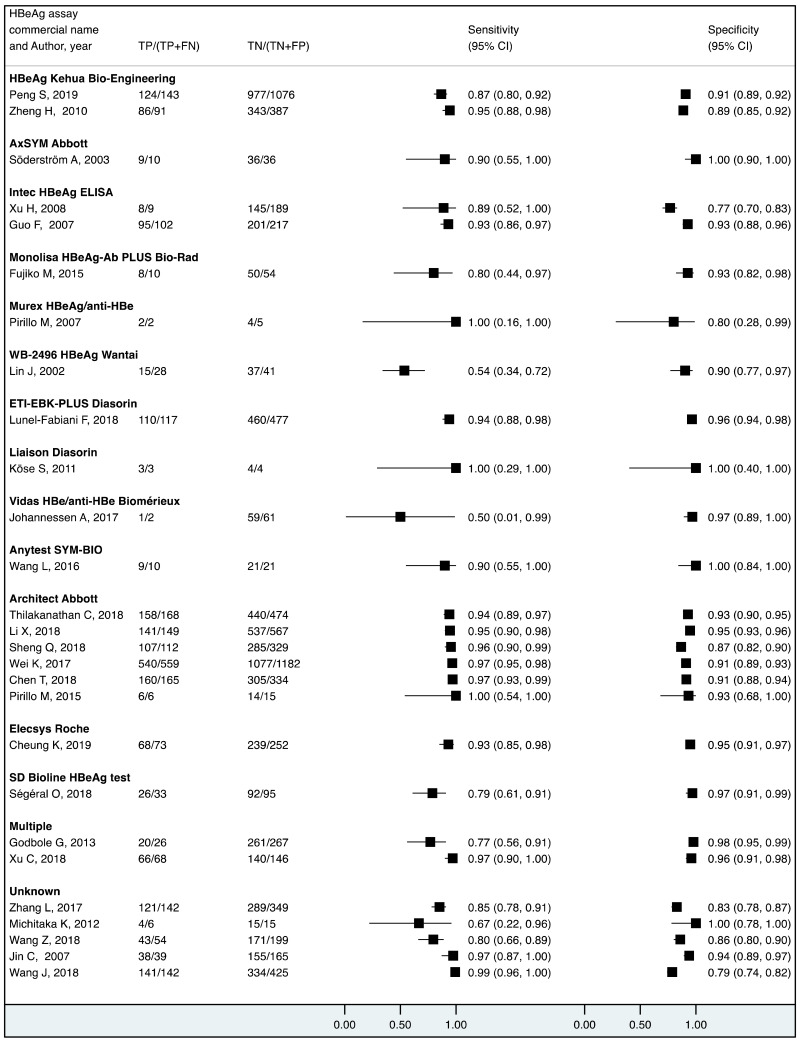
Table 6 and Fig. 6 to 11 present detailed results of the performance of HBeAg to identify pregnant women with HBV DNA ≥5 log10 IU/mL, stratified by the potential sources of heterogeneity.

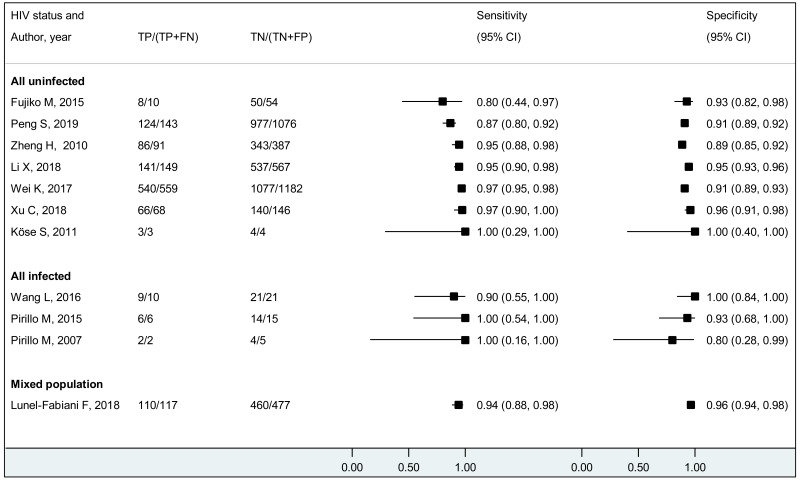
There was some evidence of interaction by maternal age (P=0.02), with a higher sensitivity and lower specificity in studies of young mean/median maternal age (<28 years) (Fig. 10). There was strong evidence that the performance of HBeAg to identify pregnant women with HBV DNA ≥5 log IU/mL varied according to the WHO region (P=0.001), some evidence for HBeAg assay type (P=0.02), weak evidence for maternal HIV status (P=0.09) and no evidence for HBV DNA type of assay.

Table 6Performance of HBeAg to identify pregnant women with HBV viral load ≥5 log10 IU/mL, stratified by potential sources of heterogeneity

Subgroup variablesSubgroup categoryStudies (N)Se (95% CI) or Range SeSp (95% CI) or Range SpP-value
Overall3884.2 (80.2-87.4)92.3 (89.5-94.5)N/A
WHO regionWPR2683.9 (79.2-87.7)89.3 (85.6-92.1)0.001*
SEAR0N/AN/A
EUR679.9 (65.4-89.3)98.2 (95.7-99.3)
EMR1100.079.4
AFR488.0 (70.9-95.7)96.6 (94.3-98.0)
AMR186.494.8
HBeAg assay typeEIA1979.4 (74.0-84.0)90.4 (86.3-93.3)0.02**
FIA391.4 (78.5-96.9)96.6 (81.2-99.5)
CLIA1289.1 (83.2-93.0)92.8 (88.1-95.8)
RDT176.596.8
Multiple183.795.3
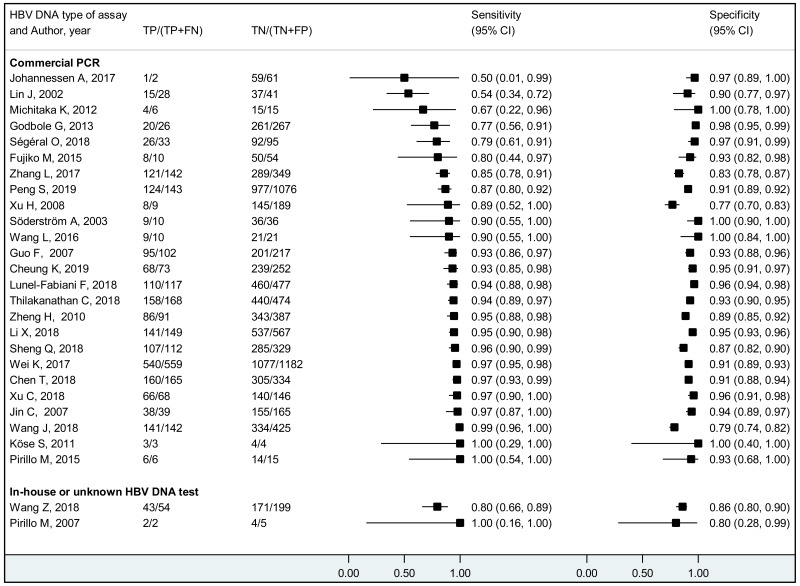
HBV DNA assay typeCommercial PCR3483.7 (79.5-87.1)91.9 (89.0-94.0)0.58
In-house or unknown test487.8 (76.4-94.2)95.0 (80.4-98.9)
Mean / median maternal age<28 years1289.7 (83.6-93.7)91.8 (86.1-95.3)0.02
≥28 years1082.3 (77.6-86.2)95.3 (92.8-97.0)
HIV statusAll uninfected1289.4 (82.7-93.7)89.0 (81.7-93.6)0.09***
All infected382.6 (55.8-94.7)98.2 (74.7-99.9)
Mixed population383.6 (71.8-91.0)94.5 (89.9-97.1)
*

comparison of WPR/EUR/AFR

**

comparison CLIA/EIA/FIA

***

comparison all HIV uninfected vs all HIV infected

Fig. 6. Coupled forest plot of the performance of HBeAg to identify maternal HBV DNA ≥5 log10 IU/mL by WHO region.

Fig. 6Coupled forest plot of the performance of HBeAg to identify maternal HBV DNA ≥5 log10 IU/mL by WHO region

Fig. 7. Coupled forest plot of the performance of HBeAg to identify maternal HBV DNA ≥5 log10 IU/mL by type of HBeAg assay.

Fig. 7Coupled forest plot of the performance of HBeAg to identify maternal HBV DNA ≥5 log10 IU/mL by type of HBeAg assay

Fig. 8. Coupled forest plot of the performance of HBeAg to identify maternal HBV DNA ≥5 log10 IU/mL by HBeAg assay commercial name.

Fig. 8Coupled forest plot of the performance of HBeAg to identify maternal HBV DNA ≥5 log10 IU/mL by HBeAg assay commercial name

Fig. 9. Coupled forest plot of the performance of HBeAg to identify maternal HBV DNA ≥5 log10 IU/mL by type of HBV DNA assay.

Fig. 9Coupled forest plot of the performance of HBeAg to identify maternal HBV DNA ≥5 log10 IU/mL by type of HBV DNA assay

Fig. 10. Coupled forest plot of the performance of HBeAg to identify maternal HBV DNA ≥5 log10 IU/mL by mean or median maternal age.

Fig. 10Coupled forest plot of the performance of HBeAg to identify maternal HBV DNA ≥5 log10 IU/mL by mean or median maternal age

Fig. 11. Coupled forestplot of the performance of HBeAg to identify maternal HBV DNA ≥5 log10 IU/mL by maternal HIV status.

Fig. 11Coupled forestplot of the performance of HBeAg to identify maternal HBV DNA ≥5 log10 IU/mL by maternal HIV status

Sensitivity analysis for the performance of HBeAg to identify pregnant women with HBV DNA ≥5 log10 IU/mL (Table 7)

Sensitivity and specificity were slightly lower in univariate analysis compared to the bivariate analysis. However, there was no evidence of a statistically significant difference between the bivariate and univariate analysis estimates as 95% CI overlapped. Results were unchanged when the outlier study (Lin J, 2002) was excluded from the bivariate analysis or when studies with an overall “high” risk of bias as per QUADAS-2 assessment were excluded.

Table 7Results of the sensitivity analysis for the performance of HBeAg to identify pregnant women with HBV DNA ≥5 log10 IU/mL

Sensitivity analysisStudies, NSe (95% CI) or Range SeSp (95% CI) or Range Sp
Overall bivariate3884.2 (80.2-87.4)92.3 (89.5-94.5)
Overall univariate4282.5 (79.0-85.5)91.4 (88.9-93.5)
Bivariate without outlier study3784.8 (81.4-87.7)92.4 (89.4-94.5)
Bivariate without studies with an overall “high” risk of bias2885.0 (79.9-89.0)93.0 (89.5-95.4)
4.2.3.3. Performance of HBeAg to identify pregnant women with HBV DNA ≥6 log10 IU/mL
  • Overall pooled sensitivity = 92.0% (95% CI: 88.2-94.6)
  • Overall pooled specificity = 92.7% (95% CI: 90.3-94.5)

There was no evidence of publication bias (p=0.15) (Appendix G.2). We did not identify any outlier study through visual assessment of the overall coupled forest plot (Fig. 12) and the summary scatter plot (Fig. 13).

Fig. 12. Coupled forestplot for all studies included in the meta-analysis of the performance of HBeAg to identify maternal HBV DNA ≥6 log10 IU/mL.

Fig. 12Coupled forestplot for all studies included in the meta-analysis of the performance of HBeAg to identify maternal HBV DNA ≥6 log10 IU/mL

Fig. 13. Summary scatter plot of the performance of HBeAg to identify maternal HBV DNA ≥6 log10 IU/mL.

Fig. 13Summary scatter plot of the performance of HBeAg to identify maternal HBV DNA ≥6 log10 IU/mL

Subgroup analysis

Table 8 and Fig. 14 to 19 present detailed results of the performance of HBeAg to identify pregnant women with HBV DNA ≥6 log10 IU/mL stratified by the potential sources of heterogeneity.

There was strong evidence that the performance differed according to mean/median maternal age; higher sensitivity and lower specificity were observed in younger age group (P=0.001) (Fig. 18). There was some evidence that performance of HBeAg varied according to the WHO region (P=0.04), weak evidence for HBeAg assay type (P=0.08), and no evidence for HIV status.

Table 8Performance of HBeAg to identify pregnant women with HBV viral load ≥6 log10 IU/mL, stratified by potential sources of heterogeneity

Subgroup variablesSubgroup categoryStudies (N)Se (95% CI) or Range SeSp (95% CI) or Range SpP-value
Overall2792.0 (88.2-94.6)92.7 (90.3-94.5)N/A
WHO regionWPR1992.6 (88.4-95.3)91.1 (88.4-93.2)0.04*
SEAR180.092.6
EUR382.1 (66.9-91.2)98.0 (95.7-99.1)
EMR0N/AN/A
AFR493.7 (87.9-96.8)96.2 (94.3-97.5)
AMR0N/AN/A
HBeAgassay typeEIA1288.2 (80.9-93.0)91.5 (87.0-94.6)0.08**
FIA190.0100.0
CLIA994.0 (89.9-96.5)93.9 (90.9-95.9)
RDT178.896.8
Multiple197.195.9
RIA/CIA0N/AN/A
Type of HBV DNA assayCommercial PCR2592.3 (88.4-94.9)93.1 (90.7-94.9)N/A
In-house or unknown test279.6-100.080.0-85.9
Mean / median maternal age<28 years896.6 (94.8-97.8)91.7 (87.0-94.8)0.001
≥28 years1186.9 (80.2-91.6)94.1 (90.9-96.3)
HIV statusAll uninfected794.2 (90.3-96.6)92.2 (89.9-94.0)0.77***
All infected395.2 (56.3-99.7)95.2 (80.1-99.0)
Mixed population194.096.4
*

comparison of WPR/EUR/AFR

**

comparison CLIA/EIA

***

comparison all uninfected vs all infected

Fig. 14. Coupled forest plot of the performance of HBeAg to identify maternal HBV DNA ≥6 log10 IU/mL by WHO region.

Fig. 14Coupled forest plot of the performance of HBeAg to identify maternal HBV DNA ≥6 log10 IU/mL by WHO region

Fig. 15. Coupled forest plot of the performance of HBeAg to identify maternal HBV DNA ≥6 log10 IU/mL by type of HBeAg assay.

Fig. 15Coupled forest plot of the performance of HBeAg to identify maternal HBV DNA ≥6 log10 IU/mL by type of HBeAg assay

Fig. 16. Coupled forestplot of the performance of HBeAg to identify maternal HBV DNA ≥6 log10 IU/mL by HBeAg assay commercial name.

Fig. 16Coupled forestplot of the performance of HBeAg to identify maternal HBV DNA ≥6 log10 IU/mL by HBeAg assay commercial name

Fig. 17. Coupled forestplot of the performance of HBeAg to identify maternal HBV DNA ≥6 log10 IU/mL by type of HBV DNA assay.

Fig. 17Coupled forestplot of the performance of HBeAg to identify maternal HBV DNA ≥6 log10 IU/mL by type of HBV DNA assay

Fig. 18. Coupled forestplot of the performance of HBeAg to identify maternal HBV DNA ≥6 log10 IU/mL by maternal age.

Fig. 18Coupled forestplot of the performance of HBeAg to identify maternal HBV DNA ≥6 log10 IU/mL by maternal age

Fig. 19. Coupled forestplot of the performance of HBeAg to identify maternal HBV DNA ≥6 log10 IU/mL by maternal HIV status.

Fig. 19Coupled forestplot of the performance of HBeAg to identify maternal HBV DNA ≥6 log10 IU/mL by maternal HIV status

Sensitivity analysis for the performance of HBeAg to identify pregnant women with HBV DNA ≥6 log10 IU/mL (Table 9)

As there was no outlier study identified for this HBV DNA threshold, we did not perform sensitivity analysis on this factor.

When excluding from the analysis studies with an overall “high” risk of bias as per QUADAS-2 assessment or performing univariate analysis, there was no evidence of a difference in pooled sensitivity and specificity compared with those of the main bivariate analysis (95% CI overlapped).

Table 9Results of the sensitivity analysis for the performance of HBeAg to identify pregnant women with HBV DNA ≥6 log10 IU/mL

Sensitivity analysisStudies, NSe (95% CI) or Range SeSp (95% CI) or Range Sp
Overall bivariate2792.0 (88.2-94.6)92.7 (90.3-94.5)
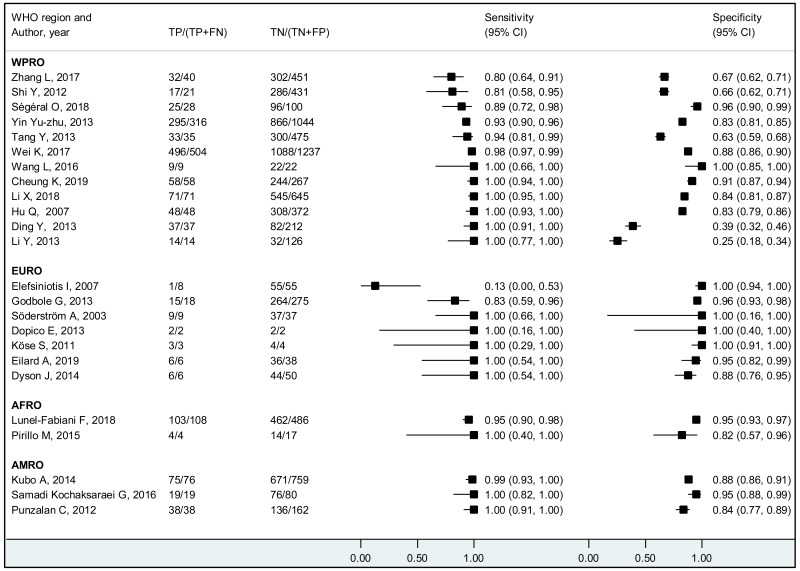
Overall univariate3489.2 (83.9-92.8)91.7 (89.5-93.5)
Bivariate without studies with an overall “high” risk of bias2190.5 (85.8-93.7)93.6 (91.0-95.5)
4.2.3.4. Performance of HBeAg to identify pregnant women with HBV DNA ≥7 log10 IU/mL
  • Overall pooled sensitivity = 98.0% (95% CI: 93.3-99.4)
  • Overall pooled specificity = 88.5% (95% CI: 80.7-93.4)

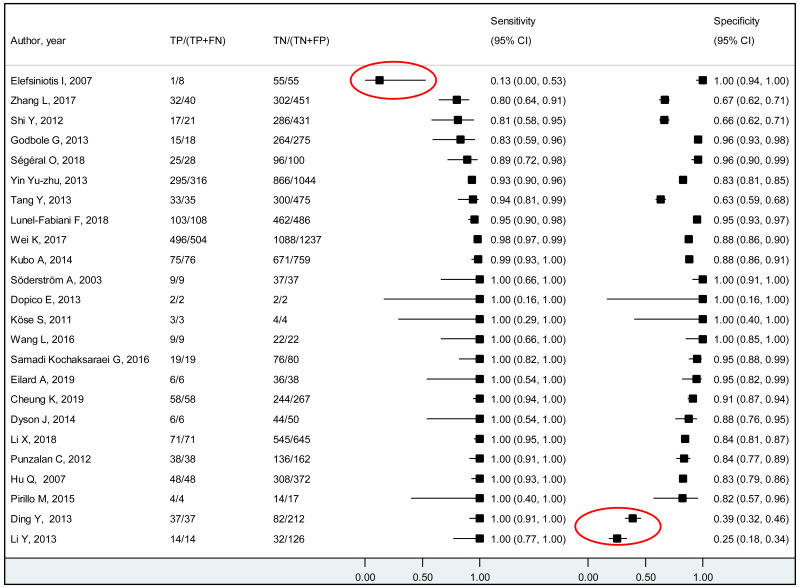
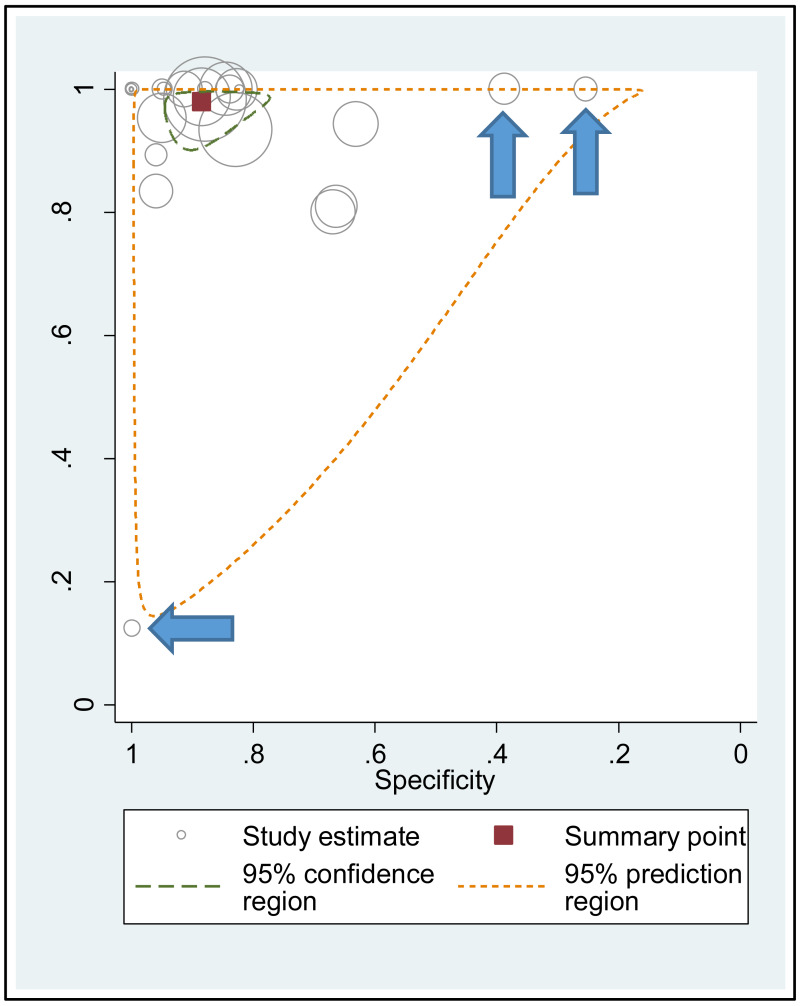
There was no evidence of publication bias (P=0.25) (Appendix G.3). We identified three outliers (Elefsiniotis I, 2007; Ding Y, 2013 and Li Y, 2013) through visual assessment of the overall coupled forest plot (Fig. 20) and the summary scatter plot (Fig. 21).

The first outlier (Elefsiniotis I, 2007) was a cross-sectional study in Greece that reported a very low sensitivity (12.5%) and high specificity (100.0%). Recruitment was from 2003 to 2005. HBV DNA was measured using a commercial PCR (COBAS Amplicor HBV Monitor test (Roche Diagnostics)). HBeAg was tested using an ELISA (AxSYM Abbott). Maternal age and HIV status were unknown, and all women were HCV negative.

The second outlier (Ding Y, 2013) was a prospective cohort in China that reported a low specificity (38.7%) and high sensitivity (100.0%). Recruitment was from 2010 to 2011. HBV DNA was measured using a commercial PCR (COBAS Taqman (Roche Diagnostics). HBeAg was tested using a CLIA (Architect Abbott). Maternal age was unknown, but 2/249 women were younger than 20 years and 247/249 women were older than 20 years. Maternal HIV status was unknown.

The third outlier (Li Y, 2013) was a prospective cohort in China that reported a low specificity (25.4%) and high sensitivity (100.0%). Recruitment was in 2006. HBV DNA was measured using a commercial PCR (Real-Time Fluorescence quantitative PCR (Toyobo)). HBeAg was tested using an ELISA (manufacturer not stated). Maternal age was unknown, and all recruited women were HIV negative.

Fig. 20. Coupled forestplot for all studies included in the meta-analysis of the performance of HBeAg to identify maternal HBV DNA ≥7 log10 IU/mL.

Fig. 20Coupled forestplot for all studies included in the meta-analysis of the performance of HBeAg to identify maternal HBV DNA ≥7 log10 IU/mL

Fig. 21. Summary scatter plot of the performance of HBeAg to identify maternal HBV DNA ≥7 log10 IU/mL.

Fig. 21Summary scatter plot of the performance of HBeAg to identify maternal HBV DNA ≥7 log10 IU/mL

Subgroup analysis

Of the variables predefined as potential sources of heterogeneity, it was not possible to do a subgroup analysis by HCV- or HDV-coinfection status, nor by maternal HBV genotype as too few studies reported information on these factors. Additionally, as all studies had an important risk of bias, we did not perform a subgroup analysis on risk of bias.

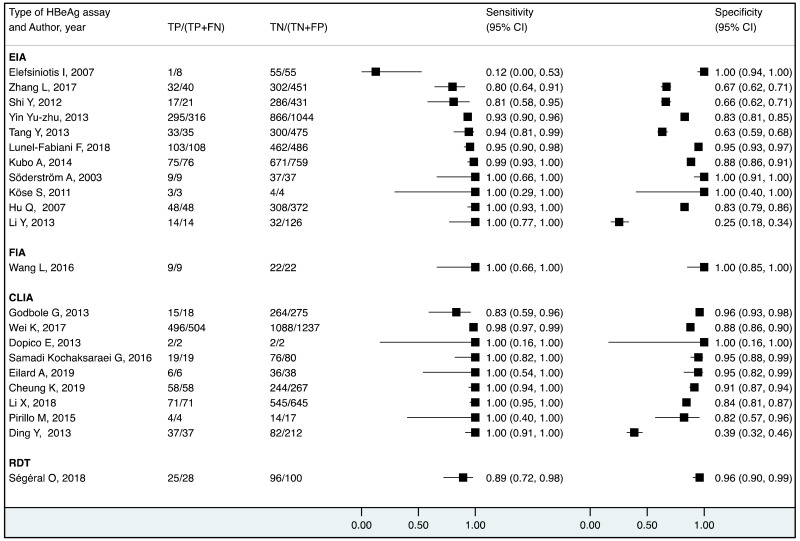
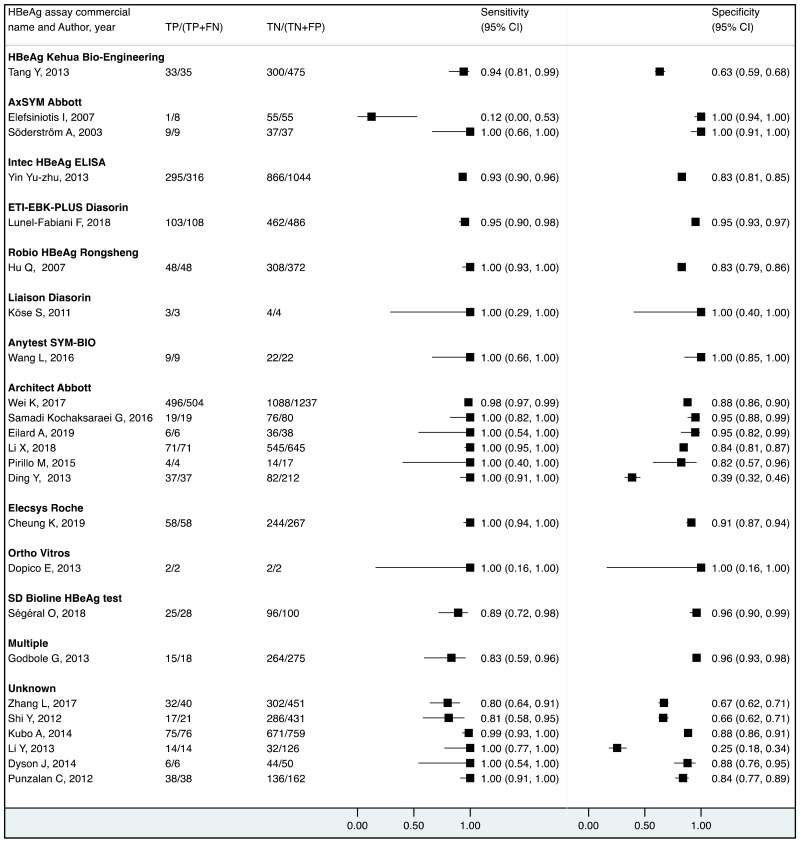
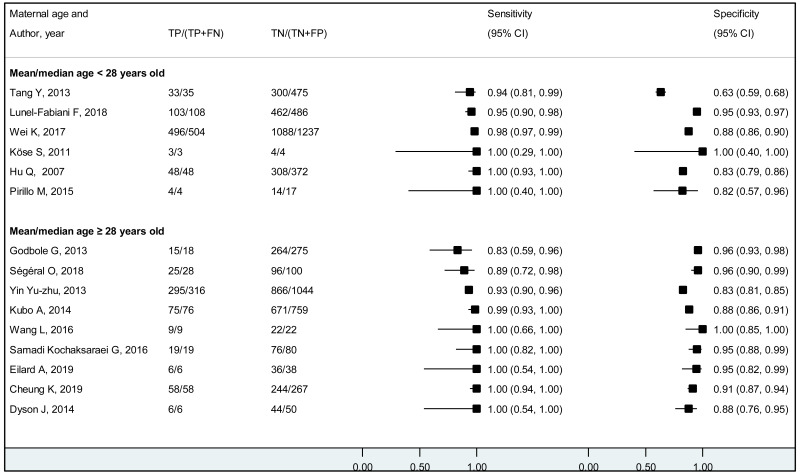
Table 10 and Fig. 22 to 27 present detailed results of the performance of HBeAg to identify pregnant women with HBV DNA ≥7 log10 IU/mL stratified by the potential sources of heterogeneity identified.

There was some evidence that performance of HBeAg to identify pregnant women with HBV DNA ≥7 log IU/mL varied according to the WHO region (P=0.01), and weak evidence that it varied with HBeAg assay type (P=0.07). There was no evidence that its performance differed according to maternal age.

Table 10Performance of HBeAg to identify pregnant women with HBV viral load ≥7 log10 IU/mL, stratified by potential sources of heterogeneity

Subgroup variablesSubgroup categoryStudies (N)Se (95% CI) or Range SeSp (95% CI) or Range SpP value
Overall2498.0 (93.3-99.4)88.5 (80.7-93.4)N/A
WHO regionWPR1297.6 (92.2-99.3)78.9 (64.2-88.6)0.01*
SEAR0--
EUR796.7 (36.7-99.9)95.6 (91.2-97.8)
EMR0--
AFR295.0-100.082.0-95.0
AMR399.2 (94.9-99.9)88.2 (86.1-90.1)
HBeAg assay typeEIA1194.4 (81.3-98.5)86.9 (67.9-95.4)0.07**
FIA1100.0100.0
CLIA998.8 (94.8-99.7)87.9 (77.2-94.0)
RDT189.396.0
Multiple0--
Type of HBV DNA assayCommercial PCR2297.5 (92.2-99.2)89.0 (80.3-94.1)N/A
In-house or unknown test2100.083.4-88.0
Mean / median maternal age<28 years698.0 (96.3-98.9)85.9 (74.7-92.7)0.16
≥28 years996.8 (89.5-99.1)92.5 (88.5-95.2)
HIV statusAll uninfected798.9 (97.0-99.6)85.3 (66.4-94.4)N/A
All infected2100.082.4-100.0
Mixed population295.4-100.088.0-95.1
*

comparison of WPR/EUR/AMR

**

comparison of CLIA/EIA

Fig. 22. Coupled forest plot of the performance of HBeAg to identify maternal HBV DNA ≥7 log10 IU/mL by WHO region.

Fig. 22Coupled forest plot of the performance of HBeAg to identify maternal HBV DNA ≥7 log10 IU/mL by WHO region

Fig. 23. Coupled forest plot of the performance of HBeAg to identify maternal HBV DNA ≥7 log10 IU/mL by HBeAg assay type.

Fig. 23Coupled forest plot of the performance of HBeAg to identify maternal HBV DNA ≥7 log10 IU/mL by HBeAg assay type

Fig. 24. Coupled forest plot of the performance of HBeAg to identify maternal HBV DNA ≥7 log10 IU/mL by HBeAg assay commercial name.

Fig. 24Coupled forest plot of the performance of HBeAg to identify maternal HBV DNA ≥7 log10 IU/mL by HBeAg assay commercial name

Fig. 25. Coupled forest plot of the performance of HBeAg to identify maternal HBV DNA ≥7 log10 IU/mL by HBV DNA assay type.

Fig. 25Coupled forest plot of the performance of HBeAg to identify maternal HBV DNA ≥7 log10 IU/mL by HBV DNA assay type

Fig. 26. Coupled forest plot of the performance of HBeAg to identify maternal HBV DNA ≥7 log10 IU/mL by mean or median maternal age.

Fig. 26Coupled forest plot of the performance of HBeAg to identify maternal HBV DNA ≥7 log10 IU/mL by mean or median maternal age

Fig. 27. Coupled forest plot of the performance of HBeAg to identify maternal HBV DNA ≥7 log10 IU/mL by maternal HIV status.

Fig. 27Coupled forest plot of the performance of HBeAg to identify maternal HBV DNA ≥7 log10 IU/mL by maternal HIV status

Sensitivity analysis for the performance of HBeAg to identify pregnant women with HBV DNA ≥7 log10 IU/mL (Table 11)

As all the included studies provided sufficient data to conduct bivariate analysis, univariate analysis was not conducted.

When excluding the three outlier studies from the analysis or those with an overall “high” risk of bias as per QUADAS-2 assessment, there was no evidence of a difference in pooled sensitivity and specificity compared with those of the main bivariate analysis (95% CI overlapped).

Table 11Results of sensitivity analysis for the performance of HBeAg to identify pregnant women with HBV DNA ≥7 log10 IU/mL

Sensitivity analysisStudies, NSe (95% CI) or Range SeSp (95% CI) or Range Sp
Overall bivariate2498.0 (93.3-99.4)88.5 (80.7-93.4)
Bivariate without outlier studies2197.6 (94.1-99.0)89.3 (84.3-92.9)
Bivariate without studies with an overall “high” risk of bias2098.6 (92.3-99.8)90.2 (81.3-95.1)

4.2.4. GRADE evidence profile for PICO2A

Table 12GRADE evidence profile table of the performance of HBeAg to identify pregnant women with an HBV viral load ≥5 log IU/mL, and ≥6 log IU/mL, ≥7 log IU/mL

Test performanceReference standardStudies, nRisk of biasInconsistencyIndirectnessImprecisionPatients, nStrength of evidencea
HBeAgHBV DNA 5 log10 IU/mL

Sens: 41

Spec: 39

No seriousNo seriousNo seriousNo serious

Sens: 4414

Spec: 9817

Sens: High

Spec: High

HBeAgHBV DNA 6 log10 IU/mL

Sens: 34

Spec: 27

No seriousNo seriousNo seriousNo serious

Sens: 2814

Spec: 7382

Sens: High

Spec: High

HBeAgHBV DNA 7 log10 IU/mL

Sens: 24

Spec: 24

No seriousNo seriousNo seriousNo serious

Sens: 1478

Spec: 7347

Sens: High

Spec: High

a

Although there was no evidence of publication bias, we did not take this factor into account to grade the strength of evidence because most studies were not designed to assess the diagnostic accuracy and there are no reliable methods to assess publication bias in such a context.

4.3. PICO2B: Performance of HBeAg to predict MTCT

Detailed characteristics of each included study are presented in Table 13 below.

Table 13Characteristics of the 15 studies included for the PICO2B

Author, yearPICO2BCountryOriginal study designHBeAg assayMaternal age (years)Maternal HIV, n (%)Measure of prevention for MTCTChildren tested, nChildren age at testing (months)Marker tested in children
Chen Z, 2017 (40)BivariateChinaProspective cohortELISA (AxSYM Abbott)Mean: 26.960/211 (0.0%)TBD + HBIg1687HBsAg & HBV DNA
Chotun N, 2017 (43)Univariate (specificity)South AfricaProspective cohortCLIA (Architect Abbott)Mean (Range): 27 (21-34)0/6 (0.0%)TBD only47HBsAg
Ding Y, 2013 (45)BivariateChinaProspective cohortCLIA (Architect Abbott)Unknown (Range: 16-45) (n=4536)UnknownTBD + HBIg2497HBsAg & HBV DNA
Foaud HM, 2019 (51)Univariate (Specificity)EgyptProspective cohortELISA (ETI-EBK PLUS Diasorin)Mean: 27.30/41 (0.0%)TBD + HBIg3912HBV DNA
Latthaphasavang V, 2019 (65)BivariateLao PDRProspective cohortELISA (Monolisa HBeAg-Ab PLUS Bio-Rad)Median (IQR): 28 (24-30)1/153 (0.7%)TBD only1206HBsAg
Lee L, 2015 (66)BivariateSingaporeProspective cohortCLIA (Architect Abbott)Mean (SD): 32.4 (4.7)UnknownTBD + HBIg1549HBsAg & HBV DNA
Liu CP, 2015 (71)Univariate (Sensitivity)ChinaRetrospective cohortELISA (HBeAg Santa-Cruz)Mean: 25.70/256 (0.0%)TBD + HBIg2566HBsAg
Liu Y, 2016 (73)BivariateChinaProspective cohortCLIA (Architect Abbott)Mean 27.70/110 (0.0%)TBD + HBIg7812HBsAg & HBV DNA
Lunel-Fabiani F, 2018 (75)BivariateCameroonProspective cohortUnknownMedian (IQR): 24 (20-30)1/592 tested (0.2%)TBD only13324HBsAg
Peng S, 2019 (79)BivariateChinaProspective cohortELISA (Kehua HBeAg)Mean: 29.170/1219 (0.0%)TBD + HBIg937HBsAg
Shao Z, 2011 (88)Univariate (Sensitivity)ChinaProspective cohortELISA (AxSYM Abbott)UnknownUnknownTBD + HBIg1587HBsAg
Thilakanathan C, 2018 (94)Univariate (Sensitivity)AustraliaRetrospective cohortCLIA (Architect Abbott)Median (Range): 30 (15-44)UnknownTBD + HBIg4699HBsAg
Wiseman, E, 2009 (105)BivariateAustraliaProspective cohortCLIA or ELISA (AxSYM Abbott or Architect Abbott)Unknown0/313 (0.0%)TBD + HBIg1389HBsAg
Yin Y, 2013 (108)BivariateChinaRetrospective cohortELISA (Intec HBeAg)Mean (SD): 28.83 (3.92)UnknownTBD + HBIg136012HBsAg & HBV DNA
Zhu B, 2013 (112)Univariate (Specificity)ChinaRetrospective cohortCLIA (Elecsys Roche)Mean (SD): 26 (4.1)0/53 (0.0%)TBD + HBIg5312HBsAg

4.3.1. Summary of included studies

There were 15 original studies, including 9 that allowed for the estimation of both sensitivity and specificity using bivariate analysis, and for the remaining 6, only univariate analysis was possible to estimate sensitivity (n=3) or specificity (n=3). All were observational cohort studies (11 prospective and 4 retrospective) (Table 13).

Recruitment took place from 2002 (Shao Z, 2011 and Wiseman E, 2009) to 2017 (Latthaphasavang V, 2019). Most studies took place in the Western Pacific Region (n=12); including China (n=8), Lao People’s Democratic Republic (n=1), Singapore (n=1) and Australia (n=2). Two studies took place in WHO African Region: Cameroon (n=1) and South Africa (n=1); and one study in the WHO Eastern Mediterranean Region in Egypt (Table 13). No study took place in WHO South-East Asian, European or American regions.

Table 14 describes the characteristics of studies included in PICO2B. Of 15 studies, 12 reported maternal age: 7 (58.3%) with a mean/median maternal age below 28 years; and 5 (41.7%) with ≥28 years. EIA and CLIA were most frequently used to assess HBeAg (8/15=53.3% and 6/15=40.0, respectively). No study reported the use of a rapid diagnostic test. Most studies included women not infected with HIV, HCV or HDV (n=7/9 (77.8%), n=5/6 (83.3%) and n=2/2 (100.0%), respectively). Four studies reported HBV genotypes: one with genotype D only and 3 with mixed genotypes. Among studies included in PICO2B. All studies reported giving timely birth dose of HBV vaccine and 12 studies (80.0%) reported giving HBIG to infants. Lastly, all 15 studies reported that infants had received at least 3 doses of HBV vaccine.

Table 14Characteristics of studies included in the PICO2B

PICO2BOverall (n=15)TBD + HBIG (n=12)TBD only (n=3)
Subgroup variablesSubgroup categoryStudies (N)%Studies (N)%Studies (N)%
WHO region (n=15)WPRO1280.01191.7133.3
SEARO00.000.000.0
EURO00.000.000.0
EMRO16.700.000.0
AFRO213.318.3266.7
AMRO00.000.000.0
HBeAg assay type (n=15)EIA853.3650.0266.7
FIA00.000.000.0
CLIA640.0541.7133.3
RDT00.000.000.0
Multiple16.718.300.0
Maternal age (n=12)<28 years758.3555.6266.7
≥28 years541.7444.4133.3
HBIg at birth (n=15)No320.000.03100.0
Yes1280.012100.000.0
First dose of HBV vaccine (n=15)Timely birth dose15100.012100.03100.0
Delayed00.000.000.0
Three doses of HBV vaccine (n=15)No00.000.000.0
Yes15100.012100.03100.0
HIV status (n=9)All uninfected777.86100.0133.3
All infected00.000.000.0
Mixed population222.200.0266.7
HCV status (n=6)All uninfected583.3583.300.0
All infected00.000.000.0
Mixed population116.7116.700.0
HDV status (n=2)All uninfected2100.02100.000.0
All infected00.000.000.0
Mixed population00.000.000.0
Genotype (n=4)Genotype A00.000.000.0
Genotype B00.000.000.0
Genotype C00.000.000.0
Genotype D10.000.0150.0
Genotype E00.000.000.0
Genotype F00.000.000.0
Genotype I00.000.000.0
Mixed population3100.02100.0150.0

4.3.2. Risk of bias assessment

The risk of bias assessment is presented in Fig. 28 & 29 (and details in Appendix E).

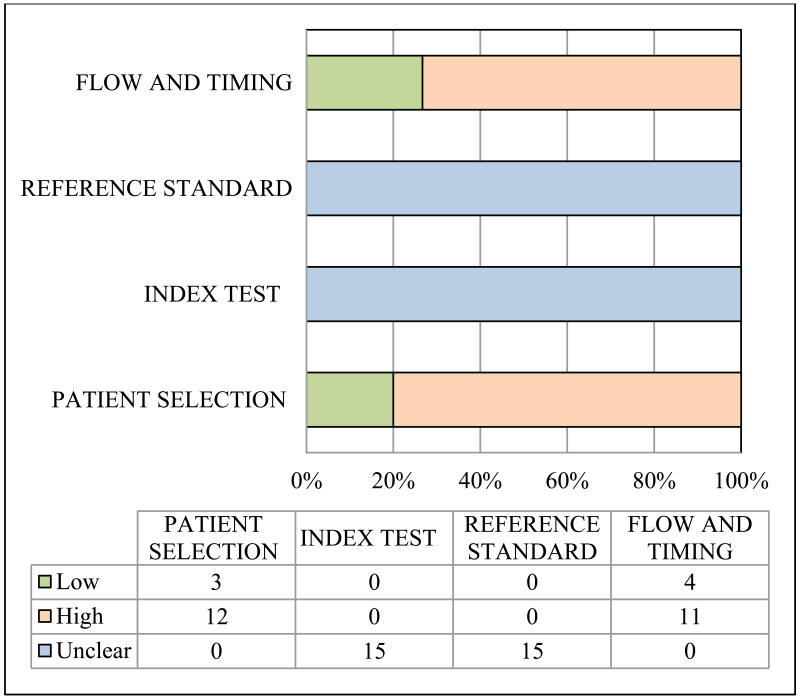
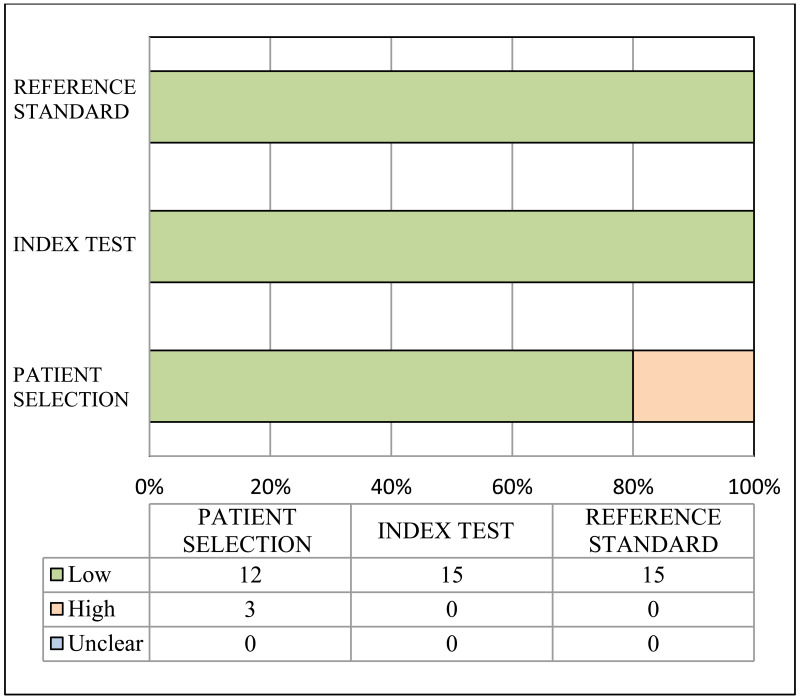
None of the studies had the same objective as that of the PICO2B. Therefore, the essential information for the diagnostic studies were often missing. All studies were rated as unclear risk of bias for the reference standard and for the index tests because whether blinding was performed was not mentioned (Fig. 28). Risk of selection bias was high in most studies (n=12/15, 80.0%), mainly due to restrictive exclusion criteria (e.g. exclusion of HIV-, HCV-, or HDV-coinfected pregnant women).

Concerns about applicability were low for most studies (Fig. 29). There was high concern for patient selection applicability in 3 studies (20.0%), due to the enrolment of pregnant women based on their HBV viral load. There was no concern about the applicability of the index test or about the reference standard.

Fig. 28. Risk of bias results for PICO2B.

Fig. 28Risk of bias results for PICO2B

Fig. 29. Concerns about applicability results for PICO2B.

Fig. 29Concerns about applicability results for PICO2B

4.3.3. Primary analysis, narrative descriptions and forest plots

Overall performance of HBeAg to identify pregnant women at high risk of mother-to-child transmission of HBV, stratified by prevention of MTCT strategy, was as below.

  • Overall pooled sensitivity = 99.1 (95% CI: 61.8-100.0)
  • Overall pooled specificity = 55.7 (95% CI: 34.0-75.5)

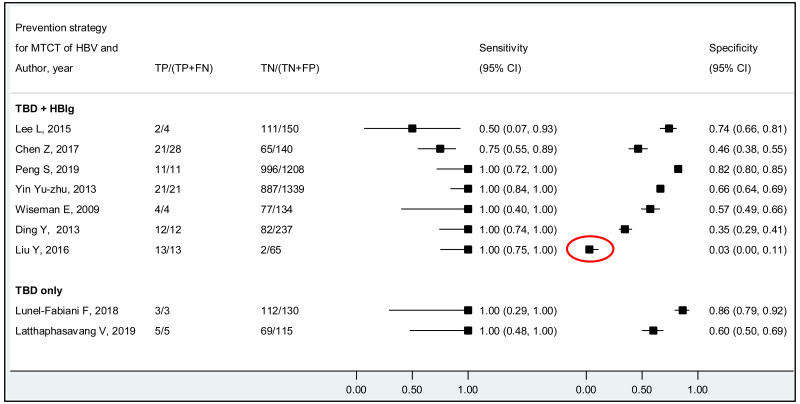
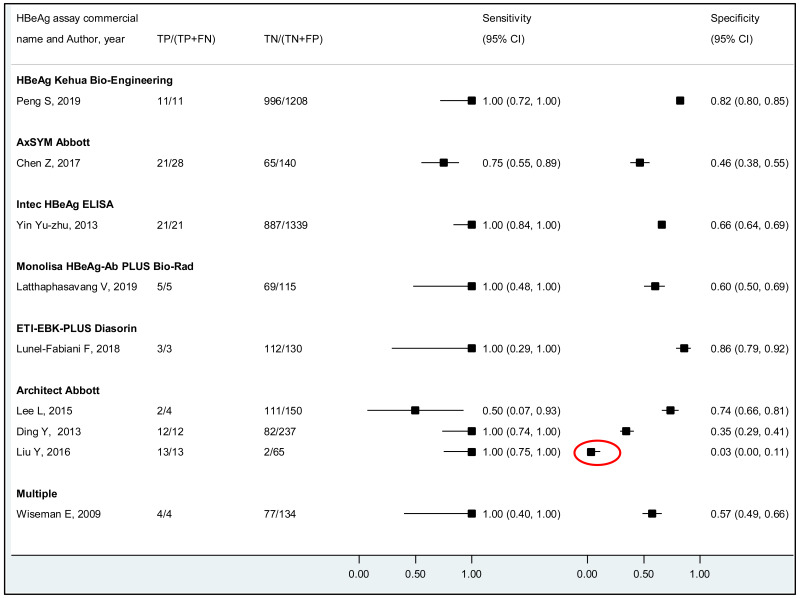
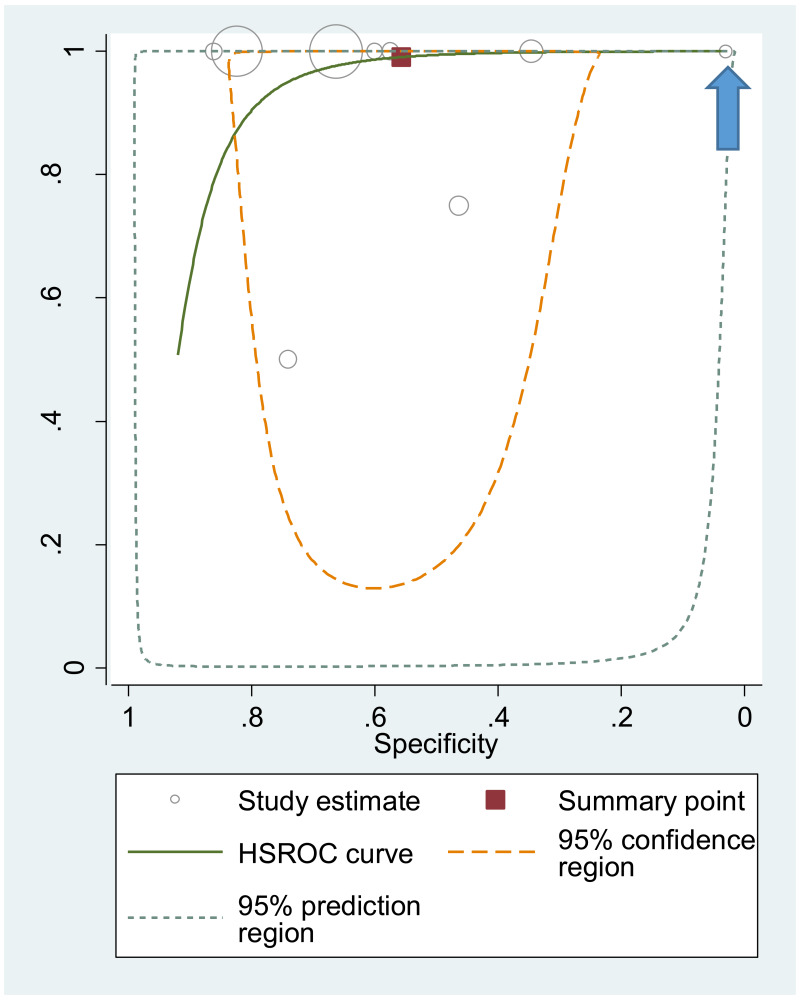
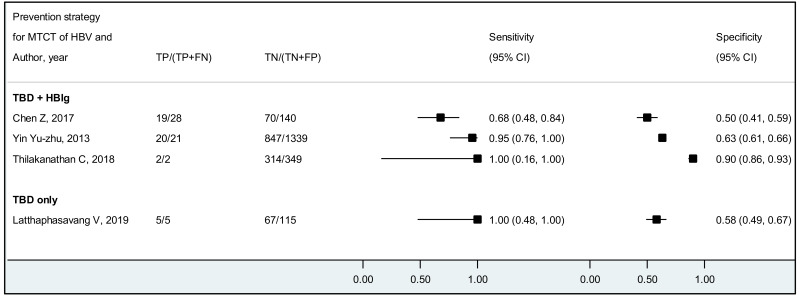
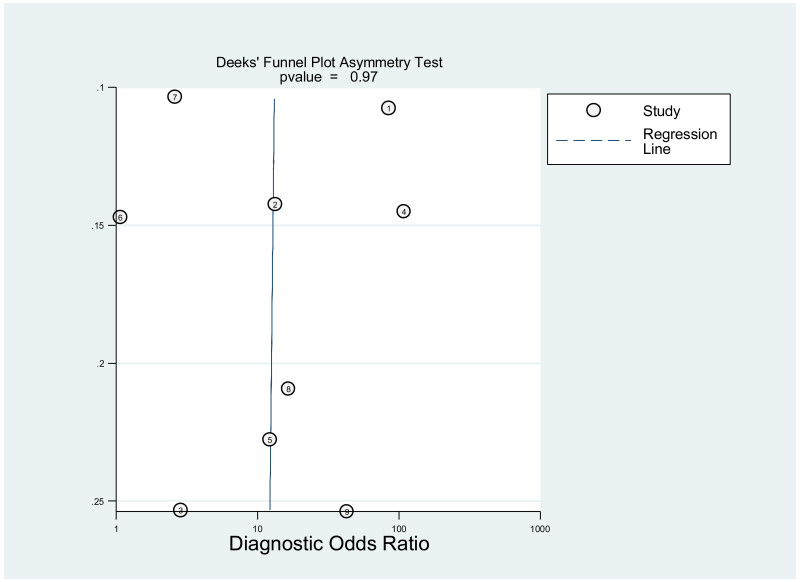
Tables 15 and 16 present detailed performance results for PICO2B. There was no evidence of publication bias (P=0.97) (Appendix G.4). We identified one outlier study (Liu Y, 2016) through visual assessment of the coupled forest plots (Fig. 30 and 31) and the summary scatter plot with SROC curve (Fig. 32).

The outlier study was a prospective cohort in China that reported high sensitivity (100.0%) and very low specificity (3.0%) that recruited high viral load (HBV DNA ≥6 log IU/mL) pregnancy women from 2010 to 2013. HBeAg status in pregnant women was determined using CLIA (Architect Abbott). Mean maternal age was 27.7 years and all enrolled women were HIV negative. In this study, infants received a timely birth dose vaccine, HBIg at birth and 2 subsequent doses of infant vaccine at 1 month and 6 months of age.

Table 15Performance of HBeAg during pregnancy to predict MTCT of HBV, stratified by HBV MTCT prevention strategy

Prevention of MTCT strategyMeta-analysisStudies (N)Subjects (N)TP (N)FN (N)TN (N)FP (N)Se (95% CI) or Range SeSp (95% CI) or Range Sp
OverallBivariate936199292401111799.1 (61.8-100.0)55.7 (34.0-75.5)
Univariate15372010692454115184.8 (74.8-91.3)59.9 (48.0-70.7)
TBD + HBIgBivariate733668492220105398.8 (52.0-100.0)49.2 (25.1-73.7)
Univariate1234659892271108786.5 (74.3-93.4)55.2 (41.4-68.2)
TBD onlyBivariate22538018164100.060.0-86.2
Univariate32558018364100.076.1 (47.8-91.7)

Table 16Post-test probabilities of having MTCT of HBV after positive or negative maternal HBeAg result

HBeAg to identify MTCTStudies, NPretest probability (%)PLR (95% CI) or Range PLRPosttest probability of having MTCT of HBV after positive HBeAg result (%)NLR (95% CI) or Range NLRPost-test probability of having MTCT of HBV after positive HBeAg result (%)
Overall942.2 (1.4-3.7)8.20.02 (0.00-1.0)0.07
TBD + HBIG232.5-7.27.0-17.80.000.00
TBD only942.2 (1.4-3.7)8.20.02 (0.00-1.0)0.07
Fig. 30. Coupled forest plot of the performance of HBeAg during pregnancy to predict MTCT of HBV by prevention strategy for MTCT.

Fig. 30Coupled forest plot of the performance of HBeAg during pregnancy to predict MTCT of HBV by prevention strategy for MTCT

Fig. 31. Coupled forest plot of the performance of HBeAg during pregnancy to predict MTCT of HBV by HBeAg assay.

Fig. 31Coupled forest plot of the performance of HBeAg during pregnancy to predict MTCT of HBV by HBeAg assay

Fig. 32. Summary scatter plot with SROC curve of the performance of HBeAg during pregnancy to predict MTCT.

Fig. 32Summary scatter plot with SROC curve of the performance of HBeAg during pregnancy to predict MTCT

Subgroup analysis

As the number of studies was low, we were not able to perform subgroup analysis of the performance of HBeAg during pregnancy to predict MTCT.

Sensitivity analysis for the performance of HBeAg to predict MTCT (Table 17)

When performing univariate analysis and excluding the outlier study from the analysis or those with an overall “high” risk of bias, results remained unchanged compared with that of the main bivariate analysis (95% CI overlapped).

Table 17Results of sensitivity analysis for the performance of HBeAg during pregnancy to predict MTCT

Studies, NSe (95% CI) or Range SeSp (95% CI) or Range Sp
Overall bivariate999.1 (61.8-100.0)55.7 (34.0-75.5)
Overall univariate1584.8 (74.8-91.3)59.9 (48.0-70.7)
Bivariate without outlier studies898.6 (59.0-100.0)65.1 (52.2-76.2)
Bivariate without studies with an overall “high” risk of bias6100.034.6-86.2

4.3.4. GRADE evidence profile for PICO2B

Table 18GRADE evidence profile table of the performance of HBeAg during pregnancy to predict MTCT, stratified by prevention strategy for MTCT

Test performanceReference standardPrevention strategy for MTCTStudies, nRisk of biasInconsistencyIndirectnessImprecisionPatients, nStrength of evidencea
HBeAgMTCTOverall

Sens: 12

Spec: 12

SeriousNo seriousNo seriousSerious

Sens: 115

Spec: 3605

Sens: Lowb

Spec: Lowb

HBeAgMTCTTBD + HBIg

Sens: 10

Spec: 9

SeriousNo seriousNo seriousSerious

Sens: 107

Spec: 3358

Sens: Lowc

Spec: Lowc

HBeAgMTCTTBD only

Sens: 2

Spec: 3

SeriousSeriousNo seriousSerious

Sens: 8

Spec: 247

Sens: Insufficient datad

Spec: Very lowd

a

Although there was no evidence of publication bias, we did not take this factor into account to grade the strength of evidence because none of the included studies was designed to assess the diagnostic accuracy and there are no reliable methods to assess publication bias in such a context.

b

Downgraded from high to low strength of evidence because 7/12 studies that evaluated sensitivity and 8/12 studies that allowed estimation of specificity had an overall high risk of bias, and there was serious imprecision because 95% confidence range for pooled specificity was 22.7%.

c

Downgraded from high to low strength of evidence because 6/10 studies that allowed estimation of sensitivity and 6/9 studies that evaluated specificity had an overall high risk of bias, and there was serious imprecision in pooled specificity estimate (95% CI range was 26.8%);

d

We did not rate evidence for sensitivity because there were only two studies available and results could not be pooled. Concerning specificity, we downgraded from high to very low the strength of evidence because 2/3 studies that allowed estimation of specificity had an overall high risk of bias, there was serious inconsistency as 1/3 study was not within 20% of the pooled estimate, and there was serious imprecision in pooled specificity estimate (95% CI range was 40.0%);

4.4. PICO2C: Performance of HBV DNA to predict MTCT

Detailed characteristics of each included study are presented in Table 19 below.

Table 19Characteristics of 13 studies included in the PICO2C

Author, yearPICO2CCountryOriginal study designHBV DNA threshold(s) (IU/mL)HBV DNA assayMaternal age (years)Maternal HIV, n (%)Measure of prevention for MTCTChildren tested, nChildren age at testing (months)Marker tested in children
Chen Z, 2017 (40)BivariateChinaProspective cohort5 log10UnknownMean: 26.960/211 (0.0%)TBD + HBIg1687HBsAg & HBV DNA
Chotun N, 2017 (43)Univariate (Specificity)South AfricaProspective cohort20,000 & 5 log10PCR Amplicor HBV Monitor test (Roche)Mean (Range): 27 (21-34)0/6 (0.0%)TBD only47HBsAg
Ding Y, 2013 (45)BivariateChinaProspective cohort7 log10Real-Time Fluorescence quantitative PCR (Kehua Bio-engineering)Unknown (Range: 16-45) (n=4536)UnknownTBD + HBIg2497HBsAg & HBV DNA
Latthaphasavang V, 2019 (65)BivariateLao PDRProspective cohort5 log10PCR Amplicor HBV Monitor test (Roche)Median (IQR): 28 (24-30)1/153 (0.7%)TBD only1206HBsAg
Lee L, 2015 (66)BivariateSingaporeProspective cohort20,000PCR COBAS Taqman (Roche)Mean (SD): 32.4 (4.7)UnknownTBD + HBIg1549HBsAg & HBV DNA
Liu CP, 2015 (71)Univariate (Sensitivity)ChinaRetrospective cohort6, 7 & 8 log10PCR COBAS Taqman (Roche)Mean: 25.70/256 (0.0%)TBD + HBIg2566HBsAg
Lunel-Fabiani F, 2018 (75)BivariateCamerounProspective cohort8 log10PCR Da’an GeneMedian (IQR): 24 (20-30)1/592 tested (0.2%)TBD only13324HBsAg
Peng S, 2019 (79)BivariateChinaProspective cohort6 log10Real-Time Fluorescence quantitative PCR (Kehua Bio-engineering)Mean: 29.170/1219 (0.0%)TBD + HBIg937HBsAg
Shao Z, 2011 (88)Univariate (Sensitivity)ChinaProspective cohort5 & 8 log10Real-time PCR (Fast-track Diagnostics)UnknownUnknownTBD + HBIg1587HBsAg
Thilakanathan C, 2018 (94)BivariateAustraliaRetrospective cohort5 & 6 log10PCR COBAS Taqman (Roche)Median (Range): 30 (15-44)UnknownTBD + HBIg4699HBsAg
Wiseman, E, 2009 (105)BivariateAustraliaProspective cohort8 log10PCR artus HBV PCR Kits, QIAGENUnknown0/313 (0.0%)TBD + HBIg1389HBsAg
Yin Yu-zhu, 2013 (108)BivariateChinaRetrospective cohort5 &7 log10PCR Da’an GeneMean (SD): 28.83 (3.92)UnknownTBD + HBIg136012HBsAg & HBV DNA
Zhu B, 2013 (112)Univariate (Specificity)ChinaRetrospective cohort5 log10PCR COBAS Taqman (Roche)Mean (SD): 26 (4.1)0/53 (0.0%)TBD + HBIg5312HBsAg

4.4.1. Summary of included studies

There were 13 original studies, including 9 for which bivariate analysis was performed, and 4 for which only univariate analysis to estimate sensitivity (n=2) or specificity (n=2) was possible. All were observational cohort studies (9 prospective and 4 retrospective) (Table 19).

Recruitment took place from 2002 (Shao Z, 2011 and Wiseman E, 2009) to 2017 (Latthaphasavang V, 2019). Most studies took place in the Western Pacific Region (n=11); including China (n=7), Lao People’s Democratic Republic (n=1), Singapore (n=1) and Australia (n=2). Two studies took place in the African Region: Cameroon (n=1) and South Africa (n=1). None of the studies took place in AMR, EUR, EMR or SEAR (Table 20).

Among studies included in PICO2C, 10/13 studies (76.9%) reported giving HBIg at birth, and all gave timely birth dose of HBV vaccine to infants. Table 20 describes the characteristics of studies included in the PICO2C.

Table 20Characteristics of studies included in the PICO2C

Overall (n=13)TBD + HBIG (n=10)TBD only (n=3)
Subgroup variablesSubgroup categoryStudies (N)%Studies (N)%Studies (N)%
WHO region (n=13)WPR1184.610100.0133.3
SEAR00.000.000.0
EUR00.000.000.0
EMR00.000.000.0
AFR215.400.0266.7
AMR00.000.000.0
HBeAg assay type (n=13)EIA753.8550.0266.7
FIA00.000.000.0
CLIA538.5440.0133.3
RDT00.000.000.0
Multiple17.7110.000.0
Maternal age (n=10)<28 years550.0342.9266.7
≥28 years550.0457.1133.3
HBIg at birth (n=13)No323.100.03100.0
Yes1076.910100.000.0
First dose of HBV vaccine (n=15)Timely birth dose13100.010100.03100.0
Delayed00.000.000.0
Three doses of HBV vaccine (n=15)No00.000.000.0
Yes13100.010100.03100.0
HIV status (n=11)All uninfected981.87100.0250.0
All infected00.000.000.0
Mixed population218.200.0250.0
HCV status (n=7)All uninfected685.7685.700.0
All infected00.000.000.0
Mixed population114.3114.300.0
HDV status (n=3)All uninfected3100.0342.900.0
All infected00.000.000.0
Mixed population00.000.000.0
Genotype (n=3)Genotype A00.000.000.0
Genotype B00.000.000.0
Genotype C00.000.000.0
Genotype D00.000.000.0
Genotype E00.000.000.0
Mixed population3100.01100.02100.0

4.4.2. Risk of bias assessment

The risk of bias assessment is presented in Fig. 33 & 34 (and details in Appendix F).

Overall, none of the studies included had the same objective as that of the PICO2C, and therefore, essential information was often missing. All studies were rated as having an unclear risk of bias for the reference standard and for the index tests because they did not mention whether or not blinding was performed (Fig. 33). Risk of selection bias was high in most studies (n=10/13, 76.9%), mainly due to restrictive exclusion criteria (e.g. exclusion of HIV-, HCV-, or HDV-coinfected pregnant women).

Concerns about applicability were low for most studies (Fig. 34). There was high concern for patient selection applicability for two studies (15.4%), due to the enrolment of pregnant women based on their HBV viral load. There was no concern about applicability of index test or HBV DNA assay test used.

Fig. 33. Risk of bias results for PICO2C.

Fig. 33Risk of bias results for PICO2C

Fig. 34. Concerns about applicability results for PICO2C.

Fig. 34Concerns about applicability results for PICO2C

4.4.3. Primary analysis, narrative descriptions and forest plots

4.4.3.1. Overall performance of HBV DNA during pregnancy to predict MTCT

Tables 21 and 22 present detailed performance results for the PICO2C. In the following sections, we present detailed results of the performance of HBV DNA ≥5 and 7 log IU/mL to predict MTCT.

Table 21Performance of HBV DNA during pregnancy to predict MTCT, stratified by HBV DNA threshold and prevention of MTCT strategy

HBV DNA threshold (IU/mL)Prevention of MTCT strategyMeta-analysisStudies, NSubjects (N)TP (N)FN (N)TN (N)FP (N)Se (95% CI) or Range SeSp (95% CI) or Range Sp
≥5 logOverallBivariate419994610129864597.7 (42.9-100.0)68.4 (48.6-83.2)
Univariate720564810132966981.5 (62.4-92.1)66.6 (51.3-79.0)
TBD + HBIgBivariate318794110123159797.9 (30.3-100.0)71.1 (46.0-87.7)
Univariate519344310126062181.1 (57.8-93.1)67.5 (47.8-82.6)
TBD onlyBivariate1120506748100.058.3
Univariate2122506948100.058.3-100.0
≥6 logOverall (All TBD + HBIG)Bivariate215701301404153100.089.1-94.0
Univariate31580230140415393.3 (72.5-98.7)89.1-94.0
≥7 logOverall (All TBD + HBIG)Bivariate21609312125432290.5 -100.077.8-89.5
Univariate31619376125432284.4 (52.0-96.4)77.8-89.5
≥8 logOverallBivariate22717021054100.067.9-91.5
Univariate42839102105457.8 (13.3-92.4)82.1 (49.0-95.6)
TBD + HBIgBivariate1138409143100.067.9
Univariate3150610914345.9 (6.1-91.7)67.9
TBD onlyBivariate11333011911100.091.5
Univariate--------

Table 22Post-test probabilities of MTCT if pregnant women have high or low HBV viral load, according to various HBV DNA thresholds and prevention of MTCT strategies

HBV DNA threshold (IU/mL)HBV DNA to diagnose MTCTStudies, NPre-test probability (%)LR+ (95% CI) or Range LR+Post-test probability of having MTCT after high viral load result for HBV DNA test (%)LR- (95% CI) or Range LR-Post-test probability of MTCT after low viral load result for HBV DNA test (%)
5 log10Overall443.1 (1.6-5.8)11.00.03 (0.00-2.1)0.13
TBD + HBIg343.4 (1.5-7.8)11.90.03 (0.00-3.6)0.12
TBD only142.48.70.000.00
6 log10Overall219.2-16.69.2-16.60.000.00
7 log10Overall (All TBD + HBIg)224.1-9.54.1-9.50.00-0.120.00-0.24
8 log10Overall233.1-11.83.1-11.80.000.00
TBD + HBIg133.13.10.000.00
TBD only1211.811.80.000.00
4.4.3.2. Performance of HBV DNA ≥5 log10 IU/mL during pregnancy to predict MTCT
  • Overall pooled sensitivity = 97.7 (95% CI: 42.9-100.0)
  • Overall pooled specificity = 68.4 (95% CI: 48.6-83.2)

There was no evidence of publication bias (p=0.63) (Appendix G.5). We did not identify any outlier through visual assessment (Fig. 35 and 36) and summary scatter plot with the SROC curve (Fig. 37).

Fig. 35. Coupled forest plot of the performance of HBV DNA ≥5 log10 IU/mL during pregnancy to predict MTCT of HBV by type of prevention of MTCT strategy.

Fig. 35Coupled forest plot of the performance of HBV DNA ≥5 log10 IU/mL during pregnancy to predict MTCT of HBV by type of prevention of MTCT strategy

Fig. 36. Coupled forest plot of the performance of HBV DNA ≥5 log10 IU/mL during pregnancy to predict MTCT of HBV by type of HBV DNA assay.

Fig. 36Coupled forest plot of the performance of HBV DNA ≥5 log10 IU/mL during pregnancy to predict MTCT of HBV by type of HBV DNA assay

Fig. 37. Summary scatter plot and SROC curve of the performance of HBV DNA ≥5 log10 IU/mL during pregnancy to predict MTCT.

Fig. 37Summary scatter plot and SROC curve of the performance of HBV DNA ≥5 log10 IU/mL during pregnancy to predict MTCT

Subgroup analysis

The number of included studies was very low. Therefore, we were not able to perform subgroup analysis of the performance of HBV DNA ≥5 log10 IU/mL to predict MTCT of HBV.

Sensitivity analysis for the performance of HBV DNA ≥5 log10 IU/mL to predict MTCT

As no outlier study was identified, we did not conduct sensitivity analysis on this factor Results of sensitivity analysis are presented in Table 23. Sensitivity was lower in univariate analysis compared with bivariate analysis and the specificity remained unchanged. However, there was no evidence of a statistical difference between the bivariate and univariate analysis because the 95% CIs overlapped. Moreover, results remained unchanged when excluding studies with a high risk of bias.

Table 23Results of sensitivity analysis for the performance of HBV DNA ≥5 log10 IU/mL during pregnancy to predict MTCT of HBV

Studies, NSe (95% CI) or Range SeSp (95% CI) or Range Sp
Overall bivariate497.7 (42.9-100.0)68.4 (48.6-83.2)
Overall univariate781.5 (62.4-92.1)66.6 (51.3-79.0)
Bivariate without studies with overall “high” risk of bias397.3 (34.7-100.0)73.6 (52.2-87.7)
4.4.3.3. Performance of HBV DNA ≥7 log10 IU/mL during pregnancy to predict MTCT
  • Range sensitivity = 90.5–100.0
  • Range specificity = 77.8–89.5

As the number of studies was too low (n=2), we could not assess publication bias or present a summary scatter plot with SROC curve. The coupled forest plots (Fig. 38 and 39) are presented below. Both included studies reported giving timely birth dose of HBV vaccine and HBIG at birth to infants.

Fig. 38. Coupled forest plot of the performance of HBV DNA ≥7 log10 IU/mL during pregnancy to predict MTCT of HBV by type of prevention of MTCT strategy.

Fig. 38Coupled forest plot of the performance of HBV DNA ≥7 log10 IU/mL during pregnancy to predict MTCT of HBV by type of prevention of MTCT strategy

Fig. 39. Coupled forest plot of the performance of HBV DNA ≥7 log10 IU/mL during pregnancy to predict MTCT of HBV by type of HBV DNA assay.

Fig. 39Coupled forest plot of the performance of HBV DNA ≥7 log10 IU/mL during pregnancy to predict MTCT of HBV by type of HBV DNA assay

Subgroup analysis

As per the HBV DNA threshold ≥5 log10 IU/mL, we were not able to perform subgroup analysis of the performance of HBV DNA ≥7 log10 IU/mL during pregnancy to predict MTCT, given the small number of included studies.

Sensitivity analysis for the performance of HBV DNA ≥7 log10 IU/mL during pregnancy to predict MTCT (Table 24)

As no study had an overall “high” risk of bias, we did not perform sensitivity analysis on this factor. When performing univariate analysis, the results remained unchanged.

Table 24Results of sensitivity analysis for the performance of HBV DNA ≥7 log10 IU/mL during pregnancy to predict MTCT

Studies, NSe (95% CI) or Range SeSp (95% CI) or Range Sp
Overall bivariate290.5 –100.077.8–89.5
Overall univariate384.4 (52.0–96.4)77.8–89.5

4.4.4. GRADE evidence profile for PICO2C

Table 25GRADE evidence profile table of the performance of HBV DNA ≥5 log10 IU/mL during pregnancy to predict MTCT, stratified by prevention strategy for MTCT

Test performanceReference standardPrevention strategy for MTCTStudies, nRisk of biasInconsistencyIndirectnessImprecisionPatients, nStrength of evidencea
HBV DNA 5 log 10 IU/mLMTCTOverall

Sens: 5

Spec: 6

No seriousSeriousNo seriousSerious

Sens: 58

Spec: 1998

Sens: Lowb

Spec: Lowb

HBV DNA 5 log 10 IU/mLMTCTTBD + HBIg

Sens: 4

Spec: 4

No seriousSeriousNo seriousSerious

Sens: 53

Spec: 1881

Sens: Lowc

Spec: Lowc

HBV DNA 5 log 10 IU/mLMTCTTBD only

Sens: 1

Spec: 2

Insuff. dataInsuff. dataInsuff. dataInsuff. data

Sens: 5

Spec: 117

Sens: Insufficient datad

Spec: Insufficient datad

a

Publication bias was not considered because none of the included studies was designed to evaluate diagnostic accuracy, and the assessment of publication bias in such a context may not be reliable.

b

Downgraded from high to low strength of evidence because of serious inconsistency (8/11 studies were within 20% of the pooled estimate) and serious imprecision (the range in 95% CI was 29.7% for sensitivity and 27.7% for specificity)

c

Downgraded from high to low strength of evidence because of serious inconsistency (3/4 studies were within 20% of the pooled estimate) and serious imprecision (the range in 95% CI was 35.3% for sensitivity and 34.8% for specificity)

d

There was not enough data to rate the evidence for the timely birth dose only group because the number of studies was too low (n=2)

Table 26GRADE evidence profile table of the performance of HBV DNA ≥7 log10 IU/mL during pregnancy to predict MTCT, stratified by prevention strategy for MTCT

Test performanceReference standardPrevention strategy for MTCT of HBVStudies, nRisk of biasInconsistencyIndirectnessImprecisionPatients, nStrength of evidencea
HBV DNA 7 log 10 IU/mLMTCTOverall (All TBD + HBIg)

Sens: 3

Spec: 2

No seriousNo seriousNo seriousVery serious

Sens: 43

Spec: 1576

Sens: Lowb

Spec: Insufficient dataa

a

We did not rate publication bias because there were too few studies and its assessment may not be reliable

b

Downgraded from high to low strength of evidence because of very serious imprecision in pooled sensitivity (95% CI range was 44.4%)

4.5. Post-hoc analysis

4.5.1. HBV DNA level during pregnancy from which the MTCT risk increases despite infant’s immunoprophylaxis

Thirteen studies were included in this analysis (45,66,89,94,105,108,113119). All these studies provided timely birth dose and HBIG at birth. Fig. 40 and 41 show that the risk of HBV MTCT starts to increase from a maternal HBV DNA level during pregnancy of 5.3 log IU/mL (200 000 IU/mL), despite passive–active immunoprophylaxis. There were three studies that examined the risk of MTCT from pregnant women with a viral load of 5.3–6.2 log IU/mL; the risk of passive–active immunoprophylaxis failure was 0% (0/24) in the study of Cheung K et al., 3.2% (3/95) in Zou H et al., and 9.7% (6/62) in Zhang L et al. The pooled risk was 3.8% (95%CI: 0.3–10.1, Fig. 41). The exact viral loads (log IU/mL) of pregnant women who transmitted the virus to their infants despite passive–active immunoprophylaxis in this viral load range (5.3–6.2 log IU/mL) were: 5.7, 6.1, and 6.2 in the study by Zou H et al.; and 5.8, 5.8, 5.9, 5.9, 6.1, and 6.2 in the study by Zhang L et al. Both studies used PCR assay of Kehua Bio-engineering to quantify HBV DNA levels (115,116).

Fig. 40. Risk of HBV MTCT according to maternal HBV DNA level during pregnancy.

Fig. 40Risk of HBV MTCT according to maternal HBV DNA level during pregnancy

Fig. 41. Forest plot of the risk of HBV MTCT according to maternal HBV DNA level during pregnancy.

Fig. 41Forest plot of the risk of HBV MTCT according to maternal HBV DNA level during pregnancy

4.5.2. Performance of HBeAg to identify pregnant women with HBV DNA ≥5.3 log10 IU/mL

A total of 41 studies were included for this meta-analysis (Fig. 42).

  • Overall pooled sensitivity = 88.2% (95% CI: 83.9-91.5)
  • Overall pooled specificity = 92.6% (95% CI: 90.0-94.5)
Fig. 42. Coupled forest plot for all studies included in the meta-analysis of the performance of HBeAg to identify maternal HBV DNA ≥5.3 log10 IU/mL.

Fig. 42Coupled forest plot for all studies included in the meta-analysis of the performance of HBeAg to identify maternal HBV DNA ≥5.3 log10 IU/mL

Subgroup analysis

Of the variables predefined as potential sources of heterogeneity, it was not possible to do a subgroup analysis by HCV- or HDV-coinfection status, or by maternal HBV genotype as too few studies reported information on these factors.

Table 27 present detailed results of the performance of HBeAg to identify pregnant women with HBV DNA ≥5.3 log10 IU/mL stratified by the potential sources of heterogeneity.

Table 27Performance of HBeAg to identify pregnant women with HBV viral load ≥5.3 log10 IU/mL, stratified by potential sources of heterogeneity

Subgroup variablesSubgroup categoryStudiesSe (95% CI) orSp (95% CI) or Range SpP value
Overall4188.2 (83.9-91.5)92.6 (90.0-94.5)N/A
WHO region (N=41)WPR2790.0 (85.0-93.5)89.1 (85.6-91.8)<0.0001*
AFR782.0 (65.1-91.7)96.0 (94.4-97.1)
EUR578.9 (67.3-87.1)98.0 (96.8-98.8)
AMR186.4 (79.8-91.5)94.8 (92.8-96.3)
SEAR180.0 (44.4-97.5)92.6 (82.1-97.9)
EMR0--
HBeAg assay type (N=36)EIA1884.6 (77.4-89.8)90.5 (86.4-93.4)0.11**
CLIA1391.4 (85.2-95.1)93.9 (90.2-96.3)
FIA391.4 (78.5-96.9)96.6 (81.2-99.5)
RDT270.1 (58.2-79.9)95.7 (93.3-97.3)
Mean / median maternal age (N=28)<28 years1494.2 (88.8-97.1)91.9 (87.8-94.8)0.02
≥28 years1485.3 (79.0-90.0)95.6 (93.6-97.0)
HBV DNA assay (N=41)Commercial PCR3588.1 (83.3-91.8)92.5 (90.0-94.4)0.98
In-house or unknown test688.8 (78.6-94.5)93.5 (79.8-98.1)
HIV status (N=22)All uninfected1193.5 (87.2-96.9)89.2 (82.4-93.6)0.30***
All infected495.1 (50.7-99.7)96.6 (82.8-99.4)
Mixed population782.7 (70.5-90.6)95.6 (94.3-96.6)
*

comparison of WPR/EUR/AMR

**

comparison of CLIA/EIA

***

comparison of uninfected/infected

5. Conclusion

To our knowledge, this systematic review is the first to examine the diagnostic accuracy of the HBeAg test to diagnose high HBV DNA levels in pregnant women. Our results suggest that the risk of HBV MTCT, despite passive–active immunoprophylaxis, starts to increase at a maternal viral load of 5.3 log IU/mL (i.e. 200 000 IU/mL). The pooled sensitivity and specificity of HBeAg, obtained by the bivariate analyses, were: 84.2% (95% CI: 80.2–87.4%) and 92.3% (89.5–94.5%) to diagnose viral load of ≥5 log10 IU/mL; 92.0% (88.2–94.6%) and 92.7% (90.3–94.5%) for ≥6 log10 IU/mL; and 98.0% (93.3–99.4%) and 88.5% (80.7–93.4%) for ≥7 log10 IU/mL, respectively. We evaluated the performance of HBeAg for three other different HBV DNA thresholds (≥20 000, ≥200 000 and ≥8 log10 IU/mL). Irrespective of these different HBV DNA cut-off levels, pooled sensitivity and specificity were constantly higher than 80%, with the lower boundary of the 95% CI exceeding 75%. The univariate analyses provided similar results, supporting the robustness of these estimates. As expected, the sensitivity improved with increasing HBV DNA threshold whereas the specificity decreased.

We found evidence that the performance of HBeAg during pregnancy to identify pregnant women with a high viral load differed according to the WHO region, type of HBeAg and maternal age. However, there was no evidence that its performance varied according to HBV DNA NAT or maternal HIV status.

The performance of HBeAg differed significantly between lower (<28 years) and higher (≥28 years) mean/median maternal age reported in each study; younger maternal age was associated with higher sensitivity and lower specificity to diagnose HBV DNA levels of ≥5 and ≥6 log10 IU/mL, compared to higher maternal age (≥28 years). Although the difference was not significant, a similar tendency was observed for the cut-off of ≥7 log10 IU/mL. Since spontaneous loss of HBeAg occurs over time, the prevalence of HBeAg is higher in younger HBsAg-positive women than in older HBsAg-positive women (120), and this may explain the difference in performance of HBeAg according to maternal age. The natural history of CHB varies according to geographical area, particularly between Asia and sub-Saharan Africa, which both carry a high HBV-related disease burden. Historically in both areas, the majority of CHB occurs during childhood either perinatally from infectious mothers or horizontally from household members. In Asia, a substantial proportion (about 40%) of children who are chronically infected with HBV continue to carry HBeAg and high viral load beyond their adolescence (121) while in Africa, spontaneous HBeAg loss often occurs at younger age and only 10–20% of HBV-infected women of childbearing age carry HBeAg (122). This difference might be due to varying frequency of emerging basal core promoter (BCP) or precore (PC) variants, which abolish or reduce HBeAg production without affecting the capacity of HBV to replicate (123). We found a similar high sensitivity of HBeAg to diagnose high viraemia in both regions: 83.9% (79.2–87.7%) in Asia and 88.0% (70.9–95.7%) in Africa for HBV DNA levels ≥5 log10 IU/mL, respectively; 92.6% (88.4–95.3%) and 93.7% (87.9–96.8%) for HBV DNA levels ≥6 log10 IU/mL, respectively. However, the specificity of HBeAg to diagnose high maternal viral loads tended to be lower in Asia (Western Pacific) compared with Africa: 89.3% (85.6–92.1%) and 96.6% (94.3–98.0%) for HBV DNA levels ≥5 log10 IU/mL; 91.1% (88.4–93.2%) and 96.2% (94.3–97.5%) for HBV DNA levels ≥6 log10 IU/mL, respectively.

More recent types of HBeAg assays such as CLIA tended to have a higher sensitivity for diagnosing viraemia than EIA: 89.1% (95% CI: 83.2–93.0%) and 79.4% (74.0–84.0%) to diagnose viral load ≥5 log10 IU/mL; and 94.4% (81.3–98.5%) and 98.8% (93.7–99.8%) to diagnose viraemia ≥7 log10 IU/ml, respectively. This might be related to improved analytical sensitivity of CLIA, in comparison with EIA, to detect HBeAg. Although there was only one study that evaluated RDT, this had lower clinical sensitivity compared to the laboratory-based immunoassays (76.5% and 89.3% to diagnose high HBV DNA levels of ≥5 log10 and ≥7 log10 IU/mL, respectively). Low clinical sensitivity of commercially available HBeAg RDT was also found to be related to its low analytical sensitivity compared to CLIA (17).

A few outlying studies were identified: one study for ≥5 log10 IU/mL and three studies for ≥7 log 10 IU/mL. Compared to other studies, these outliers tended to have either “lower sensitivity and higher specificity” (50,70), or “lower specificity with higher sensitivity” (45,68). Although we did not perform further assessment, this might be related to multiple factors such as low HBeAg prevalence (1.6%) in HBsAg-positive pregnant women in a Greek study (50) or the difference in analytical sensitivity of the HBeAg tests used in these outlier studies (68,70). The sensitivity analyses excluding these outliers did not alter the interpretation of these results.

The systematic review addressed two additional questions: the performance of HBeAg detection and HBV DNA quantification during pregnancy to predict an MTCT event, defined as HBsAg positivity in infants aged 6–12 months. These analyses were stratified by the type of preventive measures provided to mother–child pairs. We found that the pooled sensitivity and specificity of maternal HBeAg during pregnancy to predict MTCT despite infant immunoprophylaxis were 99.1% (95% CI: 61.8–100%) and 55.7% (34.0–75.5%). The pooled sensitivity and specificity of maternal HBV DNA levels ≥5 log IU/mL was 97.7% (95% CI: 42.9–100.0%) and 68.4% (95% CI: 48.6–83.2%); and the sensitivity and specificity range of maternal HBV DNA levels ≥7 log IU/mL were 90.5% to 100.0% and 77.8% to 89.5%, respectively. Although no formal assessment was performed, these results might indicate that: (i) both HBeAg and high HBV DNA levels, measured during pregnancy, have high sensitivity to predict the risk of immunoprophylaxis failure; and (ii) the specificity is low for HBeAg and moderate for high HBV DNA levels.

The strength of the evidence for the performance of HBeAg to identify pregnant women with viral loads ≥5, ≥6, and ≥7 log 10 IU/mL were high. Although most studies had excluded women coinfected with either HIV, HCV or HDV, this did not constitute a serious risk of bias. There was no evidence of publication bias; however, only one study was designed to evaluate diagnostic accuracy, which might have made the conventional assessment of publication bias, through assessing small sample effects, less meaningful. Moreover, since essential information for diagnostic studies (e.g. blinding) were missing in the majority of studies, the assessment of the quality of studies was difficult for the index test and reference standard sections of the QUADAS2.

For the performance of HBeAg to predict MTCT, the strength of evidence was low due to high risk of bias in most studies and serious imprecision of the pooled estimates, probably due to the small number of included studies. When stratified by prevention of MTCT regimen, evidence was low for the timely birth dose plus HBIG regimen and could not be graded for timely birth dose only regimen (without HBIG) because there was not enough data available.

The strength of evidence for the overall performance of maternal HBV DNA levels ≥5 log 10 IU/mL was low due to inconsistency in the estimates and serious imprecision in the pooled estimates. When stratifying by prevention of MTCT strategy, evidence was low for timely birth dose plus HBIG for the same reasons as stated above, and there was not enough data to grade the evidence for the timely birth dose only strategy. For maternal HBV DNA levels ≥7 log 10 IU/mL, all included studies reported using the timely birth dose plus HBIG strategy and there was not enough data to grade evidence for specificity. Concerning sensitivity, evidence was low because of very serious imprecision in the pooled estimate, which may be due to the low number of studies included to answer this objective.

As a strength of this study, the literature was systematically searched through both English- and Chinese-language databases, and independently reviewed by two investigators for each language (a total of four reviewers). Duplicate publications were carefully checked and excluded from the analysis to avoid biased estimates.

As a limitation, this systematic review was primarily designed to accomplish the primary objective (PICO2A); we thus included only studies that measured both HBeAg and HBV DNA during pregnancy to answer the secondary objectives. Of the studies eligible for the PICO2A, we further selected those that followed infants to ascertain MTCT end-points to answer two additional questions (PICO2B and PICO2C). Consequently, we might have missed a few of the eligible studies for PICO2B (e.g. a study evaluating maternal HBeAg during pregnancy and infant HBsAg at 6 months without doing maternal HBV DNA) or PICO2C (e.g. a study evaluating maternal HBV DNA and infant MTCT end-point, without assessing HBeAg during pregnancy). Because of these limitations, care must be taken when interpreting PICO2B and PICO2C.

5.1. Implications for practice

This study suggests that risk of HBV MTCT, despite passive–active immunoprophylaxis, starts to increase at a maternal viral load of 5.3 log IU/mL. This threshold should be theoretically lower when the PMTCT strategy does not include HBIG (e.g. timely birth dose alone).

With the high strength of the evidence observed, this study suggests that HBeAg might be a good alternative marker to HBV DNA NAT to diagnose high HBV viral load during pregnancy. Moreover, although the strength of the evidence was low, the systematic review found high sensitivity (99.1% (95% CI: 61.8–100%)) of HBeAg during pregnancy to predict immunoprophylaxis failure in infants (MTCT despite administration of birth dose vaccine and HBIG), with a poor specificity of around 55%.

The findings are particularly relevant in countries where there is limited access to HBV DNA NAT. Even though the HBeAg test may perform less well than HBV DNA NAT to identify pregnant women with an elevated risk of MTCT, other parameters (lower costs, improved access to testng and uptake, better linkage to care, and greater feasibility) may favour its use in certain contexts.

5.2. Implications for research

The vast majority of the included studies were from the Western Pacific Region (WPR: 65.9%), followed by the European Region (EUR: 18.3%), African Region (AFR: 7.3%), the Americas (AMR: 6.1%), and only one study each from South-East Asia (SEAR: 1.2%) and Eastern Mediterranean Region (EMR: 1.2%). We need additional research, particularly outside East Asia. There was no study that included only HCV- or HDV-coinfected women. Only a few studies provided the estimates for HIV-coinfected mothers; we did not find any difference in performance of HBeAg to diagnose high viraemia according to HIV status. As there were only a few studies that assessed viral genotype, we could not investigate the performance of HBeAg during pregnancy in different HBV genotypes.

The use of RDT is more attractive than laboratory-based immunoassays, because the former may be less expensive, faster, easier to perform, and thus more feasible than the latter in a peripheral laboratory in resource-limited contexts. We identified only one study evaluating the performance of RDT during pregnancy, and its sensitivity tended to be lower than that of EIA or CLIA. We need additional studies to evaluate the performance of RDT in pregnant women; but we may also need improvement of analytical sensitivity of RDT to detect HBeAg. The development and evaluation of other low-cost molecular assays or serological markers (e.g. hepatitis B core-related antigen (HBcrAg)) is also highly warranted (124).

6. Acknowledgement

We thank all the authors of the included studies who replied to our inquiry, particularly Professor Françoise Lunel-Fabiani, Dr Alice Guingané and Dr Edouard Tuaillon.

We also thank Dr Judith van Holten, Dr Yvan Hutin, Dr Marc Bulterys and Professor Roger Chou for their guidance and their help for the conduct of this work, and Dr Yoann Madec for his technical advice.

7. References

1.
World Health Organization. Global Hepatitis Report 2017 [Internet]. Geneva; 2017. Available from: https://apps​.who.int​/iris/handle/10665/255016
2.
World Health Organization. Combating hepatitis B and C to reach elimination by 2030 [Internet]. World Health Organization. Geneva: World Health Organization; 2016. Available from: https://www​.who.int/hepatitis​/publications​/hep-elimination-by-2030-brief/en/
3.
Edmunds WJ, Medley GF, Nokes DJ, Hall AJ, Whittle HC. The influence of age on the development of the hepatitis B carrier state. Proc R Soc B Biol Sci. 1993 Aug;253(1337):197–201. [PubMed: 8397416]
4.
Shimakawa Y, Yan H-J, Tsuchiya N, Bottomley C, Hall AJ. Association of early age at establishment of chronic hepatitis B infection with persistent viral replication, liver cirrhosis and hepatocellular carcinoma: a systematic review. PLoS One. 2013;8(7):e69430. [PMC free article: PMC3716646] [PubMed: 23894479]
5.
Chang M-H. Natural history and clinical management of chronic hepatitis B virus infection in children. Hepatol Int. 2008 May;2(Supplement 1):28–36. [PMC free article: PMC2716838] [PubMed: 19669296]
6.
Nayagam S, Thursz M, Sicuri E, Conteh L, Wiktor S, Low-Beer D, et al. Requirements for global elimination of hepatitis B: a modelling study. Lancet Infect Dis [Internet]. 2016 Dec [cited 2019 Aug 28];16(12):1399–408. Available from: http://www​.ncbi.nlm.nih​.gov/pubmed/27638356 [PubMed: 27638356]
7.
World Health Organization. Hepatitis B vaccines: WHO position paper. Wkly Epidemiol Rec [Internet]. 2009;84(40):405–20. Available from: http://www​.who.int/we
8.
Machaira M, Papaevangelou V, Vouloumanou EK, Tansarli GS, Falagas ME. Hepatitis B vaccine alone or with hepatitis B immunoglobulin in neonates of HBsAg+/HBeAg− mothers: a systematic review and meta-analysis. J Antimicrob Chemother. 2015 Feb;70(2):396–404. [PubMed: 25362571]
9.
Keane E, Funk AL, Shimakawa Y. Systematic review with meta-analysis: the risk of mother-to-child transmission of hepatitis B virus infection in sub-Saharan Africa. Aliment Pharmacol Ther [Internet]. 2016 Nov;44(10):1005–17. Available from: http:​//onlinelibrary​.wiley.com/journal/10​.1111/(ISSN)1365-2036 [PubMed: 27630001]
10.
Lee C, Gong Y, Brok J, Boxall EH, Gluud C. Hepatitis B immunisation for newborn infants of hepatitis B surface antigen-positive mothers. Cochrane Database Syst Rev [Internet]. 2006 Apr 19 [cited 2019 Aug 28];(2):Art. No.: CD004790. Available from: http://www​.ncbi.nlm.nih​.gov/pubmed/16625613 [PubMed: 16625613]
11.
Chen H, Lin L, Hu F, Lee J, Lin W, Yang Y, et al. Effects of Maternal Screening and Universal Immunization to Prevent Mother-to-Infant Transmission of HBV. Gastroenterology. 2012 Apr;142(4):773–781.e2. [PubMed: 22198276]
12.
Wen W-H, Chang M-H, Zhao L-L, Ni Y-H, Hsu H-Y, Wu J-F, et al. Mother-to-infant transmission of hepatitis B virus infection: significance of maternal viral load and strategies for intervention. J Hepatol. 2013 Jul;59(1):24–30. [PubMed: 23485519]
13.
European Association for the Study of the Liver. EASL 2017 Clinical Practice Guidelines on the management of hepatitis B virus infection. J Hepatol. 2017;67(2):370–398. [PubMed: 28427875]
14.
Terrault N, Lok A, McMahon B, Chang K, Hwang J, Jonas M, et al. Update on prevention, diagnosis, and treatment of chronic hepatitis B: AASLD 2018 hepatitis B guidance. Hepatology. 2018 Apr;67(4):1560–99. [PMC free article: PMC5975958] [PubMed: 29405329]
15.
Visvanathan K, Dusheiko G, Giles M, Wong M-L, Phung N, Walker S, et al. Managing HBV in pregnancy. Prevention, prophylaxis, treatment and follow-up: position paper produced by Australian, UK and New Zealand key opinion leaders. Gut. 2016;65(2):340–50. [PubMed: 26475631]
16.
Lemoine M, Thursz MR. Battlefield against hepatitis B infection and HCC in Africa. Journal of Hepatology. 2017. [PubMed: 27771453]
17.
Seck A, Ndiaye F, Maylin S, Ndiaye B, Simon F, Funk AL, et al. Poor Sensitivity of Commercial Rapid Diagnostic Tests for Hepatitis B e Antigen in Senegal, West Africa. Am J Trop Med Hyg [Internet]. 2018 Aug;99(2):428–34. Available from: http://www​.ajtmh.org​/docserver/fulltext/14761645​/99/2/tpmd180116​.pdf?expires=1533364940&id​=id&accname​=12015&checksum​=F3723E8693D99CAC3AC9DC5E712FD2C1 [PMC free article: PMC6090320] [PubMed: 29869595]
18.
Chinese Society of Hepatology CMA. Consensus on clinical management of hepatitis B virus- infected women of childbearing age. Zhonghua Gan Zang Bing Za Zhi [Internet]. 2018 Mar 20 [cited 2019 Sep 13];26(3):204–8. Available from: http://www​.ncbi.nlm.nih​.gov/pubmed/29804394 [PubMed: 29804394]
19.
Yuen MF, Hou JL, Chen CJ, Locarnini S, Al Mahtab M, Jafri W, et al. Asian-Pacific clinical practice guidelines on the management of hepatitis B: a 2015 update. Vol. 10, Hepatology International. Springer India; 2015. 1–98 p. [PMC free article: PMC4722087] [PubMed: 26563120]
20.
World Health Organization. Guidelines for the Prevention, Care and Treatment of Persons with Chronic Hepatitis B Infection. World Health Organisation. Geneva; 2015. 1–134 p.
21.
Evans AA, O’Connell AP, Pugh JC, Mason WS, Shen FM, Chen GC, et al. Geographic variation in viral load among hepatitis B carriers with differing risks of hepatocellular carcinoma. Cancer Epidemiol Biomarkers Prev. 1998 Jul;7(7):559–65. [PubMed: 9681522]
22.
Bossuyt PM, Reitsma JB, Bruns DE, Gatsonis C a, Glasziou PP, Irwig LM, et al. The STARD Statement for Reporting Studies of Diagnostic Accuracy : Ann Intern Med. 2003;138(1):1–12. [PubMed: 12513067]
23.
Whiting PF, Rutjes AWS, Westwood ME, Mallett S, Deeks JJ, Reitsma JB, et al. QUADAS-2: A Revised Tool for the Quality Assessment of Diagnostic Accuracy Studies. Ann Intern Med [Internet]. 2011 Oct 18 [cited 2019 Aug 28];155(8):529. Available from: http://www​.ncbi.nlm.nih​.gov/pubmed/22007046 [PubMed: 22007046]
24.
Nyaga VN, Arbyn M, Aerts M. Metaprop: A Stata command to perform meta-analysis of binomial data. Arch Public Heal. 2014;72(1):1–10. [PMC free article: PMC4373114] [PubMed: 25810908]
25.
Macaskill P, Gatsonis C, Deeks J, Harbord R, Takwoingi Y. Analysing and Presenting Results. In: Deeks J, Bossuyt P, Gatsonis C, editors. Cochrane Handbook for Systematic Reviews of Diagnostic Test Accuracy Version 10 The Cochrane Collaboration [Internet]. 2010. Available from: http://srdta​.cochrane.org/
26.
Deeks JJ, Macaskill P, Irwig L. The performance of tests of publication bias and other sample size effects in systematic reviews of diagnostic test accuracy was assessed. J Clin Epidemiol. 2005;58(9):882–93. [PubMed: 16085191]
27.
van Enst WA, Ochodo E, Scholten RJPM, Hooft L, Leeflang MM. Investigation of publication bias in meta-analyses of diagnostic test accuracy: a meta-epidemiological study. BMC Med Res Methodol [Internet]. 2014 May 23 [cited 2019 Sep 13];14:70. Available from: http://www​.ncbi.nlm.nih​.gov/pubmed/24884381 [PMC free article: PMC4035673] [PubMed: 24884381]
28.
Atkins D, Best D, Briss PA, Eccles M, Falck-Ytter Y, Flottorp S, et al. Grading quality of evidence and strength of recommendations. BMJ. 2004 Jun;328(7454):1490. [PMC free article: PMC428525] [PubMed: 15205295]
29.
Chou R, Easterbrook P, Hellard M. Methodological challenges in appraising evidence on diagnostic testing for WHO guidelines on hepatitis B and hepatitis C virus infection. BMC Infect Dis. 2017;17(Suppl 1). [PMC free article: PMC5688453] [PubMed: 29143626]
30.
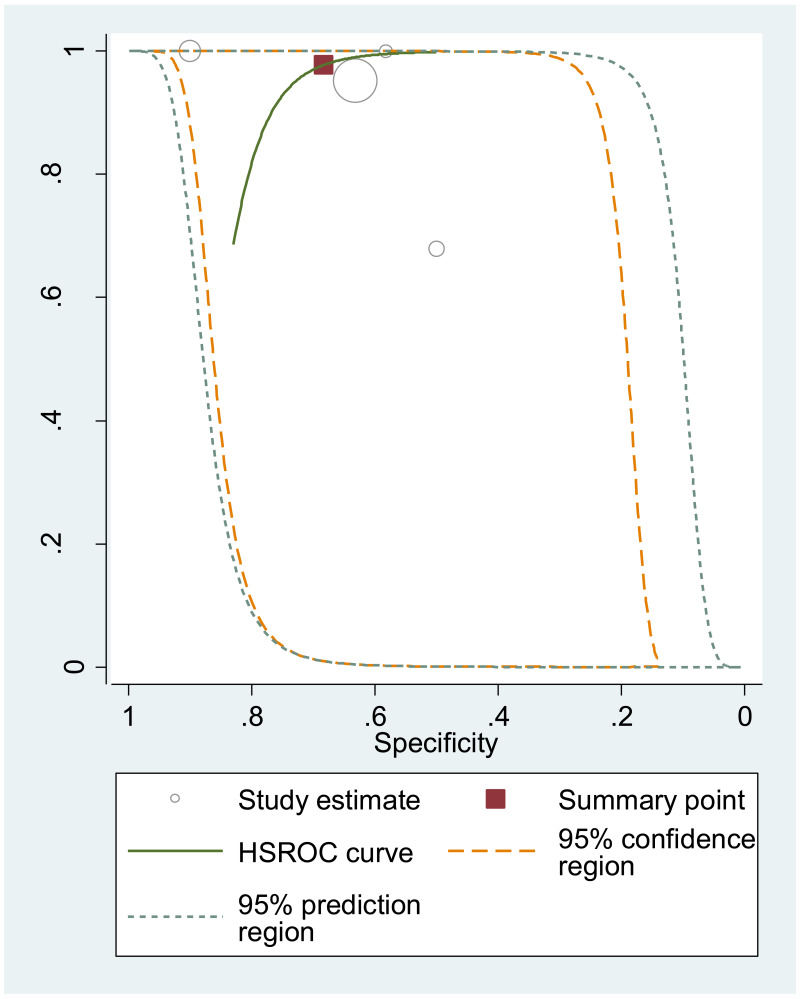
Balshem H, Helfand M, Schünemann HJ, Oxman AD, Kunz R, Brozek J, et al. GRADE guidelines: 3. Rating the quality of evidence. J Clin Epidemiol. 2011;64(4):401–6. [PubMed: 21208779]
31.
Bai H, Yan H, Shang H, Sun J, Luo H. Clinical study on HBV infection and intrauterine vertical transmission. J Foshan Univ. 2010;28(3):76–8.
32.
Bissinger A, Enders G, Schalasta G, Vergopoulos A. Frequency of hepatitis B antigen positive pregnant women with high viral loads detected during routine antenatal care in Germany. J Hepatol [Internet]. 2013;58(SUPPL. 1):S398. Available from: http://ovidsp​.ovid.com/ovidweb​.cgi?T=JS&PAGE​=reference&D​=emed14&NEWS​=N&AN=71055240
33.
Cai J, Jin Q, Lu M. Real-time PCR analysis of serum HBV DNA in 1018 pregnant women. Matern Child Heal Care China. 2005;20(14):1739–41.
34.
Cai S, Zhao L. Discuss on relative factors of maternal-infant vertical transmission of hepatitis B virus. Mod Diagn Treat. 2009;20(1):23–4.
35.
Carey I, McLeod M-A, Bruce M, Horner M, Wang B, Spaan M, et al. Does post-delivery ALT flare modulate the natural course of hepatitis B infection? J Hepatol [Internet]. 2017;66(1 Supplement 1):S246. Available from: https://www​.cochranelibrary​.com/central/doi/10​.1002/central/CN-01469201/full
36.
Carey I, Bruce M, Mcleod M, Bowyer T, Horner M, Byrne R, et al. A new utility of HBcrAg-a pan-genotypic predictor of mother to child HBV transmission. J Hepatol [Internet]. 2018;68 (suppl(Supplement 1):S490–S491 (abstr). Available from: http://ovidsp​.ovid.com/ovidweb​.cgi?T=JS&PAGE​=reference&D​=emexa&NEWS​=N&AN=621859043
37.
Chang C, Chang M, Jeong D, Aziz N, Lau D, Trinh H. Characterization and statistical modeling to estimate timing and duration of antiviral therapy to achieve target HBV DNA <=200,000 IU/mL at delivery to reduce risk of mother to child transmission (MTCT) in pregnant women with chronic hepatitis B (CHB). Gastroenterology [Internet]. 2017;152(5 Supplement 1):S1087. Available from: http://ovidsp​.ovid.com/ovidweb​.cgi?T=JS&PAGE​=reference&D​=emed18&NEWS​=N&AN=618671664
38.
Chen T, Wang J, Qiu H, Yu Q, Yan T, Qi C, et al. Different interventional criteria for chronic hepatitis B pregnant women with HBeAg(+) or HBeAg(-). Med [Internet]. 2018;97(27):e11406. Available from: https://www​.scopus.com/inward/record​.uri?eid=2-s2​.0-85049944318&doi=10​.1097%2FMD​.0000000000011406&partnerID​=40&md5=d0bac31a8f8f57226ad9c8a3242fd88c [PMC free article: PMC6076167] [PubMed: 29979437]
39.
Chen T, Liu J, Yu Q, Yao N, Yang Y, Wu Y, et al. Tenofovir plus hepatitis B immunoglobulin treatment resulted in a rapid HBV DNA load decline in high-risk pregnant women who missed the optimal time window of antiviral prophylaxis. Antivir Ther. 2018 Dec; [PubMed: 30570488]
40.
Chen Z-X, Gu G-F, Bian Z-L, Cai W-H, Shen Y, Hao Y-L, et al. Clinical course and perinatal transmission of chronic hepatitis B during pregnancy: A real-world prospective cohort study. J Infect [Internet]. 2017 Aug;75(2):146–54. Available from: http://www​.elsevier.com​/inca/publications​/store/6/2/3/0/5/4/index.htt [PubMed: 28551372]
41.
Cheng S, Liao Z, Cui T, Cao H, Zeng X. The relationship between HBV infections status in pregnant women and intrauterine infection of fetus. Chinese J Eugen Genet. 2006;14(11):73–4.
42.
Cheung KW, Seto MTY, So PL, Wong D, Mak ASL, Lau WL, et al. Optimal timing of hepatitis B virus DNA quantification and clinical predictors for higher viral load during pregnancy. Acta Obstet Gynecol Scand. 2019;98(10):1301–6. [PubMed: 31021394]
43.
Chotun N, Preiser W, van Rensburg CJ, Fernandez P, Theron GB, Glebe D, et al. Point-of-care screening for hepatitis B virus infection in pregnant women at an antenatal clinic: A South African experience. PLoS One [Internet]. 2017;12(7):e0181267. Available from: http://journals​.plos​.org/plosone/article/file?id=10​.1371/journal​.pone.0181267&type=printable [PMC free article: PMC5521792] [PubMed: 28732085]
44.
Dervisevic S, Ijaz S, Chaudry S, Tedder RS. Non-A hepatitis B virus genotypes in antenatal clinics, United Kingdom. Emerg Infect Dis [Internet]. 2007 Nov;13(11):1689–93. Available from: http://www​.cdc.gov/eid​/content/13/11/pdfs/1689.pdf [PMC free article: PMC3375778] [PubMed: 18217552]
45.
Ding Y, Sheng Q, Ma L, Dou X. Chronic HBV infection among pregnant women and their infants in Shenyang, China. Virol J [Internet]. 2013 Jan;10:17. Available from: http://ovidsp​.ovid.com/ovidweb​.cgi?T=JS&PAGE​=reference&D​=emexa&NEWS​=N&AN=369370728 [PMC free article: PMC3568011] [PubMed: 23294983]
46.
Dolman G, Saleh H, Kemos P. Quantitative hepatitis B surface antigen (qHBsAg) has poor performance as a marker of high risk antenatal chronic hepatitis B (CHB) in a multi-ethnic population. Hepatology [Internet]. 2018;68 (suppl(Supplement 1):1187A–1188A (abstr). Available from: http://ovidsp​.ovid.com/ovidweb​.cgi?T=JS&PAGE​=reference&D​=emexa&NEWS​=N&AN=624566411
47.
Dopico E, Navarro R, Allende B, Faith S, Moure Z, Guerrero L. Chronic hepatitis B virus infection in pregnant Chinese women living in Barcelona (Spain). Trop Med Int Heal [Internet]. 2013;18(SUPPL. 1):140. Available from: http://ovidsp​.ovid.com/ovidweb​.cgi?T=JS&PAGE​=reference&D​=emed14&NEWS​=N&AN=71540307
48.
Dyson JK, Waller J, Turley A, Michael E, Moses S, Valappil M, et al. Hepatitis B in pregnancy. Frontline Gastroenterol [Internet]. 2014 Apr;5(2):111–7. Available from: http://fg​.bmj.com/content/5/2/111​.full.pdf+html [PMC free article: PMC3963528] [PubMed: 24683447]
49.
Eilard A, Andersson M, Ringlander J, Wejstal R, Norkrans G, Lindh M. Vertically acquired occult hepatitis B virus infection may become overt after several years. J Infect [Internet]. 2019 Mar;78(3):226–31. Available from: http://www​.elsevier.com​/inca/publications​/store/6/2/3/0/5/4/index.htt [PubMed: 30658081]
50.
Elefsiniotis IS, Glynou I, Brokalaki H, Magaziotou I, Pantazis KD, Fotiou A, et al. Serological and virological profile of chronic HBV infected women at reproductive age in Greece. A two-year single center study. Eur J Obstet Gynecol Reprod Biol [Internet]. 2007 Jun;132(2):200–3. Available from: http://ovidsp​.ovid.com/ovidweb​.cgi?T=JS&PAGE​=reference&D​=emed10&NEWS​=N&AN=46817719 [PubMed: 17030083]
51.
Foaud HM, Maklad S, Gmal El Din A, Mahmoud F. Lamivudine use in pregnant HBsAg-females effectively reduces maternal viremia. Arab J Gastroenterol [Internet]. 2019 Mar;20(1):8–13. Available from: http://www​.arabjg.eg.net/ [PubMed: 30857834]
52.
Fujiko M, Chalid MT, Turyadi, Ie SI, Maghfira, Syafri, et al. Chronic hepatitis B in pregnant women: Is hepatitis B surface antigen quantification useful for viral load prediction? Int J Infect Dis [Internet]. 2015 Dec;41:83–9. Available from: http://ovidsp​.ovid.com/ovidweb​.cgi?T=JS&PAGE​=reference&D​=emed16&NEWS​=N&AN=607132330 [PubMed: 26571304]
53.
Godbole G, Irish D, Basarab M, Mahungu T, Fox-Lewis A, Thorne C, et al. Management of hepatitis B in pregnant women and infants: A multicentre audit from four London hospitals. BMC Pregnancy Childbirth [Internet]. 2013;13:222. Available from: http://www​.biomedcentral​.com/1471-2393/13/222 [PMC free article: PMC3879069] [PubMed: 24289183]
54.
Guo F, Liu X, Jiang B, Liu J. Analysis of hepatitis B virus markers in the serum and viral load of 4461 pregnant woman. Chinese J Soc Med. 2007;24(4):284–6.
55.
Han Y, Liu Z, Pan F, Wang X. Study on HBV infection and intrauterine infection in pregnant women. Matern Child Heal Care China. 2007;22(1):29–30.
56.
Hao X, Li Z, Ding Y, Du Y, Zhao Y. Study on risk factors in trans-placental transmission of hepatitis B virus. Shanghai J Prev Med. 2015;27(7):387–91.
57.
Hu Q, Wang Y. Results in detection of perinatal infectious disease markers in 3658 lying-in women. China Trop Med. 2007;7(8):1350–2.
58.
Huang L, Wang C. Investigation on the safety of breastfeeding among mothers chronically infected with hepatitis B virus. Matern Child Heal Care China. 2014;29(33):5389–90.
59.
Jackson V, Ferguson W, Kelleher TB, Lawless M, Eogan M, Nusgen U, et al. Lamivudine treatment and outcome in pregnant women with high hepatitis B viral loads. Eur J Clin Microbiol Infect Dis [Internet]. 2015 Mar;34(3):619–23. Available from: http://link​.springer​.de/link/service/journals/10096/index​.htm [PubMed: 25381607]
60.
Jin C, Li P, Zhu T. Analysis of HBV DNA quantitative testing results in pregnant women with different patterns of HBV serological markers. Chinese J Eugen Genet. 2007;15(6):62, 116.
61.
Johannessen A, Stene-Johansen K, Mekasha B, N. B. Mother-to-child transmission of hepatitis B virus in Ethiopia. J Hepatol [Internet]. 2017;66 (suppl)(1):S470 (abstr). Available from: http://ovidsp​.ovid.com/ovidweb​.cgi?T=JS&PAGE​=reference&D​=emexa&NEWS​=N&AN=621222629
62.
Köse S, Türken M, Devrim I, Taner C. Efficacy and safety of lamivudine treatment in late pregnancy with high HBV DNA: A perspective for mother and infants. J Infect Dev Ctries [Internet]. 2011 Apr;5(4):303–6. Available from: https://www​.scopus.com/inward/record​.uri?eid=2-s2​.0-79955855125&partnerID​=40&md5=9e71b041054564ecc6d3437e307eb4f8 [PubMed: 21537073]
63.
Kubo A, Shlager L, Marks AR, Lakritz D, Beaumont C, Gabellini K, et al. Prevention of vertical transmission of hepatitis B: An observational study. Ann Intern Med [Internet]. 2014 Jun;160(12):828–35. Available from: http://annals​.org/data​/Journals/AIM/930364​/0000605-201406170-00004.pdf [PMC free article: PMC4086733] [PubMed: 24862434]
64.
Lao T, Leung T, Suen S, Chung M, Chim S, Cheung T, et al. Maternal HBeAg status and hepatitis B viral activity in HBsAg positive mothers. Am J Obstet Gynecol [Internet]. 2012;206(1 SUPPL. 1):S273. Available from: http://ovidsp​.ovid.com/ovidweb​.cgi?T=JS&PAGE​=reference&D​=emed13&NEWS​=N&AN=70633356
65.
Latthaphasavang V, Vanhems P, Ngo-Giang-Huong N, Sibounlang P, Paboriboune P, Malato L, et al. Perinatal hepatitis B virus transmission in Lao PDR: A prospective cohort study. PLoS One. 2019;14(4):1–14. [PMC free article: PMC6481786] [PubMed: 31017926]
66.
Lee LY, Aw M, Rauff M, Loh K-S, Lim SG, Lee GH. Hepatitis B immunoprophylaxis failure and the presence of hepatitis B surface gene mutants in the affected children. J Med Virol [Internet]. 2015 Aug;87(8):1344–50. Available from: http:​//onlinelibrary​.wiley.com/journal/10​.1002/(ISSN)1096-9071 [PubMed: 25782362]
67.
Li X, Zhang J, Wang C. Analysis on association between HBV markers in pregnant women with hepatitis B and neonatal infection. Int J Lab Med. 2018;39(4):495–8.
68.
Li Y. The study of the relationship between HBV infection status in pregnant women and maternal-infant transmission. Front Med. 2013;(3):86–7.
69.
Liang P, Sun C, Wang J, Luo Y, Wang J. Analysis on testing results of 4 infectious diseases in 6930 pregnant women. Int J Lab Med. 2017;38(19):2753–5.
70.
Lin J, Liao S, Guo G, Huang W, Wang C, Zhou M. Significance of hepatitis B virus DNA quantity in transmission between mothers and infants. Chin J Pediatr. 2002;40(2):84–7.
71.
Liu C-P, Zeng Y-L, Zhou M, Chen L-L, Hu R, Wang L, et al. Factors associated with mother-to-child transmission of hepatitis B virus despite immunoprophylaxis. Intern Med [Internet]. 2015;54(7):711–6. Available from: https://www​.jstage.jst​.go.jp/article/internalmedicine​/54/7/54_54.3514/_pdf [PubMed: 25832930]
72.
Liu H, Li J, Peng J, Chen Q, Yang Z, Ying R. Clinical features of pregnant women with hepatitis B virus infection. Chin J Clin. 2013;23(7):10473–6.
73.
Liu Y, Wang M, Yao S, Yuan J, Lu J, Li H, et al. Efficacy and safety of telbivudine in different trimesters of pregnancy with high viremia for interrupting perinatal transmission of hepatitis B virus. Hepatol Res [Internet]. 2016 Mar;46(3):E181–8. Available from: http:​//onlinelibrary​.wiley.com/journal/10​.1111/(ISSN)1872-034X [PubMed: 25869545]
74.
Lu H, Jin W, Huang X, Zhao Q, Mao H. Pregnant women hepatitis B markers investigation and analysis of intrauterine infection. Chinese J Exp Clin Virol. 2009;23(3):235–7. [PubMed: 20104789]
75.
Lunel-Fabiani F, Birguel J, Pivert A, Njouom R, Ducancelle A, Gautheret A, et al. Evaluation of the effectiveness of hepatitis B (HB) vaccination of newborns from HBsAg-positive mothers, followed by the national enlarged vaccination program including HB, in the health district of Tokombere, Cameroon. Hepatology [Internet]. 2018;68 (suppl:1188A–1189A (abstr). Available from: http://ovidsp​.ovid.com/ovidweb​.cgi?T=JS&PAGE​=reference&D​=emexa&NEWS​=N&AN=624566438
76.
Ma Y. The importance of standard prenatal screening for pregnant women chronically infected with hepatitis B virus. Front Med. 2014;(18):154–5.
77.
Michitaka K, Hiraoka A, Imai Y, Utsunomiya H, Tatsukawa H, Shimizu Y, et al. Clinical features and hepatitis B virus (HBV) genotypes in pregnant women chronically infected with HBV. Intern Med [Internet]. 2012;51(24):3317–22. Available from: http://ovidsp​.ovid.com/ovidweb​.cgi?T=JS&PAGE​=reference&D​=emed13&NEWS​=N&AN=366408856 [PubMed: 23257514]
78.
Peng N, Ling J. Analysis of serum HBV DNA, HBV Pre S1 antigen and alpha fetoprotein in pregnant women chronically infected with hepatitis B. Lab Med Clin. 2012;9(20):2606–8.
79.
Peng S, Wan Z, Liu T, Zhu H. Incidence and Risk Factors of Intrauterine Transmission among Pregnant Women with Chronic Hepatitis B Virus Infection. J Clin Gastroenterol [Internet]. 2019;53(1):51–7. Available from: http://journals​.lww.com/jcge [PubMed: 29517711]
80.
Pirillo MF, Bassani L, Germinario EAP, Mancini MG, Vyankandondera J, Okong P, et al. Seroprevalence of hepatitis B and C viruses among HIV-infected pregnant women in Uganda and Rwanda. J Med Virol [Internet]. 2007 Dec;79(12):1797–801. Available from: http://ovidsp​.ovid.com/ovidweb​.cgi?T=JS&PAGE​=reference&D​=emed10&NEWS​=N&AN=350006301 [PubMed: 17935164]
81.
Pirillo MF, Scarcella P, Andreotti M, Jere H, Buonomo E, Sagno J-B, et al. Hepatitis B virus mother-to-child transmission among HIV-infected women receiving lamivudine-containing antiretroviral regimens during pregnancy and breastfeeding. J Viral Hepat [Internet]. 2015 Mar;22(3):289–96. Available from: http://www​.blackwell-science.com/jvh [PubMed: 25174900]
82.
Punzalan C. Factors associated with immunoprophylaxis failure against vertical transmission of hepatitis B virus among a cohort of New York City children and mothers. Hepatology [Internet]. 2012;56(SUPPL. 1):638A. Available from: http://ovidsp​.ovid.com/ovidweb​.cgi?T=JS&PAGE​=reference&D​=emed13&NEWS​=N&AN=70942510
83.
Rouet F, Chaix M-L, Inwoley A, Msellati P, Viho I, Combe P, et al. HBV and HCV prevalence and viraemia in HIV-positive and HIV-negative pregnant women in Abidjan, Cote d’Ivoire: The ANRS 1236 study. J Med Virol [Internet]. 2004 Sep;74(1):34–40. Available from: http://ovidsp​.ovid.com/ovidweb​.cgi?T=JS&PAGE​=reference&D​=emed8&NEWS​=N&AN=38988857 [PubMed: 15258966]
84.
Samadi Kochaksaraei G, Congly SE, Matwiy T, Castillo E, Martin SR, Charlton CL, et al. Cost-effectiveness of quantitative hepatitis B virus surface antigen testing in pregnancy in predicting vertical transmission risk. Liver Int [Internet]. 2016 Nov;36(11):1604–10. Available from: http://www​.wiley.com/bw/journal​.asp?ref=1478-3223 [PubMed: 27059287]
85.
Segeral O, N’Diaye DS, Prak S, Nouhin J, Chhun S, Khamduang W, et al. Usefulness of a serial algorithm of HBsAg and HBeAg rapid diagnosis tests to detect pregnant women at risk of HBV mother-to-child transmission in Cambodia, the ANRS 12328 pilot study. J Clin Virol [Internet]. 2018 Dec;109:29–34. Available from: http://www​.elsevier.com​/inca/publications/store/5/2/4/0/6/2 [PubMed: 30388664]
86.
Sellier PO, Maylin S, Bercot B, Chopin D, Lopes A, Simoneau G, et al. Prospective interventional study of tenofovir in pregnancy to prevent vertical transmission of hepatitis B in highly viremic women. Eur J Gastroenterol Hepatol [Internet]. 2017 Mar;29(3):259–63. Available from: http://journals​.lww.com​/eurojgh/pages/default.aspx [PubMed: 27879486]
87.
Seo K Il, Bae SH, Sung PS, Park C-H, Lee HL, Kim HY, et al. Effect of antiviral therapy in reducing perinatal transmission of hepatitis B virus and maternal outcomes after discontinuing them. Clin Mol Hepatol [Internet]. 2018 Dec;24(4):374–83. Available from: http://www​.e-cmh.org​/upload/pdf/cmh-2017-0082.pdf [PMC free article: PMC6313021] [PubMed: 29940720]
88.
Shao Z-J, Zhang L, Xu J-Q, Xu D-Z, Men K, Zhang J-X, et al. Mother-to-infant transmission of hepatitis B virus: A Chinese experience. J Med Virol [Internet]. 2011;83(5):791–5. Available from: http://ovidsp​.ovid.com/ovidweb​.cgi?T=JS&PAGE​=reference&D​=emed12&NEWS​=N&AN=361452842 [PubMed: 21360547]
89.
Sheng Q-J, Wang S-J, Wu Y-Y, Dou X-G, Ding Y. Hepatitis B virus serosurvey and awareness of mother-To-child transmission among pregnant women in Shenyang, China. Medicine (Baltimore) [Internet]. 2018 Jun;97(22):e10931. Available from: http://journals​.lww.com/md-journal [PMC free article: PMC6392912] [PubMed: 29851831]
90.
Shi Y, Luo H, Zhu Q. The association between serum HBV viral load and serological immune markers in pregnant women chronically infected with HBV. J Pract Med. 2012;28(16):2745–7.
91.
Söderström A, Norkrans G, Lindh M. Hepatitis B virus DNA during pregnancy and post partum: Aspects on vertical transmission. Scand J Infect Dis [Internet]. 2003;35(11–12):814–9. Available from: http://ovidsp​.ovid.com/ovidweb​.cgi?T=JS&PAGE​=reference&D​=emed8&NEWS​=N&AN=38028916 [PubMed: 14723355]
92.
Tang A, Lyu J, Chen A, He Q, Wang S. Assessing mother-to-child transmission risk in asian american women with chronic hepatitis B receiving prenatal care at two community health sites in New York City, 2007-2017. Hepatology [Internet]. 2018;68(Supplement 1):1207A. Available from: http://ovidsp​.ovid.com/ovidweb​.cgi?T=JS&PAGE​=reference&D​=emexa&NEWS​=N&AN=624566107
93.
Tang Y. Quantitative analysis of HBV serological markers and HBV-DNA in 500 pregnant women chronically infected with HBV. J Heze Med Coll. 2013;25(1):53–62.
94.
Thilakanathan C, Wark G, Maley M, Davison S, Lawler J, Lee A, et al. Mother-to-child transmission of hepatitis B: Examining viral cut-offs, maternal HBsAg serology and infant testing. Liver Int [Internet]. 2018 Jul;38(7):1212–9. Available from: http:​//onlinelibrary​.wiley.com/journal/10​.1111/(ISSN)1478-3231 [PubMed: 29532580]
95.
van Zonneveld M, van Nunen AB, Niesters HGM, de Man RA, Schalm SW, Janssen HLA. Lamivudine treatment during pregnancy to prevent perinatal transmission of hepatitis B virus infection. J Viral Hepat [Internet]. 2003 Jul;10(4):294–7. Available from: http://ovidsp​.ovid.com/ovidweb​.cgi?T=JS&PAGE​=reference&D​=emed8&NEWS​=N&AN=36801916 [PubMed: 12823596]
96.
Wang F, Han G, Li F, Xue Y. Investigation on the association between maternal HBV markers including HBV DNA and neonatal intrauterine infection. Mod Med J. 2009;37(6):435–7.
97.
Wang J, Liu J, Qi C, Yan T, Cao F, Jin L, et al. Efficacy of tenofovir disoproxil fumarate to prevent vertical transmission in mothers with lamivudine-resistant HBV. Antivir Ther [Internet]. 2015;20(7):681–7. Available from: http://www​.intmedpress​.com/serveFile.cfm?sUID​=06ce1d11-3627-4a99-80cb-e8cc733fb0da [PubMed: 26215771]
98.
Wang J, Yin J, Wang H. Survey on hepatitis B infection status among pregnant women in Yangzhou City. Maternal and Child Health Care of China. Matern Child Heal Care China. 2018;33(22):5222–4.
99.
Wang L, Wiener J, Bulterys M, Wei X, Chen L, Liu W, et al. Hepatitis B virus (HBV) load response to 2 antiviral regimens, tenofovir/lamivudine and lamivudine, in HIV/HBV-coinfected pregnant women in Guangxi, China: The tenofovir in pregnancy (TiP) study. J Infect Dis [Internet]. 2016 Dec;214(11):1695–9. Available from: http://jid​.oxfordjournals​.org/content/current [PubMed: 27658693]
100.
Wang M, Cai Q, Wan J. The expression of Toll-like receptor 4 and 7 in placental tissues of pregnant women infected with hepatitis B virus. Matern Child Heal Care China. 2018;33(22):5254–7.
101.
Wang X, Li C, Liu M, Yi W, Wang S, Liu X. Impact of different feeding patterns on mother-to-child transmission of hepatitis B virus. Chin J Perinat Med. 2015;18(8):616–20.
102.
Wang X, Xu Y, Wei Y, Deng B, Huang H. Clinical significance of detection of Pre S1 antigen and alpha fetoprotein in patients with gestational diabetic mellitus complicated with HBV infections. Chin J Nosocomiol. 2015;25(4):5672–4.
103.
Wang Z, Ji C, Gao S, Tang L, Xia J. HBV infection status of pregnant women in outpatient department of Guangdong women and children hospital. Chinese J Woman Child Heal Res. 2018;29(11):1491–3.
104.
Wei K, Lu Y, Yan L, Liu J, Zhai X, Chang Z. Prenatal serological and virological characteristics of pregnant women with chronic HBV infection in community population. Chinese J Pract Intern Med. 2017;37(12):1074–8.
105.
Wiseman E, Fraser MA, Holden S, Glass A, Kidson BL, Heron LG, et al. Perinatal transmission of hepatitis B virus: An Australian experience. Med J Aust [Internet]. 2009 May;190(9):489–92. Available from: http://www​.mja.com.au​/public/issues/190_09_040509​/wis11122_fm.pdf [PubMed: 19413519]
106.
Xu C, Liu J, Liu L, Bi Y, Xu B, Chen J, et al. Comparison of hepatitis B viral loads and viral antigen levels in child-bearing age women with and without pregnancy. BMC Pregnancy Childbirth [Internet]. 2018 Jul;18(1):292. Available from: http://www​.biomedcentral​.com/bmcpregnancychildbirth/ [PMC free article: PMC6035447] [PubMed: 29980185]
107.
Xu H, Shi D, Zhao X. Analysis on serum HBV DNA levels, HBV serological markers patterns and ALT, AST in pregnant women chronically infected with HBV. Chin J Hemorh. 2008;18(4):599–600.
108.
Yin Y, Wu L, Zhang J, Zhou J, Zhang P. Identification of risk factors associated with immunoprophylaxis failure to prevent the vertical transmission of hepatitis B virus. J Infect [Internet]. 2013;66(5):447–52. Available from: http://ovidsp​.ovid.com/ovidweb​.cgi?T=JS&PAGE​=reference&D​=emed14&NEWS​=N&AN=52388409 [PubMed: 23286968]
109.
Zhang L, Tang X, Liu C, Zhao S, Su F, Wang Y. Study on hepatitis B virus markers and HBV-DNA levels among pregnant women in Guizhou Province. Mod Prev Med. 2017;44(4):637–41.
110.
Gong Q-M, Kong X-F, Yang Z-T, Xu J, Wang L, Li X-H, et al. Association study of IFNAR2 and IL10RB genes with the susceptibility and interferon response in HBV infection. J Viral Hepat [Internet]. 2009 Sep;16(9):674–80. Available from: http://ovidsp​.ovid.com/ovidweb​.cgi?T=JS&PAGE​=reference&D​=emed11&NEWS​=N&AN=355131278 [PubMed: 19714778]
111.
Zheng H, Ren X. Quantitative analysis of serum HBV DNA in pregnant women positive for HBsAg and its influence on pregnancy outcome. Guangzhou Med. 2010;41(6):33–4.
112.
Zhu B, Li S, Tian H, Xu J, Li N, Chen Y. Influence of serum HBV DNA level in pregnant women with HBV infection on the effect of blocking mother-to-infant transmission by passive-active immunoprophylaxis. Matern Child Heal Care China. 2013;28(24):3903–5.
113.
Cheung KW, Seto MTY, Kan ASY, Wong D, Kou KO, So PL, et al. Immunoprophylaxis Failure of Infants Born to Hepatitis B Carrier Mothers Following Routine Vaccination. Clin Gastroenterol Hepatol [Internet]. 2018;16(1):144–5. Available from: https://www​.scopus.com/inward/record​.uri?eid=2-s2​.0-85040764264&doi=10​.1016%2Fj​.cgh.2017.07.013&partnerID​=40&md5=ddcdd20c82aa27036a0fb32ed29ace44 [PubMed: 28733258]
114.
Yi W, Pan CQ, Hao J, Hu Y, Liu M, Li L, et al. Risk of vertical transmission of hepatitis B after amniocentesis in HBs antigen-positive mothers. J Hepatol [Internet]. 2014 Mar;60(3):523–9. Available from: http://ovidsp​.ovid.com/ovidweb​.cgi?T=JS&PAGE​=reference&D​=emed15&NEWS​=N&AN=52905112 [PubMed: 24269471]
115.
Zhang L, Gui X-E, Wang B, Fan J-Y, Cao Q, Mullane K, et al. Serological positive markers of hepatitis B virus in femoral venous blood or umbilical cord blood should not be evidence of in-utero infection among neonates. BMC Infect Dis [Internet]. 2016 Aug;16(1):408. Available from: http://www​.biomedcentral​.com/bmcinfectdis/ [PMC free article: PMC4982401] [PubMed: 27515176]
116.
Zou H, Chen Y, Duan Z, Zhang H, Pan C. Virologic factors associated with failure to passive-active immunoprophylaxis in infants born to HBsAg-positive mothers. J Viral Hepat. 2012 Feb;19(2):e18–25. [PubMed: 22239517]
117.
Zhang Z, Li A, Xiao X. Risk factors for intrauterine infection with hepatitis B virus. Int J Gynecol Obstet [Internet]. 2014 May;125(2):158–61. Available from: http://www​.elsevier.com/locate/ijgo [PubMed: 24598349]
118.
Lu Y, Zhu F-C, Liu J-X, Zhai X-J, Chang Z-J, Yan L, et al. The maternal viral threshold for antiviral prophylaxis of perinatal hepatitis B virus transmission in settings with limited resources: A large prospective cohort study in China. Vaccine [Internet]. 2017 Dec;35(48):6627–33. Available from: http://www​.elsevier.com/locate/vaccine [PubMed: 29079104]
119.
Pan CQ, Zou H-B, Chen Y, Zhang X, Zhang H, Li J, et al. Cesarean section reduces perinatal transmission of hepatitis B virus infection from hepatitis b surface antigen-positive women to their infants. Clin Gastroenterol Hepatol [Internet]. 2013 Oct;11(10):1349–55. Available from: http://ovidsp​.ovid.com/ovidweb​.cgi?T=JS&PAGE​=reference&D​=emed14&NEWS​=N&AN=52726220 [PubMed: 23639606]
120.
Ott JJ, Stevens GA, Wiersma ST. The risk of perinatal hepatitis B virus transmission: hepatitis B e antigen (HBeAg) prevalence estimates for all world regions. BMC Infect Dis [Internet]. 2012 Dec 9 [cited 2019 Sep 7];12(1):131. Available from: http://www​.ncbi.nlm.nih​.gov/pubmed/22682147 [PMC free article: PMC3478174] [PubMed: 22682147]
121.
Lin H-H, Kao J-H, Chang T-C, Hsu H-Y, Chen D-S. Secular trend of age-specific prevalence of hepatitis B surface and e antigenemia in pregnant women in Taiwan. J Med Virol [Internet]. 2003 Apr [cited 2019 Sep 7];69(4):466–70. Available from: http://www​.ncbi.nlm.nih​.gov/pubmed/12601752 [PubMed: 12601752]
122.
Shimakawa Y, Lemoine M, Njai HF, Bottomley C, Ndow G, Goldin RD, et al. Natural history of chronic HBV infection in West Africa: a longitudinal population-based study from The Gambia. Gut [Internet]. 2016 Dec [cited 2019 Sep 7];65(12):2007–16. Available from: http://gut​.bmj.com/lookup/doi/10​.1136/gutjnl-2015-309892 [PubMed: 26185161]
123.
Thompson AJ V, Nguyen T, Iser D, Ayres A, Jackson K, Littlejohn M, et al. Serum hepatitis B surface antigen and hepatitis B e antigen titers: disease phase influences correlation with viral load and intrahepatic hepatitis B virus markers. Hepatology [Internet]. 2010 Jun [cited 2019 Sep 7];51(6):1933–44. Available from: http://doi​.wiley.com/10.1002/hep.23571 [PubMed: 20512987]
124.
Shimakawa Y, Ndow G, Njie R, Njai HF, Takahashi K, Akbar SMF, et al. Hepatitis B Core-related Antigen: An Alternative to Hepatitis B Virus DNA to Assess Treatment Eligibility in Africa. Clin Infect Dis [Internet]. 2019 May 17 [cited 2019 Nov 29]; Available from: http://www​.ncbi.nlm.nih​.gov/pubmed/31102406 [PubMed: 31102406]

8. Appendices

Appendix A. Search strategies

Database: PubMed

Date searched: From 1 January 2000 to 3 April 2019

Search strategy:

ItemSearch words# Records
1“hepatitis b”[MeSH] OR “hepatitis b virus”[MeSH]36043
2hepatitis b[Text] OR type b hepatitis[Text] OR hepatitis type b[Text] OR hbv[Text] OR vhb[Text] OR hep b[Text] OR hbsag[Text] OR hbs ag[Text] OR hbs antigen*[Text]58981
31 OR 258981
4“viral load”[MeSH] OR “viremia”[MeSH] OR “DNA, viral”[MeSH] OR “nucleic acid amplification techniques”[MeSH]404088
5viral load*[Text] OR viremi*[Text] OR viraemi*[Text] OR DNA[Text] OR nucleic acid test*[Text] OR nucleic acid amplification*[Text] OR NAT[Text] OR polymerase chain reaction*[Text] OR PCR[Text]1469530
64 OR 51470454
7“pregnancy”[MeSH] OR “pregnant women”[MeSH] OR “maternal-fetal relations”[MeSH] OR “infectious disease transmission, vertical”[MeSH] OR “pregnancy complications, infectious”[MeSH] OR “prenatal diagnosis”[MeSH]374590
8pregnan*[Text] OR trimest*[Text] OR gestation*[Text] OR antepartum[Text] OR ante-partum[Text] OR prepartum[Text] OR pre-partum[Text] OR intrapartum[Text] OR intra-partum[Text] OR peripartum[Text] OR peri-partum[Text] OR antenatal*[Text] OR ante-natal*[Text] OR prenatal*[Text] OR pre-natal*[Text] OR perinatal*[Text] OR peri-natal*[Text] OR intrauterine[Text] OR intra-uterine[Text] OR inutero[Text] OR in utero[Text] OR transplacental*[Text] OR placenta*[Text] OR vertical*[Text] OR congenital*[Text] OR mother*[Text] OR matern*[Text] OR fetomaternal*[Text] OR foetomaternal*[Text] OR fetal*[Text] OR foetal*[Text] OR fetus[Text] OR foetus[Text] OR offspring[Text] OR MTCT[Text] OR TME[Text]920702
97 OR 8924605
103 AND 6 AND 91131

Database: Embase via Ovid

Date searched: from 1 Januaryt 2000 to 3 April 2019

Search Strategy:

ItemSearch words# Records
1exp hepatitis B/ OR exp Hepatitis B virus/88165
2(hepatitis b OR type b hepatitis OR hepatitis type b OR hbv OR vhb OR hep b OR hbsag OR hbs ag OR hbs antigen*).mp.114021
31 OR 2114021
4exp virus load/ OR exp viremia/ OR exp virus DNA/ OR exp nucleic acid amplification/124590
5(viral load* OR viremi* OR viraemi* OR DNA OR nucleic acid test* OR nucleic acid amplification* OR NAT OR polymerase chain reaction* OR PCR).mp.2014356
64 OR 52031867
7exp pregnancy/ OR exp pregnant women/ OR exp mother fetus relationship/ OR exp vertical transmission/ OR exp pregnancy complication/ OR exp prenatal diagnosis/462746
8(pregnan* OR trimest* OR gestation* OR antepartum OR ante-partum OR prepartum OR pre-partum OR intrapartum OR intra-partum OR peripartum OR peri-partum OR antenatal* OR ante-natal* OR prenatal* OR pre-natal* OR perinatal* OR peri-natal* OR intrauterine OR intra-uterine OR inutero OR in utero OR transplacental* OR placenta* OR vertical* OR congenital* OR mother* OR matern* OR fetomaternal* OR foetomaternal* OR fetal* OR foetal* OR fetus OR foetus OR offspring OR MTCT OR TME).mp.1348015
97 OR 81351584
103 AND 6 AND 92696

Database: Scopus

Date searched: From 1 January 2000 to 3 April 2019

Search Strategy:

ItemSearch words# Records
1TITLE-ABS-KEY (“hepatitis b” OR “type b hepatitis” OR “hepatitis type b” OR “hbv” OR “vhb” OR “hep b” OR “hbsag” OR “hbs ag” OR “hbs antigen*”)88699
2TITLE-ABS-KEY (“viral load*” OR “viremi*” OR “viraemi*” OR “DNA” OR “nucleic acid test*” OR “nucleic acid amplification*” OR “NAT” OR “polymerase chain reaction*” OR “PCR”)2077123
3TITLE-ABS-KEY (“pregnan*” OR “trimest*” OR “gestation*” OR “antepartum” OR “ante-partum” OR “prepartum” OR “pre-partum” OR “intrapartum” OR “intra-partum” OR “peripartum” OR “peri-partum” OR “antenatal*” OR “ante-natal*” OR “prenatal*” OR “pre-natal*” OR “perinatal*” OR “peri-natal*” OR “intrauterine” OR “intra-uterine” OR “inutero” OR “in utero” OR “transplacental*” OR “placenta*” OR “vertical*” OR “congenital*” OR “mother*” OR “matern*” OR “fetomaternal*” OR “foetomaternal*” OR “fetal*” OR “foetal*” OR “fetus” OR “foetus” OR “offspring” OR “MTCT” OR “TME”)1632184
4#1 AND #2 AND #31851

Database: CENTRAL Database (The Cochrane Library)

Date searched: From 1 January 2000 to 3 April 2019

Search strategy:

ItemSearch words# Trials
1hepatitis b [MeSH, exp] OR hepatitis b virus [MeSH, exp]1744
2“hepatitis b” OR “type b hepatitis” OR “hepatitis type b” OR hbv OR vhb OR “hep b” OR hbsag OR “hbs ag” OR “hbs antigen” OR “hbs antigens”6913
31 OR 26913
4“viral load”[MeSH, exp] OR “viremia”[MeSH, exp] OR “DNA, viral”[MeSH, exp] OR “nucleic acid amplification techniques”[MeSH, exp]4212
5“viral load*” OR viremi* OR viraemi* OR DNA OR “nucleic acid test*” OR “nucleic acid amplification*” OR NAT OR “polymerase chain reaction*” OR PCR29632
64 OR 529637
7pregnancy [MeSH, exp] OR pregnant women [MeSH, exp] OR maternal-fetal relations [MeSH, exp] OR infectious disease transmission, vertical [MeSH, exp] OR pregnancy complications, infectious [MeSH, exp] OR prenatal diagnosis [MeSH, exp]5294
8pregnan* OR trimest* OR gestation* OR antepartum OR ante-partum OR prepartum OR pre-partum OR intrapartum OR intra-partum OR peripartum OR peri-partum OR antenatal* OR ante-natal* OR prenatal* OR pre-natal* OR perinatal* OR peri-natal* OR intrauterine OR intra-uterine OR inutero OR “in utero” OR transplacental* OR placenta* OR vertical* OR congenital* OR mother* OR matern* OR fetomaternal* OR foetomaternal* OR fetal* OR foetal* OR fetus OR foetus OR offspring* OR MTCT OR TME76201
97 OR 876271
103 AND 6 AND 9218

Database: Wanfang

主题: (“乙型肝炎”+“乙肝”+“乙型病毒性肝炎”+“乙型肝炎病毒”+“乙肝病毒”+“HBV”+“乙型肝炎表面抗原”+“乙肝表面抗原”+“乙型肝炎病毒表面抗原”+“乙肝病毒表面抗原”+“HBsAg”) and 主题: (“病毒载量”+“病毒血症”+“病毒 DNA”+“DNA”+“核酸扩增技术”+“核酸检测”+“核酸扩增”+“NAT”+“多聚酶链反应”+“多聚酶链式反应”+“聚合酶链反应”+“PCR”) and 主题: (“妊娠”+“孕妇”+“孕期”+“母胎”+“母亲”+“胎儿”+“新生儿”+“婴儿”+“子代”+“子女”+“母婴传播”+“垂直传播”+“妊娠并发症”+“产前筛查”+“产前诊断”+“出生前诊断”+“先天”+“产前”+“产时”+“围产”+“出生前”+“围生”+“宫内”+“跨胎盘”+“胎盘”)

Database: CNKI

SU=‘乙型肝炎’+‘乙肝’+‘乙型病毒性肝炎’+‘乙型肝炎病毒’+‘乙肝病毒’+‘HBV’+‘乙型肝炎表面抗原’+‘乙肝表面抗原’+‘乙型肝炎病毒表面抗原’+‘乙肝病毒表面抗原’+‘HBsAg’ AND SU=‘病毒载量’+‘病毒血症’+‘病毒 DNA’+‘DNA’+‘核酸扩增技术’+‘核酸检测’+‘核酸扩增’+‘NAT’+‘多聚酶链反应’+‘多聚酶链式反应’+‘聚合酶链反应’+‘PCR’ AND SU=‘妊娠’+‘孕妇’+‘孕期’+‘母胎’+‘母亲’+‘胎儿’+‘新生儿’+‘婴儿’+‘子代’+‘子女’+‘母婴传播’+‘垂直传播’+‘妊娠并发症’+‘产前筛查’+‘产前诊断’+‘出生前诊断’+‘先天’+‘产前’+‘产时’+‘围产’+‘出生前’+‘围生’+‘宫内’+‘跨胎盘’+‘胎盘’

Appendix B. QUADAS2 protocol

Domain 1: Patient Selection (PICO2A, 2B and 2C)

-

Risk of Bias: Could the selection of patients have introduced bias?

  • Signaling question 1: Was a consecutive or random sample of patients or specimens enrolled?
    Answer “yes” if the study enrolled a consecutive or random sample of eligible patients or specimens; “no” if the study selected patients or specimens by convenience; and “unclear” if the study did not report the sample selection methods.
  • Signaling question 2: Was a case-control design avoided?
    Answer “no” for a case-control study (i.e., study in which the chance of being included differs between cases (with high viral load for PICO2A and with MTCT for PICO2B & 2C) and controls (with low viral load for PICO2B and with no MTCT for PICO2B & 2C)); and “yes” for a retrospective/prospective cohort or a cross-sectional study.
  • Signaling question 3: Did the study avoid inappropriate exclusions?
    Answer “no” if the study excluded HBsAg-positive pregnant women with a criterion other than concomitant anti-HBV therapy (e.g., HCV/HDV co-infection, sever liver disease, having HBsAg-positive spouse, etc…); and “unclear” if unable to tell.

Risk of bias is rated as “low” if selection was done in a random or consecutive manner and the study was not a case-control design and did not exclude HBsAg-positive pregnant women with a criterion other than concomitant anti-HBV therapy (i.e., all answers to signaling questions rated “yes”); “high” if any signaling question was answered “no”; and ‘”unclear” if insufficient data were reported to permit a judgment (i.e., at least one signaling question rated “unclear” and no question rated “no”).

-

Applicability: Are there concerns that the included patients and setting do not match the review question?

Our primary objective is to assess the performance of HBeAg as an alternative to HBV DNA to assess eligibility for antiviral therapy initiation in pregnant women who are identified to carry HBsAg. Therefore, if a study included only selected pregnant women on the basis of HBV DNA levels or HBeAg sero-status, it may not be relevant to the study question. We will rate concerns about applicability as “low” if patients were selected irrespective of HBV DNA levels, “high” if study participants were only those with high (or low) HBV DNA levels, and “unclear” if the eligibility for inclusion in the study was not well described. Of note, if a study was designed to only include HBeAg-positive women or HBeAg-negative women, the study should be excluded from our systematic review.

Domain 2: Index Test

PICO2A and PICO2B
-

Risk of Bias: Could the conduct or interpretation of the index test have introduced bias?

  • Signaling question 1: Were the index test results interpreted without knowledge of the results of the reference standard?
    Consider “yes” if the examiner of the index text was blinded to the results of the reference standard, “no” if reference standard results were not blinded, and “unclear” if no mention of blinding, or if it is not known when the test was done.
  • Signaling question 2: If a threshold was used, was it pre-specified?
    Consider “yes” unless the study explicitly mentioned the use of a specific HBeAg threshold (PEIU/mL or cut-off index (COI)) which differs from its limit of detection.

Risk of bias is rated as “low” if both signaling questions were answered “yes”; “high” if at least one signaling question was answered “no”; and “unclear” if at least one question was rated as “unclear” and no question rated “no”.

-

Applicability: Are there concerns that the index test, its conduct, or its interpretation differ from the review question?

Rate concerns about applicability as “high” if the test was done outside pregnancy or if the type of assay used was not one of these: lateral flow immunochromatographic rapid diagnostic test (RDT), Enzyme immunoassay (EIA, ELISA), chemiluminescence immunoassay (CLIA), Radioimmunoassay (RIA), Counting immunoassay (CIA), Fluoroimmunoassay (FIA); “unclear” if some information was missing on the test (not know what type of assay was used or when it was done); “low” otherwise.

PICO2C
-

Risk of Bias: Could the conduct or interpretation of the index test have introduced bias?

  • Signaling question 1: Were the index test results interpreted without knowledge of the results of the reference standard?
    Consider “yes” if the examiner of the index text was blinded to the results of the reference standard, “no” if reference standard results were not blinded, and “unclear” if no mention of blinding, or if it is not known when the test was done.
  • Signaling question 2: If a threshold was used, was it pre-specified?
    Consider “yes” as mentioning HBV DNA threshold is part of inclusion criteria for this review.

-

Applicability: Are there concerns that the index test, its conduct, or its interpretation differ from the review question?

Rate concerns about applicability as “low”, or “unclear” if the type of test used is not reported.

Domain 3: Reference Standard

PICO2A
-

Risk of Bias: Could the reference standard, its conduct, or its interpretation have introduced bias?

  • Signaling question 1: Is the reference standard likely to correctly classify the target condition?
    Answer “no” if the reference test is a non-validated “in-house” method (without citing a previous study validating the method). Answer “unclear” if the reference test used is not described. For the other studies, answer “yes” because although there are several different methods of NAT, the test results are reliable particularly for the high HBV DNA thresholds that the current review targets.
  • Signaling question 2: Were the reference standard results interpreted without knowledge of the results of the index test?
    Answer “yes” if the examiner of the reference standard was blinded to the results of the index test; “no” if index test results were not blinded. Answer “unclear” if it is not known when the test was done or no notion of blinding was reported.

Risk of bias is rated as “low” if both signaling questions were answered “yes”; “high” if at least one signaling question was answered “no”; and “unclear” if at least one question was rated as “unclear” and no question rated “no”.

-

Applicability: Are there concerns that the target condition as defined by the reference standard does not match the question?

Since our target condition is high HBV DNA levels defined by the NAT, all studies will be rated as “low concern”.

PICO2B and PICO2C
-

Risk of Bias: Could the reference standard, its conduct, or its interpretation have introduced bias?

  • Signaling question 1: Is the reference standard likely to correctly classify the target condition?
    Answer “yes” if the reference test is performed in infants aged 6-12 months, extended to 24 months in infants who received three doses of HBV vaccine. Answer “unclear” if no mention of timing of testing.
  • Signaling question 2: Were the reference standard results interpreted without knowledge of the results of the index test?
    Answer “yes” if the examiner of the reference standard was blinded to the results of the index test; “no” if index test results were not blinded. Answer “unclear” if no notion of blinding was reported.

Risk of bias is rated as “low” if both signaling questions were answered “yes”; “high” if at least one signaling question was answered “no”; and “unclear” if at least one question was rated as “unclear” and no question rated “no”.

-

Applicability: Are there concerns that the target condition as defined by the reference standard does not match the question?

Since our target condition is clinical mother-to-child transmission of HBV defined by the HBsAg or HBV DNA positivity in infants, all studies will be rated as “low concern”.

Domain 4: Flow and Timing

PICO2A
-

Risk of Bias: Could the patient flow have introduced bias?

  • Signaling question 1: Was there an appropriate interval between the index test and reference standard?
    Answer “yes” if both HBeAg and HBV DNA tests were done using the same sample. Answer “no” if the sample used for HBeAg test and the sample used for HBV DNA test were not collected on the same day. Answer “unclear” if information on when HBeAg or HBV DNA testing was performed is missing.
  • Signaling question 2: Did all patients in the study receive the same reference standard?
    Answer “no” if different NAT methods were used for different patients; and “unclear” if NAT method was not defined.
  • Signaling question 3: Were all patients included in the analysis?
    Answer “yes” if the number of patients enrolled was the same as the number of individual patient data obtained; “no” if the number of individual patient data obtained was smaller than the number of patients enrolled; and “unclear” if the number of patients enrolled was not presented in the original study.

Risk of bias is rated as “low” all signaling questions are answered “yes”; “high” if at least one question is answered “no”; and “unclear” if at least one question was answered “unclear” and no question rated “no”.

PICO2B
-

Risk of Bias: Could the patient flow have introduced bias?

  • Signaling question 1: Was there an appropriate interval between the index test and reference standard?
    Answer “yes” if maternal HBeAg was measured during pregnancy and MCTC was measured between 6 and 12 months. Answer “no” if different from this. Answer “unclear” if timing of HBeAg testing in mothers or MTCT timing of testing is unknown.
  • Signaling question 2: Did all patients in the study receive the same reference standard?
    Answer “yes” if the markers used to assess MTCT and timing of its assessment were the same for all infants.
  • Signaling question 3: Were all patients included in the analysis?
    Answer “yes” if the number of patients enrolled was the same as the number of individual patient data obtained; “no” if the number of individual patient data obtained was smaller than the number of patients enrolled; and “unclear” if the number of patients enrolled was not presented in the original study.

Risk of bias is rated as “low” all signaling questions are answered “yes”; “high” if at least one question is answered “no”; and “unclear” if at least one question was answered “unclear” and no question rated “no”.

PICO2C
-

Risk of Bias: Could the patient flow have introduced bias?

  • Signaling question 1: Was there an appropriate interval between the index test and reference standard?
    Answer “yes” if maternal HBV DNA was measured during pregnancy and MCTC was measured between 6 and 12 months. Answer “no” if different from this. Answer “unclear” if timing of HBV DNA testing in mothers or MTCT timing of testing is unknown.
  • Signaling question 2: Did all patients in the study receive the same reference standard?
    Answer “yes” if the markers used to assess MTCT and timing of its assessment were the same for all infants.
  • Signaling question 3: Were all patients included in the analysis?
    Answer “yes” if the number of patients enrolled was the same as the number of individual patient data obtained; “no” if the number of individual patient data obtained was smaller than the number of patients enrolled; and “unclear” if the number of patients enrolled was not presented in the original study.

Risk of bias is rated as “low” all signaling questions are answered “yes”; “high” if at least one question is answered “no”; and “unclear” if at least one question was answered “unclear” and no question rated “no”.

Appendix C. Data extraction sheet protocol

  • Publication details
    • ID screening
    • First author
    • Year
    • Journal
    • Language
  • Methods
    • Country
    • Study main objective
    • Study design
    • Recruitment period
    • Recruitment setting (center or regional details, number of study sites)
    • Inclusion criteria
    • Exclusion criteria
    • Maternal HBV DNA: Type of sample
    • Maternal HBV DNA: When sample was taken
    • Maternal HBV DNA: Type of assay, commercial name
    • Maternal HBV DNA: Qualitative or quantitative
    • Maternal HBeAg: Type of sample
    • Maternal HBeAg: When sample was taken
    • Maternal HBeAg: Type of assay, commercial name
    • Maternal HBeAg: Qualitative or quantitative
    • Maternal HBeAg : Limit of detection of the assay used
    • Clinical endpoint for MTCT is reported (Yes/No)
    • Infant HBsAg: Type of sample
    • Infant HBsAg: When sample was taken
    • Infant HBsAg: Type of assay, commercial name
    • Infant HBV DNA: Type of sample
    • Infant HBV DNA: When sample was taken
    • Infant HBV DNA: Type of assay, commercial name
    • Infant HBV DNA: Qualitative or quantitative
    • Infant HBV DNA: Limit of detection of the assay used
  • Preventive measures
    • Maternal antiviral therapy during pregnancy (type of drug, duration of treatment)
    • First dose of HBV vaccine: timely (≤24h) or delayed (>24h)
    • HBIG at birth
    • 3 doses of hepatitis B vaccine completed
    • Other
  • No. of participants at enrolment
    • No. of women eligible for HBsAg screening
    • No. of women screened for HBsAg
    • No. of women tested positive for HBsAg
    • No. of women who had both HBV DNA & HBeAg tested
    • No. of women tested for HBV DNA
    • Maternal HBV DNA threshold used
    • No. of women with high viral load
    • No. of women with low viral load
    • No. of women screened for HBeAg
    • No. of women tested positive for HBeAg
    • No. of women tested negative for HBeAg
  • Women’s characteristics
    • Define the population for the following characteristics (ideally this should be women who had both HBV DNA & HBeAg tested, but this may be often those who tested positive for HBsAg, irrespective of subsequent HBeAg/HBV DNA tests)
    • Mean (SD) or median (IQR) maternal age
    • Numerator/denominator by HBV viral genotypes
    • Numerator/denominator by HIV status
    • Numerator/denominator by HCV status
    • Numerator/denominator by HDV status
    • Outcomes 1: sensitivity and specificity of HBeAg to diagnose high viremia
    • Maternal HBV DNA: i) For quantitative test: HBV DNA threshold to dichotomize into high or low viral load; ii) For qualitative test: Limit of detection
    • No. with TP1 (high VL & HBeAg-pos)
    • No. with FN1 (high VL & HBeAg-neg)
    • No. with TN1 (low VL & HBeAg-neg)
    • No. with FP1 (low VL & HBeAg-pos)
    • Sensitivity of HBeAg to identify mothers with a high HBV viral load (TP / (TP+FN))
    • No. of women with indeterminate result for HBeAg (if any)
  • Infants’ characteristics
    • No. of infants tested for HBsAg at the age of 6-12 months
    • No. of infants tested for HBV DNA at the age of 6-12 months
    • Outcomes 2-1: sensitivity and specificity of maternal HBeAg during pregnancy to predict MTCT (only those reporting MTCT endpoint)
    • Definition of MTCT: infant HBsAg or HBV DNA, & in which period for the following data
    • No. with TP2-1 (MTCT & maternal HBeAg-pos)
    • No. with FN2-1 (MTCT & maternal HBeAg-neg)
    • No. with TN2-1 (No MTCT & maternal HBeAg-neg)
    • No. with FP2-1 (No MTCT & maternal HBeAg-pos)
    • Sensitivity of maternal HBeAg to predict MTCT (TP/ (TP+FN))
    • Specificity of maternal HBeAg to predict MTCT (TN / (TN+FP))
    • Outcomes 2-2: sensitivity and specificity of maternal high HBV DNA levels during pregnancy to predict MTCT (only those reporting MTCT endpoint)
    • Definition of MTCT: infant HBsAg or HBV DNA, & in which period for the following data
    • Maternal HBV DNA: i) For quantitative test: HBV DNA threshold to dichotomize into high or low viral load; ii) For qualitative test: Limit of detection
    • No. with TP2-2 (MTCT & maternal high VL)
    • No. with FN2-2 (MTCT & maternal low VL)
    • No. with TN2-2 (No MTCT & maternal low VL)
    • No. with FP2-2 (No MTCT & maternal high VL)
    • Sensitivity of maternal high VL to predict MTCT (TP / (TP+FN))
    • Specificity of maternal high VL to predict MTCT (TN / (TN+FP))
  • Other
    • Funding by industry
    • Comments
    • Need to contact an author for individual data
    • Need to contact an author for aggregated data
    • Only when there is a need to contact the author
    • Name of the author contacted
    • Title of the author contacted (e.g. PhD)
    • Affiliation of the author contacted
    • Email address of the author contacted
    • Question to ask to the author contacted
    • Was the author contacted?
    • Reply from the author contacted
  • Decision
    • Eligibility for the review
    • Reason for non-eligibility

Appendix D. Detailed QUADAS2 results for studies included in PICO2A

Low Risk High Risk ?Unclear Risk

StudyRISK OF BIASAPPLICABILITY CONCERNS
PATIENT SELECTIONINDEX TESTREFERENCE STANDARDFLOW AND TIMINGPATIENT SELECTIONINDEX TESTREFERENCE STANDARD
Bai H, 2010??
Bissinger, A, 2013???
Cai J, 2005??
Cai S, 2009??
Carey I, 2017??
Carey I, 2018??
Chang C, 2017????
Chen T, 2018??
Chen T, 2018???
Chen ZX, 2017??
Cheng S, 2006???
Cheung K, 2019???
Chotun N, 2017??
Dervisevic S, 2007???
Ding Y, 2013???
Dolman G, 2018????
Dopico E, 2013???
Dyson J, 2014???
Eilard A, 2019???
Elefsiniotis I, 2007???
Foaud H, 2019??
Fujiko M, 2015???
Godbole G, 2013??
Guo F, 2007??
Han Y, 2007???
Hao X, 2015???
Hu Q, 2007???
Huang L, 2014??
Jackson V, 2015???
Jin C, 2007????
Johannessen A, 2017???
Köse, S, 2011????
Kubo, A, 2014??
Lao, T, 2012????
Latthaphasavang, V, 2019??
Lee, L, 2015??
Li Xue-Li, 2018??
Li Yan, 2013??
Liang Pei-Song, 2017??
Lin Jian, 2002???
Liu CP, 2015???
Liu Hui-Yuan, 2013???
Liu, Yingxia, 2016??
Lu Hui-Fen, 2009??
Lunel-Fabiani, F, 2018??
Ma Yan-Hua, 2014???
Michitaka, Kojiro, 2012??
Peng Ning, 2012???
Peng, Songxu, 2019??
Pirillo, M, 2007??
Pirillo, MF, 2015??
Punzalan, C M, 2012????
Rouet, F, 2004??
Samadi Kochaksaraei, G, 2016??
Ségéral, O, 2018???
Sellier, PO, 2017??
Seo, Kwang Il, 2018??
Shao, Z, 2011??
Sheng, Q, 2018???
Shi Yan-Yan, 2012??
Söderström, A, 2003???
Tang Yong-Chun, 2013??
Tang, A, 2018???
Thilakanathan, C, 2018??
van Zonneveld, M, 2003???
Wang Feng, 2009??
Wang Jing, 2018??
Wang Miao, 2018????
Wang Xing-Xing, 2015??
Wang Xue-Ling, 2015??
Wang Zhi-Qiang, 2018??
Wang, Jing, 2015??
Wang, L, 2016???
Wei Kai-Ping, 2017??
Wiseman, E, 2009??
Xu Hui-Li, 2008
Xu, Chenyu, 2018??
Yin, Yu-zhu, 2013??
Zhang Li, 2017??
Zhang Qing, 2009???
Zheng Hong, 2010??
Zhu Bao-Shen, 2013??

Appendix E. Detailed QUADAS2 results for studies included in PICO2B

Low Risk High Risk ?Unclear Risk

StudyRISK OF BIASAPPLICABILITY CONCERNS
PATIENT SELECTIONINDEX TESTREFERENCE STANDARDFLOW AND TIMINGPATIENT SELECTIONINDEX TESTREFERENCE STANDARD
Chen Z, 2017??
Chotun N, 2017???
Ding Y, 2013??
Foaud H, 2019??
Latthaphasavang, V, 2019??
Lee, L, 2015??
Liu CP, 2015??
Liu, Yingxia, 2016??
Lunel-Fabiani, F, 2018??
Peng, Songxu, 2019???
Shao, Z, 2011??
Thilakanathan, C, 2018??
Wang, Jing, 2015??
Wiseman, E, 2009??
Yin, Yu-zhu, 2013??
Zhu Bao-Shen, 2013??

Appendix F. Detailed QUADAS2 results for studies included in PICO2C

Low Risk High Risk ?Unclear Risk

StudyRISK OF BIASAPPLICABILITY CONCERNS
PATIENT SELECTIONINDEX TESTREFERENCE STANDARDFLOW AND TIMINGPATIENT SELECTIONINDEX TESTREFERENCE STANDARD
Chen Z, 2017??
Chotun N, 2017??
Ding Y, 2013??
Latthaphasavang, V, 2019??
Lee, L, 2015??
Lui CP, 2015???
Lunel-Fabiani, F, 2018??
Peng, Songxu, 2019??
Shao, Z, 2011??
Thilakanathan, C, 2018??
Wiseman, E, 2009??
Yin, Yu-zhu, 2013??
Zhu Bao-Shen, 2013??

Appendix G. Funnel plots for publication bias

Appendix G.1. Funnel plot for all studies included in the bivariate meta-analysis of the performance of HBeAg to identify maternal HBV DNA ≥5 log10 IU/mL

Image webannexbappgf1

Appendix G.2. Funnel plot for all studies included in the bivariate meta-analysis of the performance of HBeAg to identify maternal HBV DNA ≥6 log10 IU/mL

Image webannexbappgf2

Appendix G.3. Funnel plot for all studies included in the bivariate meta-analysis of the performance of HBeAg to identify maternal HBV DNA ≥7 log10 IU/mL

Image webannexbappgf3

Appendix G.4. Funnel plot for all studies included in the bivariate meta-analysis of the performance of HBeAg during pregnancy to predict MTCT of HBV

Image webannexbappgf4

Appendix G.5. Funnel plot for all studies included in the bivariate meta-analysis of the performance of maternal HBV DNA ≥5 log10 IU/mL during pregnancy to predict MTCT of HBV

Image webannexbappgf5
© World Health Organization 2020.

Sales, rights and licensing. To purchase WHO publications, see http://apps.who.int/bookorders. To submit requests for commercial use and queries on rights and licensing, see http://www.who.int/about/licensing.

Third-party materials. If you wish to reuse material from this work that is attributed to a third party, such as tables, figures or images, it is your responsibility to determine whether permission is needed for that reuse and to obtain permission from the copyright holder. The risk of claims resulting from infringement of any third-party-owned component in the work rests solely with the user.

Some rights reserved. This work is available under the Creative Commons Attribution-NonCommercial-ShareAlike 3.0 IGO licence (CC BY-NC-SA 3.0 IGO; https://creativecommons.org/licenses/by-nc-sa/3.0/igo).

Under the terms of this licence, you may copy, redistribute and adapt the work for non-commercial purposes, provided the work is appropriately cited, as indicated below. In any use of this work, there should be no suggestion that WHO endorses any specific organization, products or services. The use of the WHO logo is not permitted. If you adapt the work, then you must license your work under the same or equivalent Creative Commons licence. If you create a translation of this work, you should add the following disclaimer along with the suggested citation: “This translation was not created by the World Health Organization (WHO). WHO is not responsible for the content or accuracy of this translation. The original English edition shall be the binding and authentic edition”.

Any mediation relating to disputes arising under the licence shall be conducted in accordance with the mediation rules of the World Intellectual Property Organization.

Bookshelf ID: NBK561130

Views

  • PubReader
  • Print View
  • Cite this Page
  • PDF version of this page (4.2M)
  • PDF version of this title (293K)

Related information

  • PMC
    PubMed Central citations
  • PubMed
    Links to PubMed

Recent Activity

Your browsing activity is empty.

Activity recording is turned off.

Turn recording back on

See more...