

Gnomon
The NCBI eukaryotic gene prediction tool
NCBI gene prediction is a combination of homology searching with ab initio modeling. The use of ab initio is threefold: a) we use ab initio scores for evaluating the alignments and locating the optimal CDS in the alignments, b) in the case when we have a partial alignment we extend this alignment using the ab initio prediction and c) when there is no experimental information we make an ab initio model. This process produces gene models that can be classified as completely supported, partially supported or not supported at all. The general philosophy behind this process is that we strongly prefer to use experimental information whenever it is available.
Before we start a genome annotation we collect several data sets. First we collect all available cDNA for the studied organism and sometimes cDNA for closely related organisms. Then we generate a Target protein set and a Search protein set. The former is a collection of the proteins that we believe should be found on the genome. Usually this includes all known proteins for the studied organism and several sets of known proteins for other, well studied genomes. The latter set is a much wider collection of eukaryotic proteins. We try to align on the genome all proteins from the Target Protein Set. The proteins from the Search Protein Set are aligned only if they are similar enough to predicted models, in which case these additional alignments are used in refining the models. In addition to the sequences used for the homology search we create an organism specific parameter set which is used for evaluation of the ab initio scores.
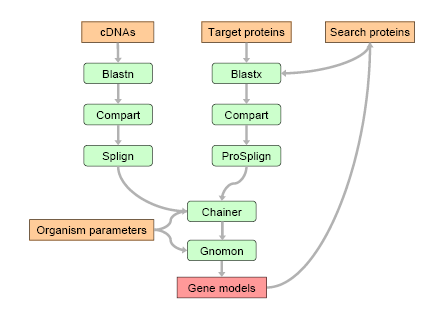 Figure 1: Available cDNAs and the Target proteins are used to build the first round predictions. These models are compared with the proteins from the much broader Search protein set. Good matches are added to the support for the second round predictions. Compart finds the approximate positions of the target sequences on the genome taking into account possible gene duplications. Splign and ProSplign are used to build spliced alignments. Chainer combines partial alignments into longer models. Gnomon extends partial models and creates the final annotation.
The chart of the data flow is shown in Figure. 1. There are several programs that are involved in the process of gene prediction. We use Compart which analyzes the BLAST hits and finds compartments which are the approximate positions of the target sequences on the genome. This program is designed to recognize gene duplications. The Compart step is done separately for cDNA and protein sets. For each compartment we make a spliced alignment using Splign for cDNA compartments and ProSplign for protein compartments. The alignments are fed into Chainer which combines partial alignments into hopefully full-length or at least longer chains. Finally, Gnomon decides if the chains are full length models and extends the chains if needed. This procedure is run twice. For the first round we use the cDNA and Target protein alignments. All predicted first round models are compared with the proteins from the Search protein set and the proteins found to be good matches are aligned on the genome using ProSplign. These additional alignments and all of the cDNA and Target protein alignments from the first round are used for the final round of predictions.
For each genome being annotated at NCBI we run the Gnomon procedure shown in Figure. 1. All gene models obtained are shown in the ab initio models map in the NCBI Map Viewer. Although the protein and RNA sequences of the models are not available in GenBank, they can be searched using the organism specific BLAST pages we provide (see the links to BLAST in the table on the Map Viewer home page).
Our final annotation is a combination of the best placements of RefSeq mRNA alignments and completely or partially supported Gnomon predictions. RefSeq alignments supersede the Gnomon models. The Gnomon models with frame shifts or premature stops are usually shown as pseudo-genes.