

How To
How to use Database Query Interface
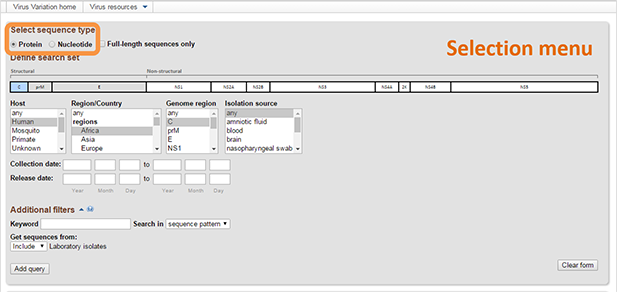
- Select the sequence type [Protein or Nucleotide]. By selecting Full-length genomes only option you will restrict queries to sequences from complete or nearly complete genomes. This selection applies to all queries in the Query Builder table.
-
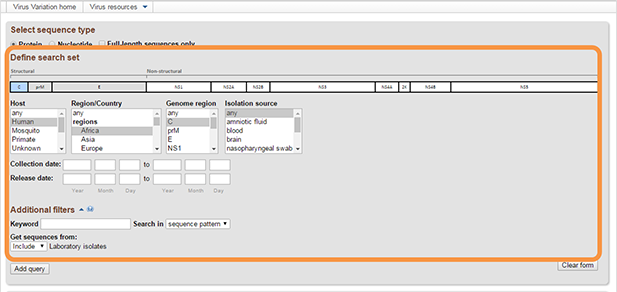
Select any combination of values from each list and/or fill in the optional text boxes to build your query. Multiple values can be selected from menus using the "control" or "shift" keys. When multiple values are selected for a particular field, these selections will be combined with "OR". Note: It is not necessary to select values for all fields. Also, not all fields are populated for all sequences.
Available fields are varied for different viruses, they may include:- Genome map. Dengue virus, West Nile virus and Zika virus resources allow to select genome region based on graphical representation of their genome. You can select several genome regions. These selections will be combined with "AND" logic in Query builder. Selected regions can be de-selected by clicking them a second time.
- Type or Species name.
- Disease [when applicable].
- Country/Region of sampling.
- Genome Region/Protein/Segment represented by sequences [From, To]. Select FROM and TO regions using the "shift" key. Regions can also be selected on the genome map by clicking the FROM and TO regions. Selected regions can be de-selected by clicking them a second time. Note: in case if multiple genome regions selected simultaneously, the result will include only genomes containing ALL selected regions ('AND' logic). If you select a mature peptide, the results will show information about the entire polyprotein containing this mature peptide.
- Collection date [From, To]. This is the collection date for the sample from which the sequence was derived.
- Release date [From, To]. This is the date when the sequence was originally released in GenBank.
- Isolation source. The terms for isolation source are parsed from the isolation source field in a sequence’s GenBank record. Examples of parsed terms are “serum,” “plasma,” and “lymphocytes,” which are all mapped to the standardized vocabulary term “blood.” Common misspellings as well as regional spelling differences are included in the mapping strategy.
- Host. The terms for host are parsed from a sequence’s GenBank record. Terms are first searched in the host field, then the isolate and strain fields, then isolation source, note, and finally organism name. Parsed terms are mapped to a standardized vocabulary, which was derived by curators by aggregating the variety of terms in GenBank files. Common misspellings are also included in this mapping strategy. For example, “Accipiter cooperii” and “Accipter cooperii” are mapped to the group name “Bird” and the common name “Accipiter.” On the query page, the Host drop-down menu lists the group names first, followed by the common names.
-
Additional filters. Additional filters include several categories to further filter results.
- Keyword search. Select definition lines from the menu to search for text strings contained within GenBank record definition lines. Select sequence pattern from the menu to search for an amino acid or nucleotide substring. Note: make sure that the appropriate "sequence type" is also selected.
-
You can also filter results based on three categories:
- Laboratory isolate,
- Vaccine strains,
- Environmental samples.
- Include - to include all sequences in a given category to the Query builder table;
- Exclude - to exclude all sequence in a given category from the Query builder table;
- Only - to retrieve only sequences in selected category.
-
In Rotavirus resource additional filters are also used to select different segments/proteins required within genome sets and choose genotypes for selected segments/proteins.
- Select proteins required in genome set. You can select any combination of proteins, or select all of them.
- Select the required genotype in selection fields displayed below each protein name. To select all genotypes for the protein, choose “any”. Multiple values in the same field can be selected from menus using the "control" or "shift" keys.
-
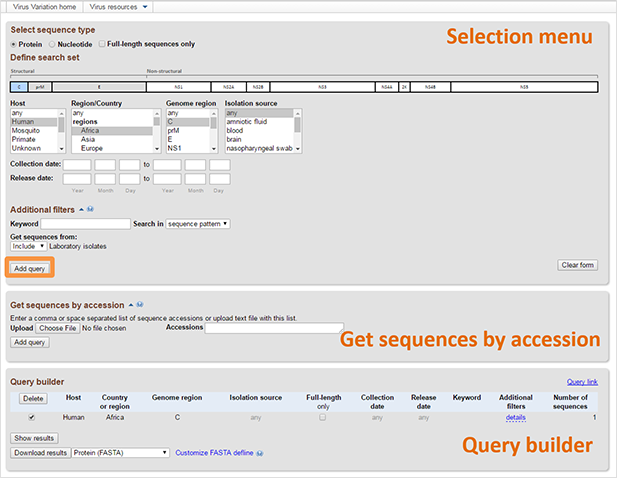
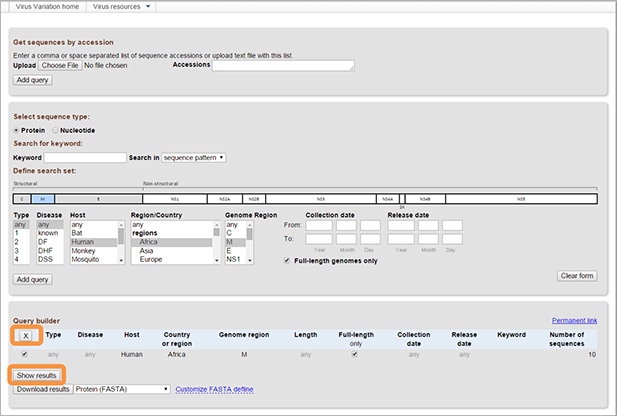
Hit "Add query". The results will appear in Query builder table on the bottom of the page. All fields will be combined with "AND," for example, "Type 1 AND Disease DF AND From UTR5 to M". A line with the details of your query as well as the number of sequences matching it will be added to the Query Builder. Multiple queries can be built in this way.
-
Queries can be (de)selected using the checkmark at the beginning of each Query Builder line. The [Delete] button deletes selected queries. Sequence can be obtained by selecting them and clicking "Show results", which will display the result view in a new page.
-
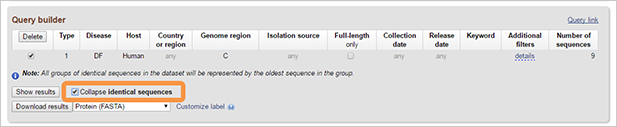
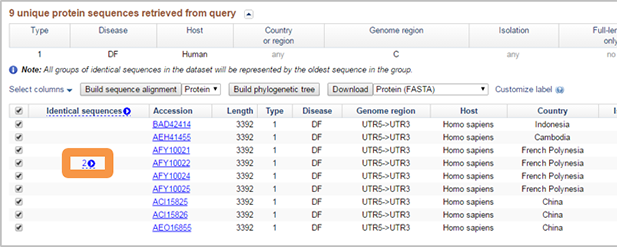
By selecting Collapse identical sequences option you will get results where all groups of identical sequences in the dataset will be represented by the oldest sequence in the group.
-
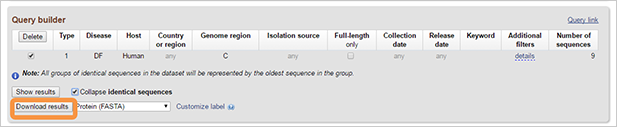
You can download results by pressing on “Download results” button. The nucleotide, protein, or CDS sequence of the selected results can be downloaded in FASTA format with the option to customize the definition line. Alternatively, accession lists can be obtained as well. Results also can be downloaded as a table in XML, CSV or tab-delimited formats.
-
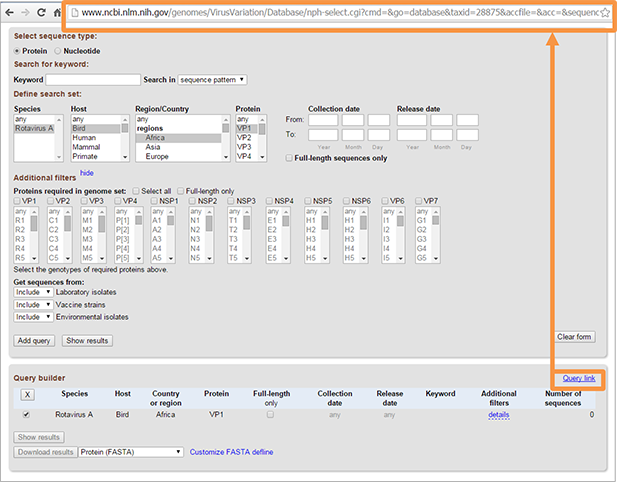
You can get the link to the page with the selected query by clinking on “Query link”. This function is helpful if you have frequently used queries. Also, if you want to report database problem, you can simply send us the link instead of describing the database query in detail.
How to use Results View
- Sequences in the results view can be sorted by up to three fields in descending or ascending order.
-
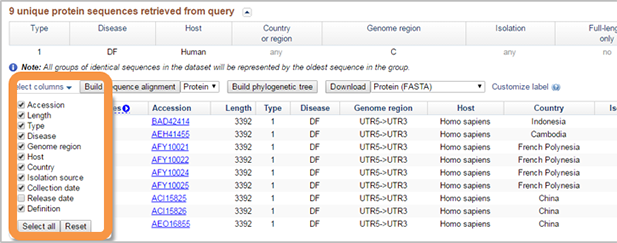
The result table can be customized in "Select columns" menu.
- Sequences can be (de)selected with the checkmark in the first column of the table.
-
If "Collapse identical sequences" option was selected in Query builder, collapsed sequences are represented by blue arrow. Click on button to open. When open you can select individual sequences. When individual sequences are selected, then arrow is greyed out, preventing group from being closed up again.
-
For the selected sequences one can:
- Build sequence alignment. Please, read about sequence alignment here.
- Build phylogenetic tree. Please, read about phylogenetic tree here.
- Download sequences. To download sequences press “Download” button. You can can choose one of the following options from the dropdown menu: FASTA format for the nucleotide, protein, or CDS sequences; protein or nucleotide accession list; result set in in XML, CSV or tab-delimited formats.
-
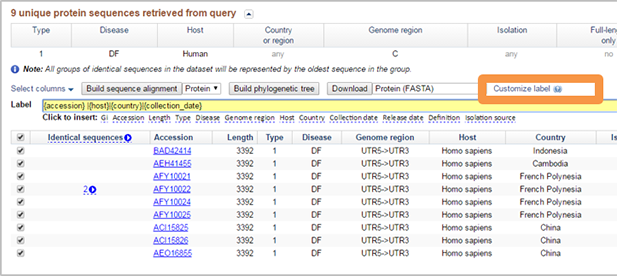
Customize FASTA deflines of downloaded sequences. FASTA deflines can be customized for downloaded sequence by clicking "Customize FASTA defline". The default defline is in the format "{accession} |{host}|{country}|{collection_date}" and includes the GenBank sequence accession, host county and collection date. However, you can change this default defline to fit your own needs. Simply clear the default defline then click to insert the desired fields into the defline builder text box. Separators can be inserted by typing a bar (|) or other characters directly between fields in the defline builder text box. For example, if you click to insert "Accession", "Length", "Genotype", "Genome region", and "Collection date" to the defline then manually type bar separators between each inserted field, then the defline will look like ">AFM82482|146|E10|NSP4|2010/06/10".
How to use Multiple Sequence Alignment View
-
Top panel. There are four basic features to the top panel of the genome viewer, a ruler, a navigation slider, a variation histogram, and a search box.
- Ruler. A ruler indicates nucleotide position along viral genome.
- Navigation. When the viewer loads, the navigation slider is located in the upper left hand corner of the top panel. To move along viral genome, place the mouse over the rectangular, colored slider handle, press and hold the left mouse button, and move the slider left or right within the panel. When the mouse button is released, the sequences displayed in the lower panel will adjust to the new position. The exact position of the slider is denoted in the upper left hand corner on the top panel, 'Region displayed.'
- Sequence variation histogram. A frequency based algorithm is used to calculate variations among the genome sequences included in the alignment. These sequence differences are plotted in red in the histogram. Variations in sequence coverage between genomes in the alignment are plotted in blue. These variations typically represent incomplete sequence information at the viral ends.
- Search box. A search box is located in the upper right hand corner of the top panel. Searches can include accession number of the GenBank records present in the alignment. All records containing a queried search string are displayed in a new window, and an individual record can be selected from the list.
-
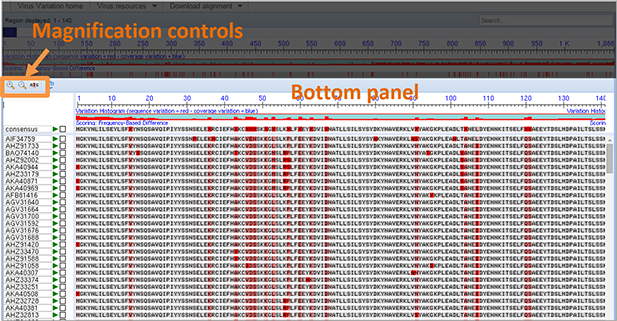
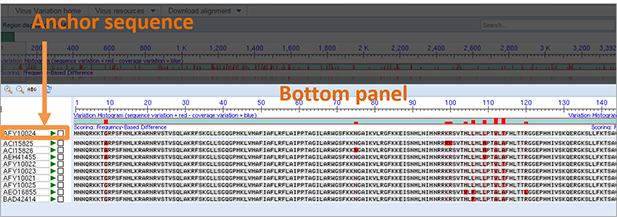
Bottom panel. The bottom panel displays the aligned viral nucleotide sequences and includes five basic elements, magnification controls, nucleotide sequences listed by accession number, alignment anchor sequence, and variation histogram.
-
Magnification controls. In the upper left hand corner of the bottom panel are three magnification controls, a zoom in button (+), a zoom out button (-), and a zoom to sequence button (ATG). These are operated by moving the mouse cursor over the control and depressing the left mouse button. Any changes to the zoom level with the bottom panel are reflected in the navigation slider in the upper panel.
-
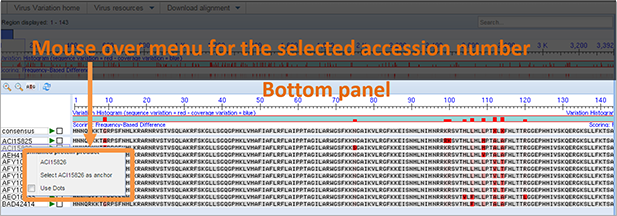
Nucleotide records. All of nucleotide records used in the alignment are listed by accession number along the left hand side of the bottom panel. The GenBank record of that accession can be seen by placing the mouse cursor over the sequence (or accession number), clicking the left mouse button, and selecting that accession number from the menu.
-
Anchor sequence. The anchor sequence for the alignment and the associated accession number are located above the rest of the alignment in the top portion of the bottom panel. When the viewer initially loads, the consensus sequence is positioned as the anchor sequence. The rest of the aligned sequences are ordered in reference to this sequence. Any sequence in the alignment can be selected as the anchor sequence by placing the mouse cursor over the sequence (or accession number), clicking the left mouse button, and selecting that accession number 'as anchor.' Any changes to the anchor sequence are reflected in the sequence variation histograms. The anchor sequence can be changed back to the alignment consensus by placing the mouse cursor over the anchor sequence (or anchor accession number), clicking the left mouse button, and selecting 'Reset consensus as anchor'.
-
Sequence alignment. The sequence alignment is shown below the consensus or anchor sequence. It can be visualized in two ways: All nucleotides in each sequence can be shown (default setting), or only those nucleotides that differ from the consensus can be shown (click on sequence in the alignment and select "use dots" option from the menu). Differences between a given sequence and the anchor sequence are highlighted in red. Clicking on any sequence shows a popup that provides links to:
- View the selected sequence in GenBank.
- Select the sequence as the new anchor sequence, replacing the consensus.
- Use dots instead of residues to represent conserved sequences.
-
Magnification controls. In the upper left hand corner of the bottom panel are three magnification controls, a zoom in button (+), a zoom out button (-), and a zoom to sequence button (ATG). These are operated by moving the mouse cursor over the control and depressing the left mouse button. Any changes to the zoom level with the bottom panel are reflected in the navigation slider in the upper panel.
- Alignments can be downloaded in FASTA, CLUSTAL, PHYLIP, NEXUS or ASN.1 formats by clicking on “Download alignment” menu button and choosing the method from dropdown menu. The representation for each download format is described in the table below.
| Download format | Description | Example |
|---|---|---|
| FASTA plus gaps | Title preceded by ">", unlimited length, fields separated by |, spaces allowed. Note: In many programs, the title will be cut off at 1st space. |
>KU206781|Homo sapiens|Bulgaria|2015/08/27 GGACTGAAGAGGG… |
| Clustal | GenBank Accession followed by at least one space. | KU206781 GGACTGAAGAGGG... |
| Phylip sequential | GenBank Accession followed by enough spaces to be 10 characters long. | KU206781 GGACTGAAGAGGG... |
| Phylip interleaved | GenBank Accession followed by enough spaces to be 10 characters long. | KU206781 GGACTGAAGAGGG... |
| Nexus | GenBank Accession followed by one space. | KU206781 GGACTGAAGAGGG... |
| ASN.1 | Separate fields for the GenBank Accession, and the other metadata descriptors. | Please see details here. |
Influenza virus resource has its own multiple sequence alignment tool. Please, refer to Influenza virus resource help documents to read how to do multiple sequence alignment using Influenza virus resource.
How to use Tree Viewer?
Tree Viewer (TV) is accessible from the results and the alignment views with the "Build a tree" button.
TV is used to make a clustering or phylogenetic tree with protein or coding region sequences obtained from the database with the option of uploading trees provided by users. It allows visualize trees in Tree formats that are accepted for upload include ASN (text and binary) and, Newick, and trees can be downloaded in ASN (text and binary), Newick, and Nexus formats.
What you can do with a tree?
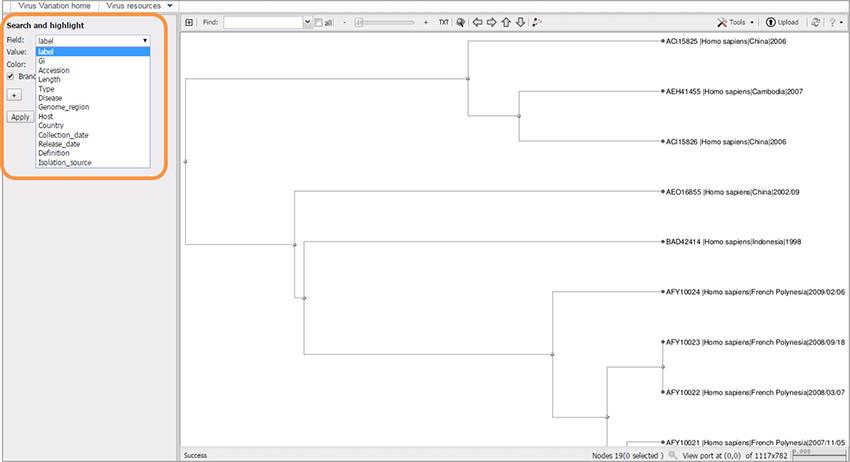
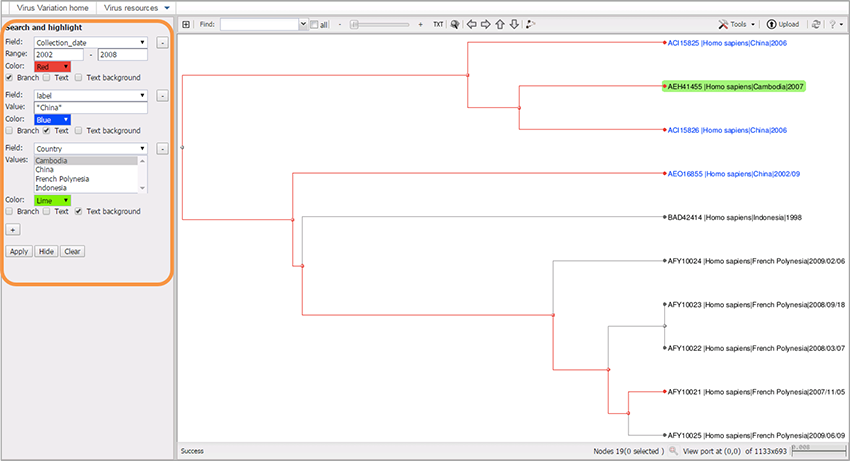
1. Highlight branches and/or labels based on metadata and other parameters
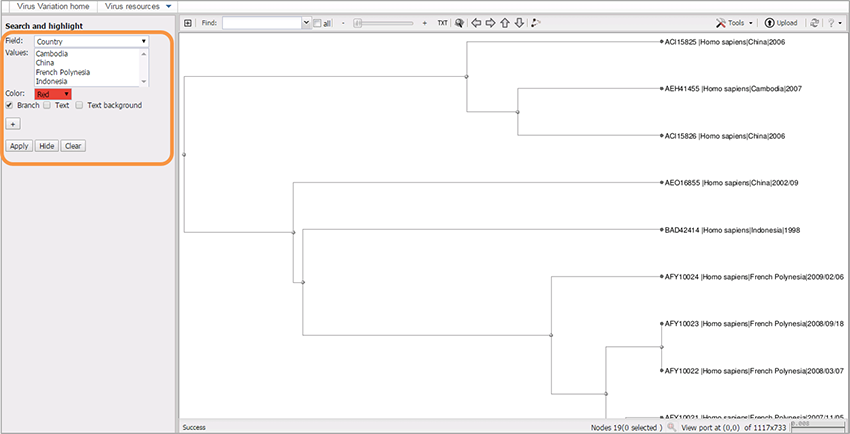
From the “Search and Highlight” panel on the left of the window, choose the desired virus metadata field (e.g. GI/Accession/Length/ Type/Genome_region/Host/Country/Collection_date/Release_date/Definition/Isolation_source), and an appropriate value.
Select value:
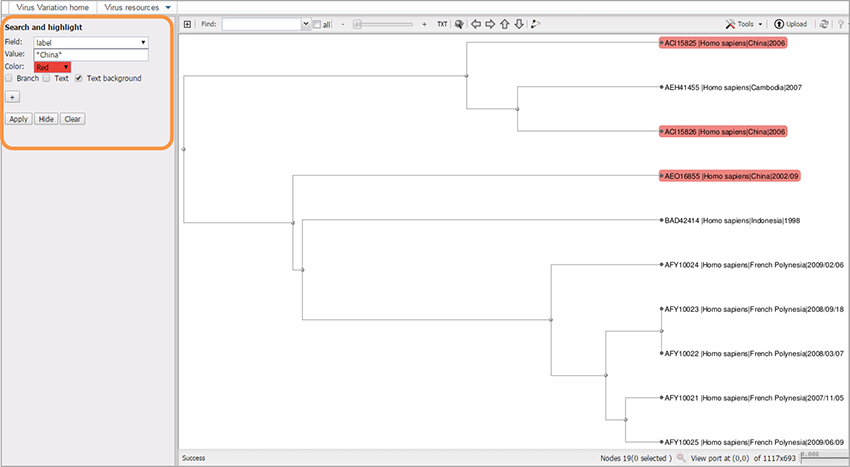
The default field is called “label;” it allows you to search for the text in the “Value” field, where you can type either the full sequence label, or just a part of the label surrounded by asterisks (*). For example: *China*.
Choose the highlighting color from the menu.
- To highlight tree branches check box “Branch”.
- To highlight text in the labels check box “Text”.
- To highlight background of labels check box “Text background”.
- Multiple boxes can be checked.
- Hit “Apply”.
You can add multiple selection sets by pressing “+” button, and choosing different colors for each set.
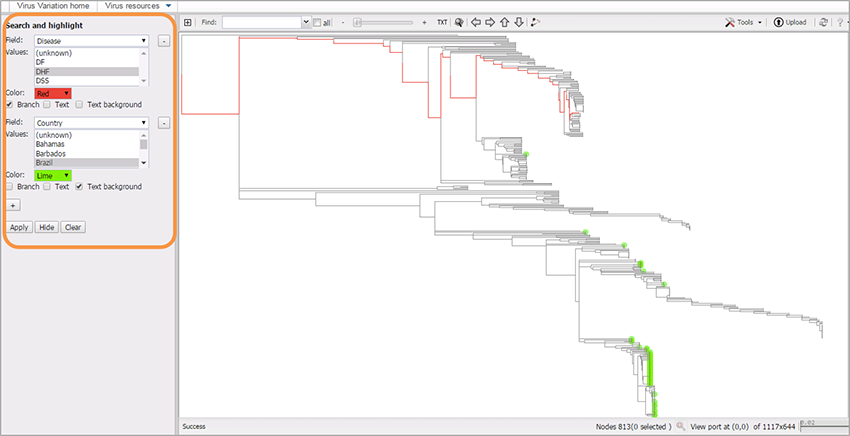
The examples of using highlighting:
- Tree was built from large scale multiple sequence alignment.
-
Tree was built from small scale multiple sequence alignment.
2. Zoom in, zoom out and navigate.
Please, find video tutorial here.
3. Select branches, change layout and overview selection.
Please, find video tutorial here.
Please, find video tutorial here.
4. Select/highlight multiple branches.
Please, find video tutorial here.
5. Download data in different formats, including ASN, Newick, Nexus and PDF.
Please, find video tutorial here.
6. Upload your own data in ASN and Newick formats.
Please, find video tutorial here.
7. Sort sequences.
Please, find video tutorial here.
8. Search and edit tree labels.
Please, find tutorial here.
9. Collapse and expand branches.
To collapse branches at a particular node, mouse over the node, and choose “collapse” from popup menu. To expand braches choose "expand".
To see the subtree that descends from a node in a separate window, mouse over the node and use the “show subtree” button from the popup menu. To go back to the entire tree, click “Tools” on the upper right of the window, and select “clear subtree.”
10. Re-root at nodes.
To re-root tree at the particular node use mouse over function at this node, and choose “Re-root tree” button.
For more information on using Tree Viewer, please refer to NCBI Tree Viewer help documentation located here.
Influenza virus resource uses a different tool. Please, refer to Influenza virus resource help documents to read how to build phylogenetic trees using Influenza virus resource.