
GEO DataSet Cluster Analysis
Overview

The GEO DataSet cluster analysis program is a visualization tool for displaying cluster heat maps. Cluster analyses are one of the most powerful methods to mine and visualize high-dimensional data. They attempt to detect natural groups in data using a combination of distance metrics and linkages. Columns (Samples), and independently, the rows (genes) are rearranged to place rows with similar response patterns near each other and columns with similar response patterns near each other. Cluster results are graphically represented as 'heat maps' whereby high through low expression levels are presented as a two-color spectrum that allows the user to easily identify groups of interesting genes through visual pattern recognition. GEO cluster heat map images are interactive; cluster portions of interest may be selected, enlarged, charted as line plots, viewed in Entrez GEO Profiles, and the original data downloaded. The cluster analysis tool may be accessed from DataSet records under the "analysis" pull-down menu, or by clicking the cluster thumbnail image.
Precomputed hierarchical clusters (single linkage, complete linkage, and average linkage/UPGMA), as well as user-defined K-means/K-median clustering (where K = 2 through 15) are available. Clusters are calculated using a variety of distance metrics (Euclidean distance, Pearson correlation, or un-centered correlation coefficient). To see an example, check out the GDS10 hierarchical cluster calculated with UPGMA/un-centered correlation.
The clustering analyses provided by GEO help provide insight into the relationships between data. It is recommended that care is taken with biological interpretation using cluster results. GEO clusters are automatically generated from submitter-supplied data using a common set of parameters. Criteria such as sample size, data distribution, number of repeats, prior- or post-filtering, and normalization factors are not considered. It is for these reasons that data presented in GEO might differ from processed data reported in associated publications. Alternative algorithms, normalization procedures and distance metrics will generate different cluster outputs. For K-clustering, the initialization procedure involves random assignment of genes to each partition, so K-cluster results may be different on each run.
Cluster region selection and visualization options
Once a hierarchical or K-cluster image of interest has been identified, specific cluster regions may be selected for further analysis as follows:
- The red box is the image cropper. To move the image cropper box, drag it across the image, or click on any region of the image.
- To alter the height of the image cropper, drag the top or bottom borders of the box.
- The image cropper can also be moved using the arrow keys on the keyboard. Holding down the shift key along with the arrow keys moves the box faster; holding down the control key moves the box slower.
- Select additional regions of interest by clicking the "+" icon in the top right corner of the active image cropper box, or with "a" on the keyboard. Each selected region is numbered.
- The "Stack selections" button opens a new window to view multiple, stacked selections. The image cropper box can again be used to specify region(s) of interest on the stacked image.
- Double click the active image cropper box or hit the space bar to view an enlarged image of the selected cluster region with gene and sample annotation.
- Use the "Get selected data" button to download original values and sample information in SOFT format for the chosen cluster region(s).
- Use the "Plot selected gene profiles" button to view profile line plots for the chosen cluster region(s).
- Use the "Get profiles in Entrez-GEO" button to retrieve individual gene profile charts and accompanying information from Entrez GEO Profiles for chosen cluster region(s).
Data input, filtering and transformation
DataSet SOFT files are used as input. DataSet SOFT files contain value measurements as originally supplied by submitters. Filtering is based on the quality of the data; no assumptions are made on the distribution and range of the data. Missing values, negative count values, or data flagged with Affymetrix "Detection call=Absent" are not considered when calculating distance metrics and generating clusters. When more than 80% of the data points for a gene are invalid, the gene is not used in clustering. Transformation procedures are minimized to preserve the originality of the data distribution. Single channel count values are log (base 2) transformed; dual channel log ratio values are left as is. For hierarchical clustering, gene median centering followed by sample median centering is performed once to align data before clustering. No centering is performed for K-means/K-median clustering.
Clustering
Distance metrics
The scale of the cluster measurements determines the classification performance (or how well a set of genes or samples are separated/clustered).
Euclidean distance of gene  and
and  of
of  samples
or sample and
of genes:
samples
or sample and
of genes:

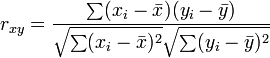
Pearson Correlation of gene and
of samples or sample
and of
genes, where
 is the mean of and
 is the mean of :
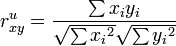
Un-centered correlation coefficient of gene and
of
samples or sample and
of genes:
Hierarchical clustering
Unsupervised hierarchical clustering is performed on all DataSets. Euclidean, Pearson correlation, and un-centered correlation coefficient distance metrics options are available. Samples are clustered if there is no ordering of the samples in the DataSet. For ascending-order DataSets, samples are not clustered and the order is not changed. Every gene and sample used in the clustering carries the same weight.
Different linkage methods affect the shape of the resulting clusters:
- Single linkage:
- The linking distance is the minimum distance between two clusters.
- Complete linkage:
- The linking distance is the maximum distance between two clusters.
- Average linkage/UPGMA:
- The linking distance is the average of all pair-wise distances between members of the two clusters. Since all genes and samples carry equal weight, the linkage is an Unweighted Pair Group Method with Arithmetic Means (UPGMA).
K-means/K-median clustering
The K-clustering procedure divides all genes into K number of clusters, such that the total distance of all genes to their cluster centers is minimized. Users can perform K-means or K-median clustering on any DataSet, and can define any number of K clusters from 2 to 15. Euclidean, Pearson correlation, and un-centered correlation coefficient distance metrics options are available. K clusters are non-hierarchical and they do not overlap. Sample clustering is not implemented in K-clustering.
The expectation-maximization algorithm first randomly assigns genes to K different groups. It then iterates to find in each group the cluster center by calculating the mean/median for all samples and reassigns each gene to the cluster with the closest center. When no more reassignment occurs, the solution is found. The program is run 3 times and the solution with the lowest total distance of all genes from their cluster centers is reported. Cluster centers are determined by calculating the mean or median of the genes over all the samples in a group. The likeliness of finding a better solution is lower if the same solution is found in higher frequency than if the reported solution is found only once.
Since the initialization procedure involves random assignment of genes to each partition, cluster results may be different on each run. Cluster results are saved in our systems for 4 hours.
References and acknowledgments
We thank and acknowledge these excellent sources as basis for this work:
- Michael Eisen's Cluster and TreeView program source code (Copyright (C) 1998-2000 Stanford University) and manual.
- Eisen, M. B., Spellman, P. T., Brown, P. O., and Botstein, D. Cluster analysis and display of genome-wide expression patterns. Proc. Natl. Acad. Sci. USA 95, 14863-8 (1998)
- De Hoon M. J., Imoto S., Nolan J., and Miyano S. Open source clustering software. Bioinformatics, Feb. (2004)
- Hartigan, J. A. (1975). Clustering algorithms (New York,: Wiley).
- Sokal, R. R., and Sneath, P. H. A. (1963). Principles of numerical taxonomy (San Francisco, W. H. Freeman).