

Image Quality Specifications
On This Page:
Return to main File Submissions Specifications page.
1. Image Quality
Generally, Authors submit raw image data files to a publishing house in various formats (PPT, PDF, TIFF, JPG, XML, etc.). The files are then normalized to produce print or electronic output. PMC requires the normalized output, which is high-resolution, and of sufficient width and quality to be considered archival. Images generated at low resolution for display purposes are not acceptable.
Graphics will be rejected if images are not submitted at or above their intended display size.
Intended Display Size
Intended display size is the physical size of a digital image as it will be displayed in the printed product, website, etc.
Example: Image size is 900 pixels wide by 600 pixels in height, and the resolution is 300 dpi.
pixel dimension / resolution = physical width
900 pixels / 300 dpi = 3 inches physical width
600 pixels / 300 dpi = 2 inches
physical height
Intended Display Size = 3 x 2 inches
The following image resolutions are accepted: Line Art 800 dpi, Combo (Line Art + Halftone) 600 dpi, Halftone 300 dpi. See the Figure Graphic Formatting Guidelines below for more details. Image files also must be cropped as close to the actual image as possible.
Avoid web-quality graphics in which images are pixelated, colors are inaccurate to their source, or the text is illegible. These undesirable qualities are usually caused by file compression applied by JPG or GIF formatting. Although TIFF and EPS files are the most desirable formats for archiving, it is important to stress that the real objective is to obtain the highest quality images available, regardless of format.
File Formats
- Uncompressed high-resolution TIFF or EPS files are preferred for all images.
- SVG formatted images are not accepted.
- All files must be cross-platform compatible.
- Do not include thumbnail versions of any full size images that are deposited in PMC.
- Graphics must be legible throughout all submissions.
Figure Graphics
For all figure graphics please ensure:
- Image width: Greater than or equal to intended display size
- Colorspace: Depends on type of image. See the table in the Figure Graphic Formatting Guidelines section.
- DPI: Depends on type of image. See the table in the Figure Graphic Formatting Guidelines section.
- Layers: Flattened
For TIFF images
- Alpha channels: None
For EPS images
- Fully embed any non-standard fonts in the image file.
- Convert the text to curves and rasterize.
2. Figure Graphic Formatting Guidelines
| Image Type | Description | Example | Recommended Format | Color Mode | Resolution |
|---|---|---|---|---|---|
| Line Art | An image composed of lines and text, which does not contain tonal or shaded areas |
|
TIFF or EPS | Monochrome 1-bit or RGB | 900 - 1200 dpi |
| Halftone | A continuous tone photograph, which contains no text |
|
TIFF | RGB or Grayscale | 300 dpi |
| Combo | Image contains halftone + text or line art elements |
|
TIFF or EPS | RGB or Grayscale | 500 - 900 dpi |
- The line example was taken from: Stasi R, Amadori S, Osborn J, Newland AC, Provan D. Long-term outcome of otherwise healthy individuals with incidentally discovered borderline thrombocytopenia. PLoS Med 2006; 3(3):e24.
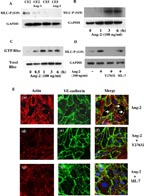
- The combination example was taken from: Parikh S, Mammoto T, Schultz A, Yuan HT, Christiani D, et al. Excess circulating angiopoietin-2 may contribute to pulmonary vascular leak in sepsis in humans. PLoS Med 2006; 3(3):e46.
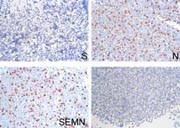
- The tone example was taken from: Nicholls JM, Butany J, Poon LLM, Chan KH, Beh SL, et al. Time course and cellular localization of SARS-CoV nucleoprotein and RNA in lungs from fatal cases of SARS. PLoS Med 2006; 3(2):e27.
Note:
All images must be submitted at or above Intended Display Size
3. Legibility
- The smallest visible text is no less than 8 points in height, when viewed at intended display size.
- Solid lines are not broken up.
- Image areas are not pixilated.
- Text is legible and of high quality.
- All text that was in the original graphic is present in the digital file submission.
- Any lines in the graphic are no smaller than 2 points width.
- The quality of the graphic is the same as, or better than, the PDF.
4. Tables as Images
Note:
Only when tables cannot be encoded as XML/SGML may they be submitted as graphics. If this method is used, it is critical that the font size in all equations and tables is consistent and legible throughout all submissions.
- The smallest visible text is no less than 8 points in height, when viewed at intended display size.
- Solid lines are not broken up.
- The table caption is coded in the XML, not included in the image.
- Image areas are not pixilated.
- Text is legible and of high quality.
- All text and symbols which were in the original graphic are present in the digital file submission.
- Any lines in the graphic are no smaller than 1-point width.
- The quality of the graphic is the same as, or better than, the PDF.
- If there is color in the table, be sure to submit a color graphic.
5. Equations as Images
Note:
Only if equations cannot be encoded in MathML, may they be sent in TIFF or EPS format as discrete files (i.e., a file containing only the data for one equation).
- Is the equation font size proportionate across entire submission?
- Superior and inferior text is no less than 7 points in height, when viewed at intended display size.
- Regular text is no less than 10 points in height.
- Resolution is 500 dpi or more at intended display size.
- Image areas are not pixilated.
- Text is legible and of a high quality.
- All text that was in the PDF is present in the digital image file submission.
- Any lines in the graphic are no smaller than 1-point width.
- The quality of the graphic is the same as, or better than, the PDF.
- Two column equations should be split into 2 parts or stacked.