

Guide to Using the Multiple Sequence Alignment Viewer
- Uploading an alignment
- Setting Columns
- View alignment information
- Expand rows to view sequence annotations
- Navigating the alignment
- Consensus sequence row
- Setting an anchor sequence
- Search for short sequences in an anchor or consensus row
- Hiding rows
- Coloring methods for nucleic acid alignment
- Coloring methods for protein alignments
- Downloading the alignment
Multiple Sequence Alignment Viewer application (MSA) is a web application that visualizes alignments created by programs such as MUSCLE or CLUSTAL, including alignments from NCBI BLAST results. Users can also upload and view their own alignment files in alignment FASTA or ASN format.
The MSA home page includes a links to sample protein and DNA alignment sessions.
This guide will show you how to upload data into MSA viewer and perform basic operations including navigation, setting an anchor row, hiding rows, and changing the coloration method.
Please download the 16SRNA_Deino_87seq.aln data file for this tutorial. This file is available on FTP as ftp://ftp.ncbi.nlm.nih.gov/toolbox/gbench/samples/16SRNA_Deino_87seq.aln.
Uploading an alignment
Click on the Upload button on the MSA home page to open the Upload Data dialog. The column on the left lists the different types of data that can be uploaded into MSA viewer:
- BLAST Results
- Data File
- URL
- Text

We will upload a Data File for a protein alignment in FASTA format created by the MUSCLE alignment software. Select Data File and click the "Browse" button to find and add the 16SRNA_Deino_87seq.aln file. Click on the "Upload" button at the bottom, wait for the data to finish uploading, and then press the "Close" button.
Confirm that the multiple alignment has been uploaded to the MSA viewer. You will see a Panorama at the top with the Alignment view below it, with the first row representing the consensus sequence. The Panorama viewer shows the coverage and quality of the alignment. Positions where the majority of sequences match the consensus are colored in gray, while positions that contain a large proportion of mismatches are colored in red.

Within the Alignment view, mismatches are highlighted in red by default. Gaps are indicated by a gray line while insertions relative to the consensus/anchor sequence are indicated by a blue bracket (see below). This rendering scheme is similar the one used by NCBI's Sequence Viewer.

Note: unaligned regions indicated by a green bracket can be found only in the “multiple alignment” created from BLAST pairwise alignments. The rules implemented to show "insertions" and “unaligned regions” in tooltips:
- ins <= 20: (full insertion in tooltip)+ length + coordinates;
- 21<= ins<= 500: (10 symbols...10 symbols) + length + coordinates;
- unaligned region > 500: only length and coordinates in tooltip;
The Sequence ID column shows sequence identifiers from the alignment. NCBI accession identifiers are linked to the corresponding resource page in the NCBI SRA, Nucleotide or Protein databases. The species associated with the sequence accession is reported in the Organism column. Note: Organism information is not shown for user-provided sequences without an NCBI accession or for NCBI accessions reported with range, e.g. FJ639741:73..10248
Note: for the image on this page, the strand indicator ((+) or (-)) was hidden by adding the parameter: &columns=s:0 to the URL.
Setting Columns
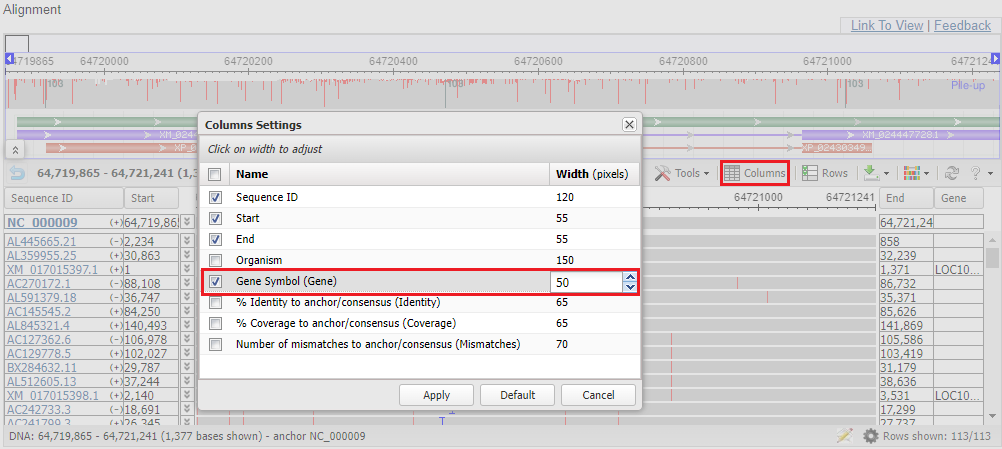
By default, the Alignment view shows metadata columns for Sequence ID (e.g. sequence accession), Start and End of the alignment, and Organism (species name). These columns can be removed and/or additional columns added using the Columns option on the toolbar. This option opens a dialog where you can customize the columns shown. Optional columns may include Gene (gene symbols for RefSeq accessions), Date (collection date), Country (collection country), Host (pathogen host), or Source (tissue source). The dialog will only suggest a column if one or more sequences in the alignment report that metadata. All additional columns are added to the right of the alignment.
The Columns Settings dialog also provides options to show columns reporting percent (%) Identity, percent (%) Coverage, or the raw number of Mismatches relative to an anchor or consensus row. To avoid confusion in interpretation, these columns will report data only when the consensus row is shown or an anchor row is set. Percent identity is calculated as the number of matches in an alignment row relative to the alignment length, where the alignment length is either the length as determined by BLAST (for a BLAST alignment) or the aligned sequence length minus any gaps (for all other alignments). Percent coverage is calculated as the number of aligned nucleotides or residues in an alignment row relative to the aligned length of the anchor or consensus sequence.
The Columns Setting dialog also reports the width of each column in pixels. Users can adjust column widths by clicking on the number and adjusting the value.
Re-sort rows by column
The alignment file or BLAST alignment calculation determines the default order of rows in the Alignment view. You can re-sort the rows alphanumerically by column data by clicking on the header of each column. Re-sorting by column data may be helpful for identifying all sequences from a particular organism, country, or accession type (e.g. RefSeq). The Consensus or Anchor row will always remain the top row and will not be sorted. Re-sorting rows in the Alignment view will not affect the row order in the FASTA alignment download file or in the Rows dialog.
View alignment information from individual sequences
Point the mouse cursor to any sequence in alignment. A tooltip will open showing the sequence ID and additional information about the aligned position.

The tooltip can be pinned by clicking on the pin icon in the left corner.
Expand rows to view sequence annotations
Click on double arrow icon to the right of the accession (for example NR_117835.1 and AJ585985.1) to expand the view to see annotated features (if any). In the example here, purple bars represents RNA features and green bars represent gene features. Refer to the graphical viewer legend page for more details on feature display in the NCBI graphical display tools.

Point your cursor to the feature to open a tooltip containing information about the annotated feature.
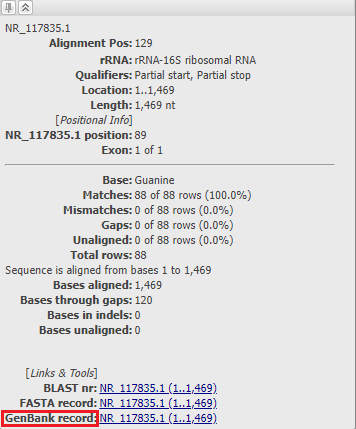
The "GenBank View" link at the bottom of the tooltip takes you to the GenBank record in the NCBI Nucleotide or Protein database. For accession NR_117835.1, the FEATURES section on the GenBank record shows a single rRNA feature (indicated by the purple bar in the MSA alignment view).

For accession AJ585985.1, the FEATURES section shows gene and rRNA features (indicated by purple and green bars in the MSA alignment view).

Open the Tools menu on the toolar or access the "right-click" context menu to find options to "Expand All" or "Collapse All". These options will expand or collapse all annotated features in all rows.
Navigating the alignment
Zoom
There are a few ways you can zoom in or out of the alignment. In the Panorama View, select the region of interest by clicking and dragging with your mouse or cursor. The selected region will be marked by a light blue box. You can adjust the size of the selection by clicking and dragging the arrows on each side of the box. The alignment will automatically shift to the selected region.
You can also zoom directly in the Alignment View by clicking and dragging within the ruler of the alignment. The alignment will automatically zoom to the selected region.
Alternately, you can use the (+) or (-) icons or the slider bar on the toolbar to zoom in or out of the alignment. The "Zoom to Sequence" (ATG) icon to the right of the slider will take you directly to the sequence level in the middle of the alignment. "Zoom In", "Zoom Out", and "Zoom to Sequence" options can also be accessed from the Tools menu on the toolbar and in the right-click context menu.
Panning
You can pan by holding down on your mouse button or cursor and dragging the alignment to the left or the right. Alternately, use the right/left arrows on the toolbar to move the alignment.
You can also click and drag the box above the Panorama to move the selected region to a different part of the alignment.

Consensus sequence row
You can choose to display a consensus row as the top row of nucleotide sequence alignments. This row shows the nucleotide that is found in greater than or equal to 70% of alignments. If there is less than a 70% consensus nucleotide at a particular alignment position, the consensus row will show an ambiguous IUPAC symbol that meets the 70% threshold. These symbols include M (A or C), R (A or G), W (A or T), S (C or G), Y (C or T), K (G or T), and N for any base. A dash (-) symbol represents a gap in the alignment.
You can set or remove the consensus using the option "Show consensus" in the Tools menu and the right-click context menu. Note that the consensus cannot be set if an anchor sequence is already set. The consensus option is currently not available for protein alignments.
You can download the FASTA file of the consensus row by selecting the option to "Download consensus" in the right-click context menu.
Setting an anchor sequence row
Look at the zoomed-out alignment of the example and see that the whole length of the alignment is 1653 nucleotides. The alignment has a consensus sequence row and doesn’t have an anchor sequence set.

In order to see how the alignment compares with a particular sequence row, you can set that sequence as the anchor sequence (previously called master). For MSA Viewer sessions originating from the NCBI BLAST resource, the BLAST query sequence will typically automatically be set as the anchor row.
Let us manually set AJ585985.1 as the anchor sequence. To set the anchor row, simply hover your cursor over the sequence alignment for this row to select the row, open the right-click context menu, and select the "Set AJ585985.1 as anchor" option. Observe AJ585985.1 is now the first sequence in the alignment and the length of the alignment is 1490 nucleotides.

Hover your cursor over any row and open the context menu again. When an anchor row has been set, the menu now has the option to set another sequence as the anchor, and also to "Unset anchor row". You must unset the anchor before you can show the consensus sequence row.

Search for short sequences in an anchor or consensus row
Search can be performed from the search box on the top toolbar using the Find button or by selecting the Search option from the Tools menu or context (right-click) menu. Only anchor or consensus rows are searchable. Sequences can be searched using the IUPAC nomenclature for nucleic acids or proteins [https://www.bioinformatics.org/sms/iupac.html]. Double clicking on a search result will zoom in to the result at the sequence level.
Examples of possible search queries:
TTCGA - will find the exact sequence and show result for positive (TTCGA) and negative(TCGAA) strands.
TCCRT (or TCC[AG]T) - will find all combinations on the positive strand (TCCAT, TCCGT, TCCRT (if search is in the consensus)), and all combinations on the negative strand (ATGGA, ACGGA, AKGGA).
Note: since each sequence in the alignment is represented by a single strand, the search results for the "complementary" strand are shown as a projection on the anchor/consensus sequence.

Show identical bases
When a consensus or anchor row is shown, bases that are identical to the sequence in this row will be shown as dots by default. To see all the bases or residues, open the Tools menu or right-click context menu and remove the checkmark from the “Show identical bases as dots” option.

Observe that all bases or residues are now shown.

Hiding rows
You can hide single sequence rows in the alignment by hovering over the alignment and selecting the option to hide the accession in the right-click context menu. When multiple rows are highlighted using the Ctrl or Shift key, the option appears to "Hide selected rows", which will remove all selected rows from view. All hidden rows can be shown again by selecting the option to "Show all rows".
Note that the row set as the anchor cannot be hidden. You must unset the anchor first before you can hide this sequence from view.

Rows Dialog
You can also use the Rows option on the Toolbar to open a dialog that allows you to set the rows that are shown in the alignment. Rows can be selected in bulk using the Shift or Ctrl keys. You can use the check box on the upper left to select or unselect all rows in the alignment. The columns in the table can be sorted in order to aid in the selection of rows. Press the "Apply" button on the lower right to close the dialog and show your changes in the alignment view.
Note: The consensus row is not considered a sequence in the alignment and therefore will not be shown in the edit rows dialog. This row can be removed by unchecking "Show consensus" in the right-click context menu.

The number of rows that are currently visible in the alignment view are reported on the status bar on lower right of the alignment. Clicking on this message will open the edit rows dialog.
Hiding rows does not result in a re-calculation of the alignment. However, hidden rows will not be exported in the FASTA alignment download or shown in PDF/SVG image files. Hidden rows will also not be shown in shared links (from "Link to View"), but will be available to be added back to the view from a shared session link.
Coloring methods for nucleic acid alignments
To access different color/display settings, go to the Coloring menu towards the right of the Toolbar.
Show Differences
Show Differences coloration is set as the default option. This method highlights differences observed from the consensus/anchor sequence in an alignment. Mismatches are shown in red.

Two other methods: Column Quality score – DNA and Frequency-Based Differences use a slightly different but conceptually similar approach. The Column Quality score method assigns scores to nucleotides based on how well a particular base agrees with the others at that column/position, and the Frequency-Based Differences method assigns scores to bases based on their representation in the column's frequency profile. Bases that occur infrequently are highlighted darker than others. Positions that contain any degree of mismatch are also highlighted in the anchor or consensus row.
Column Quality Score

Frequency Based Difference

Nucleic Acid Colors
This coloration method provides a simple rendering for nucleic acids based on assigning a standard color to each base (A - Red, G - Blue, C - Yellow, T - Green).

Nonsynonymous Substitutions
This is special coloration mode valid only for complete CDS alignments. It can be turned on using the URL parameter coloring=nss. Nucleotide triplets (codons) that are translated differently from the consensus or anchor sequence are marked in red. Codons are counted from the beginning of the sequence and colored in alternating gray hues.

Coloring methods for protein alignments
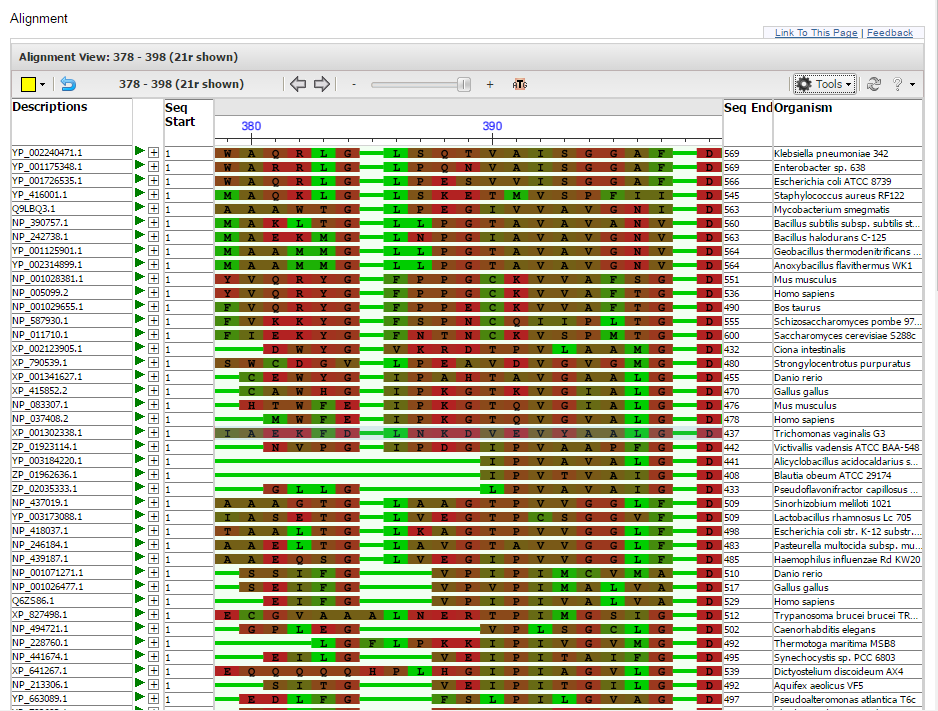
To see coloring methods available for protein alignments, open any protein alignment on the Multiple Sequence Alignment Viewer application home page, for example, https://www.ncbi.nlm.nih.gov/projects/msaviewer/?rid=MJRDFGTD013 or upload a file with protein alignment; e.g carbohydrate_kinase_FGGY.aln carbohydrate_kinase_FGGY.aln
Go to the Coloring menu towards the right of the Toolbar. Select any of the options and observe the changes to the display.
Conservation
This method highlights highly conserved and less conserved amino acid positions based on the relative entropy threshold of the residue. Only alignment positions with no gaps will be colored. Red indicates highly conserved positions and blue indicates lower conservation.

Rasmol Amino Acid Colors
This is the default coloring for a protein alignment in the MSA Viewer. Rasmol colors are described at Amino acid colors.

BLOSUM
"BLOSUM" methods use well-known substitution matrices to display the degree of match of residues relative to each alignment position/column. When an anchor row is set, the coloring in the column shows the match score to the residue on the anchor sequence: blue represents a better match while green represents a worse match. When an anchor row is not set, the color reflects the average match over all the other residues in the column.

There are also several coloration methods based on the individual properties of amino acids. See AAindex for more information about these methods.
Show Differences
Show Differences highlights differences compared to the anchor sequence in an alignment. You must set an anchor row in order to use this option. Note: Please disregard any coloring when unsetting the anchor row while still in the "Show Differences" mode.

Frequency Based Difference (protein)
Frequency-Based Difference compares the residue at a position to the position/column consensus. Darker shades of red indicate a further difference from residues in other rows in the alignment at that position.

Hydropathy Scale
This coloration method reflects side chain hydropathy, with very hydrophobic in red to very hydrophylic in blue, corrected for solvation as in https://www.ncbi.nlm.nih.gov/pubmed/3398047.

Membrane Preference
This coloration method reflects membrane-buried preference parameters as described in https://www.ncbi.nlm.nih.gov/pubmed/7151796. The color ranges from red for low membrance preference to green for high preference.

Shapely Amino Acid Colors
Shapely is another traditional coloring method. Shapely colors are described at Amino acid colors.

Signal Sequence
This coloring reflects signal sequence helical potential as described in https://www.ncbi.nlm.nih.gov/pubmed/7151796.
Size
The color from red to blue reflects the size of amino acid, with red representing smaller side-chains while blue represents larger side-chains.

Downloading the Alignment
The Download menu on the toolbar provides options to download a "FASTA alignment" and export a "Printer-Friendly PDF/SVG" image.
The PDF or SVG downloaded image file is compatible with third-party image editors such as Adobe or InkScape. Note that the Panorama is not included in the image. By default, the range will include the viewed range, but the range can be adjusted in the download dialog. Please refer to this page for more information about downloading images from the NCBI graphical viewers.
If there are hidden rows, they will not be included in the FASTA alignment or image downloads.

Table of Contents
- Multiple Sequence Alignment Viewer application
- Documentation home
- General
- Help
- Demo Pages
- Related Resources