

NCBI Graphical Sequence Viewer Embedding API
Sequence Viewer Revision: 3.30 and newer
Contents
- Introduction
- Including Sequence Viewer on a web page
- Including Sequence Viewer in an iFrame
- Sequence Viewer parameters
- Appendix A: Tracks Parameters
- ‘tracks’ parameter syntax
- Appendix B: Feature Subtype Storage Keys 23
- Appendix C: Objects/Features tooltips preprocessing
Introduction
The NCBI Graphical Sequence Viewer (SV) is a general purpose tool for viewing biological sequence data. It can be embedded in a wide variety of web pages and with a large number of options. This document serves as a launching point to understand how to embed the Sequence Viewer in any context. For purposes of standardization in this document, all links presented include the common refrain http://www.ncbi.nlm.nih.gov .
If you have questions or need help, please contact us.
Additional documentation can be found at http://www.ncbi.nlm.nih.gov/tools/sviewer/.
A tutorial with examples is available here and you can get a list of URL parameters here.
Including Sequence Viewer on a web page
The Sequence Viewer is implemented using an ExtJS JavaScript library.
-
There is no need to declare or load ExtJS css files or js scripts. SV dynamically loads everything it needs from the www.ncbi.nlm.nih.com website. On the other hand if ExtJS scripts are declared/loaded before sviewer.js declaration, SV omits their loading to allow an embedding application to use a specific edition of the library. The following example demonstrate how to declare SV script:
<script type=”text/javascript” src=”http://www.ncbi.nlm.nih.gov/projects/sviewer/js/sviewer.js”></script>
-
If an embedding application does not create SV instances dynamically the following inlining of Sequence Viewer script (includes id="autoload”) allows the SV application to find appropriate SeqViewerApp declarations and create instances automatically (with data loading):
<script type=”text/javascript” src=”http://www.ncbi.nlm.nih.gov/projects/sviewer/js/sviewer.js” id="autoload”></script>
SeqViewerApp must be declared as <div> tag with class='SeqViewerApp' and one <a> tag where href attribute containing SViewer parameters. An example is:
<div id='some-id' class='SeqViewerApp'> <a href='?embedded=true&id=…'><a> </div>
You do not use this method if the Sequence Viewer div is initially hidden. Use the method from point 3 to instantiate Sequence Viewer dynamically.
-
If an embedding application needs to create SV instances dynamically the following example demonstrates how to declare them and initiate SV instances creation and loading manually (SV script declaration from point 3):
<div id=’sv1’></div> ... <script type='text/javascript'> SeqViewOnReady(function() { var app = new SeqView.App(‘sv1’); app.load(‘embedded=true&id=…’); } ); </script>
In this case the application may not use class name (or any) for the div.
-
Function SeqViewOnReady(callback, [scope]) is designed to prevent SV usage before SeqView class is initialized.
Parameters:
callback - user callback function scope - callback function scope (if necessary)
For a video tutorial please watch the following video:
 Embed the NCBI Sequence Viewer into Your Pages
Including Sequence Viewer in an iFrame
How to obtain code of the Sequence Viewer for embedding
The suggested workflow is:
- Pick a molecule of interest, which illustrates the case. Use GDV or enter your accession at: https://www.ncbi.nlm.nih.gov/projects/sviewer/
- Find and zoom to the region of interest (it could be a gene or a specific mutation).
- Add markers (if desired) to annotate your region.
- Pick tracks of interest using the track configuration panel
- Change track display options if desired.
- Use the “Link to This View” option to show code.
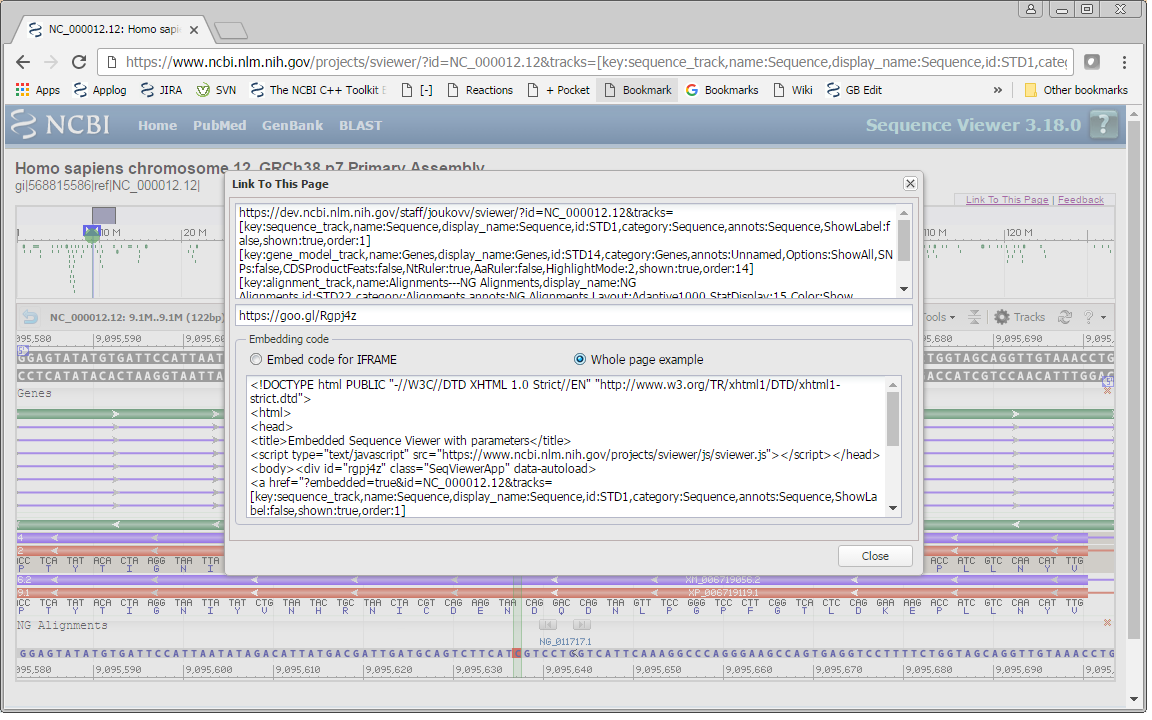
The resulting code will contain parameters that capture the sequence molecule, location, and track and marker configuration of your view.
There are two types of embedding code. The first option, ‘Embed code for IFRAME’, can be used as is to embed the Sequence Viewer by itself as an IFRAME. The second option,‘Whole page example,’ can be used to embed the Sequence Viewer as a part of your page. This option has both the script in the HEAD element and DIV element with parameters.
How to include Sequence Viewer in a web page in an <iframe>
The NCBI Sequence Viewer can be embedded as an IFRAME. When configured, Sequence Viewer will automatically resize the enclosing iframe vertically to avoid scroll bars.
To use iframe embedding, add this to your page:
<iframe id="sviframe" src="/projects/sviewer/embedded_iframe.html?iframe=sviframe&id=nt_011515" width="900">
Please note :
- iframe id can be arbitrary, and it should be passed to the source URL as parameter 'iframe' (“sviframe” in the example above)
- iframe content page (“/projects/sviewer/embedded_iframe.html” in the example) should belong to the same domain as the main page (take the page and save it on your server)
- iframe should satisfy the minimal width requirement of 800 pixels to accommodate the pop-up interface elements of the Sequence Viewer
There can be issues using multiple libraries that reset style sheets. If you have any issues with the style sheets used in ExtJS/Sequence Viewer, i.e. Sequence Viewer doesn’t look right, try adding this directive:
<link rel="stylesheet" type="text/css" href="http://www.ncbi.nlm.nih.gov/projects/sviewer/css/sv-cleanup.css">
Sequence Viewer parameters
Parameters may be passed to Sequence Viewer by putting them in the included <a href=''> link tag within the Sequence Viewer <div> tag.
Base parameters:
The color used for highlighting can be changed per track using the track specific highlights_color parameter.
- embedded={false, true, minimal, panorama} – removes some components that are not needed in embedded mode (panorama view, some links) if 'minimal' value is passed then only a bare-bone image is shown with buttons-only tool bar and without panel header. If ‘panorama’ is passed then only the top panel, the Overview panel, is shown. Default is false. This is a required parameter for an embedded version of SV.
- id=<string> - GI of a sequence to show. Required parameter.1,2,3
- noviewheader={true,false} – removes header from a sequence view. This parameter only relevant when embedded=true. Default is false. Optional parameter.
- v=<view ranges> - sets a specified visible range to a graphical panel. If not specified the whole sequence is shown. (Example: v=1000:6000,100k:2m, 100K-2M, 100k..2M). Optional parameter.
-
mk=<position or range>|<marker name>|<color in RGB hex> Use the mk parameter to set a marker at a position or on a range of positions. Multiple markers can be set by separating the each entry with a comma. Use an exclamation point ("!") after an entry to lock the marker. A locked marker is fixed in the graphical view. The name and color parameters are optional . Examples:
mk=1000 puts an unlocked marker with default color and name at position 1000 mk=1000:2000 puts an unlocked marker with default color and name on the range 1000-2000 mk=1000:2000|TestMarker puts an unlocked marker with default color and the name "TestMarker" on the range 1000-2000 mk=1000:2000|TestMarker|00ff00 puts an unlocked marker with color 0x00ff00 and the name "TestMarker" on the range 1000-2000 mk=1000:2000|TestMarker|00ff00,3000:4000|TestMarker2|80ff10 puts an unlocked marker with color 0x00ff00 and the name "TestMarker" on the range 1000-2000 and another unlocked marker with color 0x80ff10 and the name "TestMarker2" on the range 3000-4000. mk=1000:2000|TestMarker|00ff00,3000:4000|TestMarker2|80ff10! - same as above with a lock on "TestMarker2". Note: Special characters in marker names must be escaped properly usually with a \ prepended.
-
toolbar = <nspztcrhgmd> Specifies which options are present on the toolbar. This parameter is optional and if omitted, all options are shown. If any options are specified, all other options must be opted in.
- n - Name button
- s – Search field
- p - Panning buttons
- z - Zoom slider & buttons
- t - Tools menu
- c - Configure menu
- r - Reload button
- h - Help button
- g - Gene render mode button (switches on "Show All" mode for gene tracks features)
- m - Switch mode (Slim/Normal) button
- d - Download menu
-
origin=<sequence position> - Set the sequence origin. Optional parameter. (Example: origin=5000)
- flip=true - Flips the strand. Default is false. (Example: flip=true or flip=false) . Optional parameter.
- strand=true - Synonym for flip parameter. Optional parameter
- assm_context=GC Assembly accession – Defines the assembly accession used for retrieving track configuration for a given application context from track manager service. Optional parameter. It is required only when using SViewer inside a genome browser that uses track manager service to manager data tracks.
- app_context=Unique and preregistered genome browser application name – It differs from ‘appname’ below. ‘app_context’ is preregistered in track manager service. A combination of ‘app_context’ and ‘assm_context’ define a set of data tracks to be shown in the given application context. Optional parameter. It is required only when using SViewer inside a genome browser that uses track manager service to manager data tracks.
-
appname=<string> - Defines the name of the client calling the application. This is an optional parameter used in storing a user’s configuration settings; we recommend that all developers supply an application name. The name chosen should be unique; this name will appear in a cookie set in the user’s browser to indicate storage of configuration information. We strongly recommend that callers avoid using generic phrases like “gene” or “viewer”, and prepend a namespace (i.e., “NcbiPortalGene” or “XYZViewer”). If there are questions about what name to use, please contact the sequence viewer team. (sviewer-service AT ncbi.nlm.nih.gov) Example:
<div id="SeqViewer0" class="SeqViewerApp"> <a href="?id=89161185&embedded=true&appname=testemb&v=1:247249719 &tracks=[key:graph_track,annots:NA0000016.1|]"></a> </div>
-
multipanel={true, false} – permits or prohibits the use of multiple graphical panels in one Sequence Viewer instance. If not specified, it is default to 'true' in standalone mode and to 'false' in embedded mode.
- slim=<true> - Constitutes the set of initial modes for graphical panels. Slim Mode displays tracks without title bars. Default is false. This is an optional parameter. (Example:slim=true, false, true or slim=1,0,1)
- a. nopdf= {true, false} - Disables PDF printing option. Default is false. (Example: nopdf=true or nopdf=false). This is an optional parameter.
b. notrdata=true - Removes option Download Track Data from Download menu. Default is false. - nosavetracks - Disables menu item "Save current tracks" in "My NCBI Track Collections" menu.
-
highlights_color=
is optional. When specified, it defines the color to be used for highlights in all tracks. Accepted formats: - A named color, such as "red", "blue", "salmon", etc. Supports HTML color names
- HTML-format colors, such as "#f0f0dd", or "f0f0dd". These are accepted with or without the leading '#'. The color used for highlighting can also be changed per track using the track specific highlights_color parameter.
Sample URL parameters: id=NC_000005.10&minheight=220&client=seqviewer&width=3999&view_width=970&from=68710561&len=1485030&assm_context= GCF_000001405.33&label=Default&color=Color&decor=Default&spacing=Normal&content=Details&tracks=[key:gene_model_track,name:Genes,display_name:Track1,id:STD14,category:Genes,annots:Unnamed,Options: MergeAll,SNPs:false,CDSProductFeats:false,highlights:GeneID\:5884, highlights_color:red , ShowLabelsForAllFeatures:false,NtRuler:true,AaRuler:false]key:gene_model_track,name:T577824,display_name: Track2,id:T577824,category:Genes,subcategory:NCBI,dbname:SADB,annots:NA000077605.1,highlights: GeneID\:100506658,Options:MergeAll,SNPs:false,CDSProductFeats:false,ShowLabelsForAllFeatures:false, NtRuler:true,AaRuler:false]& highlights_color=blue In the sample above the global highlights_color parameter changes the highlighting color for all tracks to blue, the track specific highlights_color parameter overrides the color for the first track to red:
Advanced parameters:
- rid=<rid> - Option to load BLAST results stored as an RID. Optional parameter .4,5
- tracks=[<track1_descr>,<track2_descr>] - Specify tracks that should be rendered. Optional parameter. See Appendix A for examples.
Events sent by SV instance:
An application that uses SV can subscribe to events that SV will send in case of a user interaction with SV. Here is the list of supported events:
'panorama_image_loaded' - fired when panorama image is loaded to application ' 'graphical_image_loaded' - fired when graphical image is loaded to view 'marker_created' - fired when marker is created in view 'marker_deleted' - fired when marker is deleted in view 'feature_clicked' - fired when feature is clicked in view 'origin_changed' - fired when origin is changed for application 'strand_changed' - fired when strand is changed 'visible_range_changed' - fired when visible range is changed (for example, zoom or shift) 'configuration_changed' - fired when configuration is changed (for example, tracks are added)
The subscription object for any events is SViewer application (object SeqView.App). Every event has a reference to its source provided. Events related to particular view are provided with view object, others are provided with application object. Here is an example of use:
function initSviewerApp(sviewer){ sviewer.on({ 'visible_range_changed': function(view) { // event processing }, 'graphical_image_loaded': function(view) { // event processing }); }
Also SViewer application provides some number of access functions.
getApps() - returns the list of all applications on the current HTML page getTracks() - provides loaded tracks for particular application getConfiguration() - provides the configuration object for particular application
Example:
var app = SeqView.App.findAppByDivId(‘YOUR_SV_DIV_ID’); app.on({ visible_range_changed: function(view) { console.log(view.m_VisFromSeq + ' - ' + view.m_VisLenSeq); }, marker_created: function(marker) { … }, marker_deleted: function(marker) { … }, graphical_image_loaded: function(view) { … }, feature_clicked: function(view, feat) { … }, scope: this });
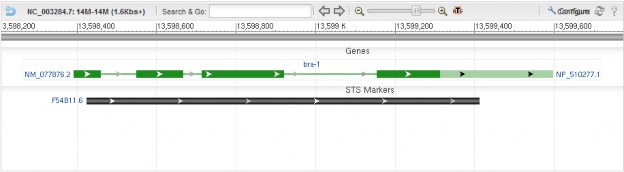
Examples:
<div style="padding:10px;"> <div id="sv1" class="SeqViewerApp" > <a href="?embedded=true&id=NC_003284&from=13598210&to=13599776"> </a> </div> </div>
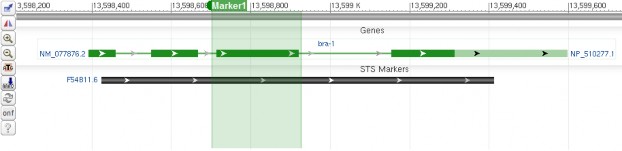
<div style="padding:10px;"> <div id="sv1" class="SeqViewerApp" > <a href= "?embedded=minimal&id=NC_003284&from=13598210&to=13599776&mk=13598700:13598925|Marker1|008000"></a> </div> </div>
Example web pages:
- Embedding Sequence Viewer into a standalone web page. http://www.ncbi.nlm.nih.gov/projects/sviewer/embedded.html
- Embedding Sequence Viewer and collecting its events. The example includes controlled SeqView.App launch (via SeqViewOnReady function): http://www.ncbi.nlm.nih.gov/projects/sviewer/event_demo.html
Cross-domain embedding
Previously we recommended to set up redirecting scripts on the embedder's site. Now, as we support Internet standard CORS it is no longer needed.
Web tracks upload/embedding
There is a new ability allowing to add multiple user data items and assign them names through parameters to Sequence Viewer.
Before this only one item of each type (URL, Blast RID, or inline ASN.1 text) could be used, and track names were assigned automatically based on the data itself.
New parameter, 'tn' (short for Track Name) is introduced for this purpose. This parameter can be present several times and corresponds to the data item (url, rid, or data parameter) in the order of occurrence. E.g., if you have an RID and data file and would like to display them and assign these track names, the following syntax should be used:
The same syntax works for embedding Sequence Viewer in your own pages:
<div id="some-id" <class="SeqViewerApp"> <a href="?embedded=true&id=NC_000001.10&url=https://ftp.ncbi.nlm.nih.gov/toolbox/gbench/samples/UCSCGenes_exon20.short.bed&url=https://ftp.ncbi.nlm.nih.gov/toolbox/gbench/samples/UCSCGenes_exon20.bed&tn=Some%20USCS%20genes&tn=Some%20other%20genes&v=660932:2480277"></a> </div>
The files used for 'url' parameter should be accessible through public HTTP or FTP.
If you'd like to name only the second data item, you ought to include empty track name parameter for the first item:
Same thing can be done with other data types, such as Blast RID:
Unfortunately, the Blast RID is valid for only a short time. To obtain a more permanent view for your data, we recommend exporting the data as an alignment file (ASN or BAM).
Sequence Viewer now supports two parameters with the same syntax but different behavior: url and url_reload
Parameter url uploads the target file once and uses it for visualization. If underlying data changes you have to change the file name as well, otherwise Sequence Viewer will keep showing the old data (until some potentially long timeout period expires). You file name naming scheme may need some versioning.
Parameter url_reload always tries to re-upload the file to check the content, which can introduce a processing delay. If you use this parameter you don't have to create a file name versioning but this mode will be slower as it needs to download the file every time.
SRA tracks embedding
An SRA track can be referenced in three different ways, by either using an SRR accession (e.g. SRR505885), or a NCBI Internal file path (e.g. /netmnt/traces04/sra2/SRR/001282/SRR1313308), or a URL (e.g. http://ftp-trace.ncbi.nlm.nih.gov/sra/sra-instant/reads/ByRun/sra/SRR/SRR131/SRR1313308/SRR1313308.sra).
The Sequence viewer accepts a comma-delimited list of SRR accessions in a srz parameter. A comma-delimited list of file paths and/or URLs is accepted in bam_path parameter (despite its name, this parameter accepts both BAM and SRA formatted files).
For defining SRA tracks via the "tracks" parameter, two of its settings are used: "dbname" and "annots". "dbname" must be set to "SRA" if an SRR accession is going to be used and to "cSRA" for file paths or URLs (SRA or BAM formatted). "annots" holds a SRR accession or file path/URL (please note that all colons including the one in "http://" prefix must be escaped with a backslash).
srz - sets the SRR (SR Run) to use as a datasource for a track, expands to proper track description, e.g. srz=ERR276220 expands into tracks=[key:alignment_track,name:ERR276220,display_name:ERR276220,dbname:SRA,category:Alignments,setting_group:cSRA,annots:ERR276220]
bam_path - BAM file's url or path (NCBI Internal) to BAM file
Examples
Explicit srz parameter for SRR
Same SRR expressed as track with dbname = SRA
Explicit bam_path for external BAM file
Same BAM file expressed as track with dbname = cSRA
seqgraphic.cgi call with dbname=SRA
seqgraphic.cgi call with dbname=cSRA
Alignment tracks from AlignDb
To use internal NCBI AlignDb as data source for alignment track following parameters are required:
key:alignment_track - to specify the track type as alignment,
annots:AlignDb - to specify the data source - AlignDb. Capitalization is important and should be exactly as in this example,
batch - batch number to get the data from.
Example
Assembly to assembly alignment
Remote (HTTP-based) BAM files
The HTTP and HTTPS protocols are supported for all remote file types. Note: BAM files hosted on the FTP protocol are not supported. To request streaming support for additional file types (e.g. tabixVCF), click the "Support Center" link located at the lower right of the Sequence Viewer page.
Minimal set of parameters to display a BAM alignment track:
| key | values |
|---|---|
| key | alignment_track |
| dbname | cSRA |
| annots | path to the remote BAM file (index files is expected to reside at the same path) |
Optional parameters:
| Key | Value | Description |
|---|---|---|
| layout | Adaptive (default)|Packed|Full | Adaptive - let sviewer decide when to switch between coverage graph, pileup graph and reads Packed - show only coverage or pileup graphs Full - Show reads as lons many reads as possible |
| display_name | string | Use defined track name |
| ShowAlnStat | false (default)|true | Set to always show read's pileup graph |
| GraphHeight | number | Graph's height |
Examples
Rattus norvegicus strain mixed chromosome 1, Rnor_6.0
Homo sapiens chromosome X, GRCh38.p7 Primary Assembly
Remote (HTTP-hosted) BAM files visualization demo
BigBED and BigWIG files
The FTP protocol is supported for bigBED and bigWIG files.
Embedding for BigBED and BigWIG tracks is done the same way as with any other files. User needs to specify corresponding dbname and annots parameters:
| Key | Value | Description |
|---|---|---|
| dbname | BigWig|BigBed | bigWig or bigBed for corresponding type of data |
| annot | string | Location of the file on the web, http or ftp protocol |
Examples
annots usage example: http\://hgdownload.soe.ucsc.edu/hubs/gtexAnalysis/hg38/gtexAwgAseDensity.bw
Appendix A: Tracks Parameters
The ‘tracks’ parameters are for advanced developers.
‘Tracks’ parameter syntax:
The ‘tracks’ parameter is used to configure track content, track order, and track display in the rendered image. The track display includes track rendering options and other track-specific settings. The syntax for “tracks” parameter is:
tracks=[track1 ][track2][…]
- The settings for one track are grouped together using a pair of square brackets ‘[‘ and ‘]’.
- The order of tracks in the list determines the final track order in the rendered image.
There can be a special track definition in tracks parameter (must be the first track) - [amend]. If present, track definitions in the URL will be merged with discovered/TMS tracks. If absent, only tracks in the URL will be shown. Compare predefined default tracks, the track given in the URL, and both predefined and URL tracks.
The format of settings for each track grouped in one pair of ‘[‘ and ‘]’ is:
key :track_key [, subkey :feature_subtype] [, name :track_name] [, display_name :track_title] [, annots :annot1[|annot2]] [, shown :true/false] [, comments :comment1|loc1[|comment2|loc2]] [, highlights :label1|...|[labelN]|[GeneID\:id1]|...|[GeneID\:idM]] [, highlights_color :color] [, filter :A>aaa and B<bbb and (C eq ccc or D<=ddd)] [, sort_by :sorting criteria] [, track_setting_key :value]* *HighlightMode:value] [, The track settings consist of a set of key:value pairs. Any unmatched pair (only key or value) will be ignored. A key:value pair is formed using ‘:’, and multiple key:value pairs are separated by ‘,’.
[ Note ] Since these five special characters ([],|:) are used as delimiters in ‘tracks’ parameter, if any of the five special characters are used in user-provided name, title or comment, they have to be escaped using a backslash (‘\’).
-
key is required. It is one of the predefined track type keys. The same key can be used in multiple track instances. Track keys are case-sensitive. The existing track keys are:
- sequence_track
- six_frames_translation
- SNP_track
- HapMapRR_track
- SNP_Bins_track
- segment_map_track
- graph_track
- graph_overlay
- gene_model_track
- alignment_track
- feature_track
- dbvar_track
- user_data_track
- trace_track
-
subkey is required only when key is a feature_track. It is the storage key for a given feature subtype, such as STS, repeat_region, misc_feature and Protein. For a complete list of feature subtype storage keys, please refer to Appendix A.
- name is optional. However, if two or more track instances use the same track key (and subkey combination), then track name (any unique arbitrary track name) is necessary to uniquely represent a track instance.
- display_name is optional. It is used for display purpose, such as track title in the rendered image and track name in track configurator. If display_name is not provided, a default display name will be generated based on information retrieved from data. The defined order of precedence is annotation title, annotation name, and file name for uploaded data.
- annots is optional. It lists all the annotations needed to be shown in the given track type. If there is more than one annotation, the annotations are separated using '|'. If it is absent, all annotations related to the track type will be loaded. The order of annotations in the list determines the subtrack (each for one annotation) order in the rendered image. If the annotation is unnamed, then the annotation name should be “Unnamed”.
-
comments is optional. Comments are used for highlighting one or more specific locations in a track. A comment has to come with a pair of comment text and location separated using ‘|’, such as comments:comment1|position1. The sequence location is an integer. ‘,’ separated locations are not acceptable. Multiple comments are supported that are also separated using ‘|’, such as comments:comment1|pos1| comment2|pos2. Figure 2 shows an example with multiple comments specified.
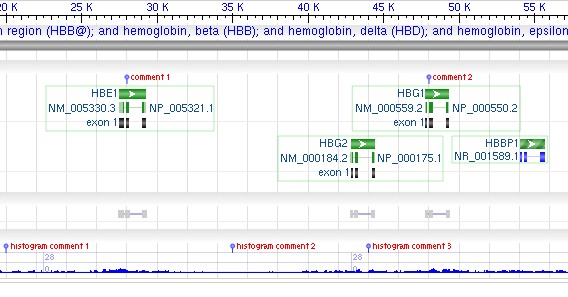 Figure 2. Example screenshots for ‘tracks’ parameter with ‘comments’ specified. The ‘tracks’ parameter used in the example is:
tracks=[key:gene_model_track,comments:comment 1|28000|comment 2|48000] [key:feature_track,subkey:STS,comments:histogram comment 1|20000|histogram comment 2|35000|histogram comment 3|44000]
-
highlights is optional and not all track types support this setting. When specified, it highlights one or more objects:
- represented using the exactly same labels as the ones shown on screen (case-insensitive)
- gene(s), having the GeneID(s), listed in the highlights parameter
If multiple objects need to be highlighted their labels and/or GeneIDs should be separated using '|', such as highlights:label1|label2. The colon after the GeneID identifier needs to be prefixed with '\', such as highlights:GeneID\:100506658. The highlighted objects will be promoted to the top row in the corresponding track to make it more prominent, will be rendered as the normal size even in zoomed-out mode that other objects are shown in a reduced size, and will be shown with label enabled if the label fits.
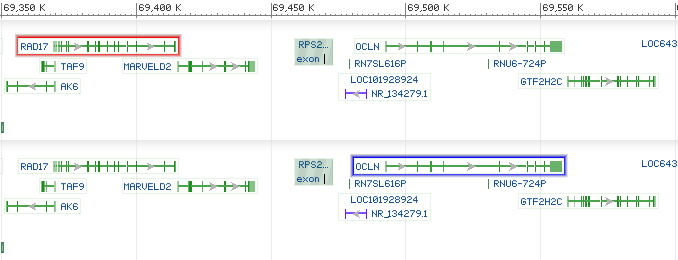
The currently supported tracks types include: gene_model_track, feature_track, dbvar_track, and segment_map_track. Figure 3 shows an example with multiple highlighted objects specified:
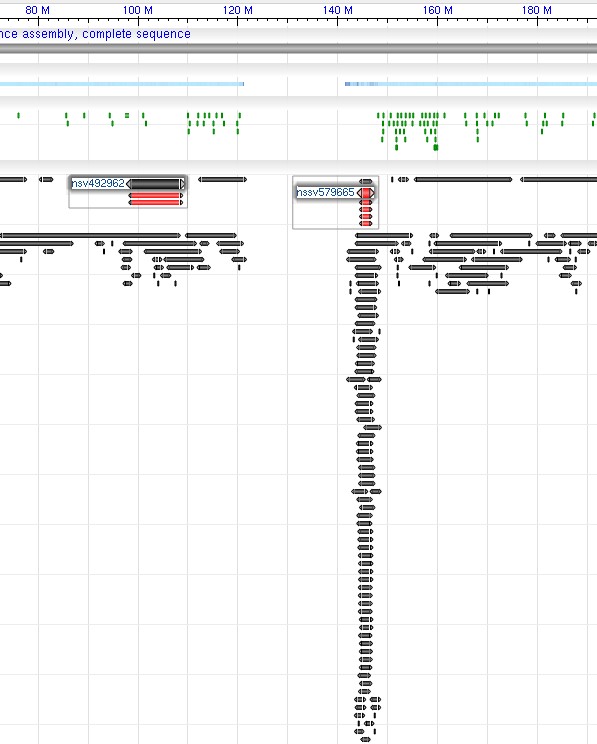 Figure 3. Example screenshots for ‘tracks’ parameter with ‘highlighs’ specified. The ‘tracks’ parameter used in the example is:
tracks=[key:sequence_track] [key:SNP_track] [key:gene_model_track,annots:Unnamed][key:dbvar_track,name:dbvar_track1,annots:NA000001999.1,Rendering:Default,highlights:nsv492962|nssv579665]
-
highlights_color is optional. When specified, it defines the color to be used for highlights in the curent track. Accepted formats:
- A named color, such as "red", "blue", "salmon", etc. Supports HTML color names
- HTML-format colors, such as "#f0f0dd", or "f0f0dd". These are accepted with or without the leading '#'. The color used for highlighting can be changed for all tracks using the global highlights_color parameter.
- filter is optional and not all track types support this setting. When specified, it only shows the objects that get passed through the filter. The filter string is similar to many other query languages. For example, if A, B, C, D and E are identifiers, it is ok to have A > aaa and B < bbb and (C eq ccc or D >=ddd) or E between 2 and 10. Currently, the supported operators include: and, or, xor, sub, not, like, between, in, eq, >, <, >=, and <=.
- sort_by is optional and not all track types support this setting. When specified, it sorts the objects into several sub-tracks/sub-groups according to a predefined sorting criteria within a given track.
-
track_setting_key :value pairs are track-specific. The currently exposed track-specific settings include:
key: six_frames_translation
key_name value comment ShowOption Default: All Forward Show forward direction translations (+1, +2, +3) Reverse Show reverse direction translations (-1, -2, -3) LTR Show translations from left to right (sense strand) regardless of sequence orientation All Show all six-frame translations Orfthreshold Default: 20 0 Highlight all ORFs 20 Highlight ORFs equal or longer than 20 codons 100 Highlight ORFs equal or longer than 100 codons 250 Highlight ORFs equal or longer than 250 codons 100000000 Do not highlight ORFs HighlightCodons
Default: truetrue Highligh start and stop codons false Don’t highligh start and stop codons key:alignment_track
key_name value comment Color
Default: Show DifferencesColumn Quality score
– DNADNA: Score residues based on how well a particular residue agrees with the others in a column. Frequency-Based Difference DNA/Protein: Score residues based on their frequency in the column Show Differences DNA/Protein: Score residues based on match/mismatch to a master/anchor row Nucleic Acid Colors DNA: Assign color based on residue (A - Red, G - Blue, C - Yellow, T - Green) Column Quality score - Protein Protein: Score residues based on how well a particular residue agrees with the others in a column. Rasmol Amino Acid Colors Protein: Used by the application RasMol to group amino acids with similar properties Shapely Amino Acid Colors Protein: Used by the application RasMol to group amino acids with similar shapes using a standard color table BLOSUM45 Protein: Matrix made by matblas from blosum45.iij BLOSUM Clustered Scoring Matrix in 1/3 Bit Units BLOSUM62 Protein: Matrix made by matblas from blosum62.iij BLOSUM Clustered Scoring Matrix in 1/2 Bit Units BLOSUM80 Protein: Matrix made by matblas from blosum80.iij BLOSUM Clustered Scoring Matrix in 1/2 Bit Units Protein Quality Scoring with Coloring Protein: Color residues where the quality scoring is above (or below) a given threshold Hydropathy Scale Protein: Side chain hydropathy, corrected for solvation Membrane preference Protein: Membrane-buried preference parameters Signal sequence Protein: Signal sequence helical potential Size Protein: Amino acid size false Disable alignment score coloration AlignedSeqFeats
Default: falsetrue Show features projected from the aligned sequences false Don’t show features projected from the aligned sequences Label
Default: truetrue Show labels for alignments false Hide labels for alignments ShowAligns
Default: truetrue Show alignments always false Hide alignments when alignment statistics are shown ShowSecondPass
Default: truetrue Show second-pass aligments false Hide second-pass aligments Layout Default:
Adaptive1000Adaptive200 Show the individual alignments if less than 200 alignments. Otherwise smear the alignments. Adaptive1000 Show the individual alignments if less than 1000 alignments. Otherwise smear the alignments. Adaptive5000 Show the individual alignments if less than 5000 alignments. Otherwise smear the alignments. Adaptive20000 Show the individual alignments if less than 20000 alignments. Otherwise smear the alignments. Adaptive100000 Show the individual alignments if less than 100000 alignments. Otherwise smear the alignments. Adaptive250000 Show the individual alignments if less than 250000 alignments. Otherwise smear the alignments. Expanded by position Show one alignment per row sorted by alignments' start location Smear Smear all alignments into a smear bar StatDisplay
Default: -1-1 Don't show alignment statistics 8 Show A, T, G, C, and gaps percentage as table 9 Show A, T, G, C, and gaps percentage as bar graph 10 Show A, T, G, C, and gaps count as table 11 Show A, T, G, C, and gaps count as bar graph 12 Show matches, mismatches, and gaps percentage as table 13 Show matches, mismatches, and gaps percentage as bar graph 14 Show matches, mismatches, and gaps count as table 15 Show matches, mismatches, and gaps count as bar graph UnalignedTailsMode
Default:glyphglyph Show length of unaligned tails hide Hide tails sequence Show sequence of unaligned tails Sort_by
Default:strand Alignment strand haplotype Haplotype (if available) reciprocity Reciprocity score (if available) GraphHeight Numeric value This parameter is applicable to coverage or pile-up graph of BAM/CSRA alignments GraphColor Color name or HTML color code This parameter is applicable to coverage or pile-up graph of BAM/CSRA alignments key:gene_model_track
key_name values comment Options
Default:MergePairsGeneOnly Only the 'green' gene bar is shown MergeAll Merge all transcripts and CDSs into a single line, no gene bar shown. MergePairs Merge the display of the transcript and its coding region as appropritate. Coding reginos are represented by different color. No gene bar is shown. ShowAllButGenes Show all transcripts and CDSs separately but with no gene bar. ShowAll Show all transcripts and CDSs separately with gene bar. SingleLine No gene bar, but merge exon/CDS features and only show on a single line. HideNonCoding
Default: falsetrue Show only transcripts or gene loci with associated CDS false Show both coding and non-coding features HideModels
Default: falsetrue Do not show predicted RefSeq models from Gnomon false Show model and curated RefSeq variants CCDSOnly
Default: falsetrue Show only CCDS variants false Show CCDS and non-CCDS variants SelectOnly
Default: falsetrue Show only RefSeq Select or MANE Select variants false Do not limit to RefSeq Select or MANE Select variants SNPs
Default: falsetrue Show SNP features projected from RNA and coding region features false Don’t show SNP features projected from RNA and coding region features CDSProductFeats
Default: falsetrue Show product features projected from protein sequence false Don’t show product features projected from protein sequence ShowLabelsForAllFe atures
Default: falsetrue For top labeling, show labels for all features inside one gene model. This affects the top label mode only. false For top labeling, show labels for the first gene, RNA and coding region only in one gene model. This affects the top label mode only. key:SNP_track
key_name value comment Layout
Default: AdaptiveAdaptive Show labels if less than 15 variants; Show density bar if greater than 50 variants Density Always show the density bar of variants Features Show all variants rendered individually Labels Always show the labels of variants key:feature_track
key_name value comment Layout
Default: AdaptivePacked Track is displayed, with all features collapsed on a single line. Adaptive show the individual features if less than 50 features. Otherwise, show histogram. Layered Always show the individual features and layer the features in a compact form LinkedFeat
Default:PackedDefault All features, both parent and all child features Packed Show parent on one line and all children merged below it. ParentHidden Show only the children, not parent Hidden Show the parent features, not the children OnParent Render all child features on the parent feature Sort_by Supported sort_by includes: concordancy, apply to clone features only sort_reads
Default: falsefalse do not sort intron features track by number of spliced reads true sort intron features track by number of spliced reads, with features with most spliced reads at the top sort_strands
Default: falsefalse do not sort intron features track by strand true features on the forward strand are sorted separately from features on the reverse strand read_range, intron features track only min|max
Default: inf|infmin - number or 'inf'=0, Minimum threshold, the values below this threshold will be hidden from view
max - number or 'inf'=infinity, Maximum threshold, the values above this threshold will be hidden from view
key:aggregate_feature_track
key_name value comment subkey biological_region Shows the following set of features:
- miscellaneous features
- recombination features
- sequence secondary structures
- mobile genetic elements
- protein binding sites
- origin of replications
- repeat regions
- stem loops
- regulatory features
aggregate_features A track combining all possible features The aggregate_feature_track supports all parameters, supported by the feature track.
key:dbvar_track
key_name value comment Rendering
Default: PackedDefault All features, both parent and all child features Packed Show parent on one line and all children merged below it. ParentHidden Show only the supporting variants (children) not the variant region (parent) Hidden Show the variant region (parent) not the supporting variants (children)", SingleLine Track is displayed, with all features collapsed on a single line. Histogram Track is displayed, with all features displayed as a histogram. Filter Supported filters include: variant_quality=low/high, pilot=1/2, len=size, clinical_assertion= likely_unknown/benign/likely_benign/pathogenic/likely_pathogenic/not_tested/oth er,sampleset_type=case/control Sort_by Supported sort_by: - Variant_quality
- pilot
- clinical_assertion
- sampleset_type
- validation_status
key:graph_track
key_name value comment color It can be color name such as 'red', 'dark blue', or RGB color such as '255 0 0', or HTML color code such as '#FF0000'
Default: blueneg_color Color for negative values
Default: deep redheight Graph height in pixels. Default value is 30 pixels for histogram and line graph, and 10 pixels for smear bar style Graph rendering styles: - histogram
- line graph
- smear bar
Default: histogramnum bins Integer from 2 to 10 Smear bar is a heat map of data values from min value colored as light blue to the max value colored as dark blue.
The coloring can be controlled by num_bins parameter. Num_bins parameter allows to partition the data into the number of equal binsscale What scale to use: - linear
- log 2
- log 10
- loge
Default: linearstored_scale Scale of stored data: - linear
- log2
- log10
- loge
ocolor Color to use for outliers
Default: reduid User ID. Any alphanumeric value that uniquely identifies the track.
Default: noneopacity Color opacity in a percentage value (100 completely visible)
Default: 100range min|max|auto min - real number or 'inf', Minimum threshold, the values below this threshold will be clipped
max - real number or 'inf', Maximum threshold, the values above this threshold will be clipped
auto - optional flag indicating that value range should be calculated automaticallykey:graph_overlay
The graph_overlay key allows multiple graph tracks with the same data dimensions to be overlaid in a single track. The tracks to overlay are indicated by the ‘subtracks’ parameter.
key_name value comment subtracks List of tracks to be included in graph overlay. The values represent track_ids - strings separated by ‘|’. For example: track1| track2| track3. Track_ids are references to the other tracks and can be either annot name, id parameter or uid parameter.
Default: PackedBG Background color. It can be color name such as 'red', 'dark blue', or RGB such as '255,0,0', or HTML color code as '#FF0000'
Default: whiteheight Graph height in pixels
Default: 30scale What scale to use - linear
- log2
- log10
- loge
Default: linearstored_scale Scale of stored data - linear
- log2
- log10
- loge
Default: linearocolor Color to use for outliners
Default: redrange min|max|auto min - real number or 'inf', Minimum threshold, the values below this threshold will be clipped
max - real number or 'inf', Maximum threshold, the values above this threshold will be clipped
auto - optional flag indicating that value range should be calculated automaticallyIn the example above graph overlay track [key:graph_overlay,subtracks:NA000011424.1|NA000011426.1|NA000011432.1,height:120,display_name:overlay example] refers to three subtracks by their annot names.
Alternatively, each track can be assigned a user id (uid) and the graph overlay can refer to uid instead [key:graph_overlay,subtracks:tr2|tr1|tr3,height:120,display_name:overlay example] http://www.ncbi.nlm.nih.gov/projects/sviewer/?id=NC_000001.10&v=151955200-151956000&tracks=%5bkey:graph_track,annots:NA000011424.1,uid:tr1,opacity:50,color:navy,shown:false%5d%5bkey:graph_track,name:aaa,annots:NA000011426.1,uid:tr2,opacity:50,color:tomato,shown:false%5d%5bkey:graph_track,annots:NA000011432.1,uid:tr3,color:deeppink,opacity:50,shown:false%5d%5bkey:graph_overlay,subtracks:tr2|tr1|tr3,height:120,display_name:overlay%20example
key:trace_track
The trace_track key allows to visualize traces data in NCBI Sequence Viewer.
key_name value comment style curve | intensity Trace graph style show_conf_graph true | false Confidence graph visibility height 70 Track height colorA red Trace chromatogram for base A colorC green Trace chromatogram for base C colorG blue Trace chromatogram for base G colorT purple Trace chromatogram for base T colorConfMin dark green Confidence graph's minimum colorConfMax light green Confidence graph's maximum -
HighlightMode - defines how genes will be highlighted in overview mode:
Value Description Sample output 0 Disabled (default) 
1 Highlight the top most important genes 
2 Display the labels of the top most important genes 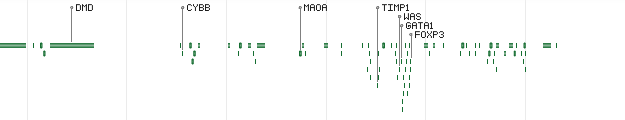
-
label - label position relative to the feature
Values (same as in dialog Tools|Preferences|Label Placement):
- Default
- Top label
- Side label
- No label
An ordinal number (base 0) of the value must be given, not the string.
-
color - greyscale or colored
Values (same as in dialog Tools|Preferences|Coloration):
- Color
- Greyscale
An ordinal number (base 0) of the value must be given, not the string.
-
decor - feature drawing style
Values (same as in dialog Tools|Preferences|Shapes):
- Default
- Arrows
- CircleAnchor
- Fancy
- SquareAnchor
An ordinal number (base 0) of the value must be given, not the string.
-
spacing - sets vertical spacing between the features
Values (same as in dialog Tools|Preferences|Spacing):
- Normal
- Compact
- Oversize
- Overview
An ordinal number (base 0) of the value must be given, not the string.
Key:user_data_track
Unlike other types of track, user_data_track is a track key to represent a user-uploaded data track that is stored in a NetCache key. By default, all user-uploaded data tracks will be added to bottom of the view. If a user wants to change that default track order without knowing the data track details such as real track key and annotation name, he/she can specify a ‘tracks’ string that contains ‘ user_data_track ’ along with a ‘ data_key ’ in a specific track order. The track order for the user data track will be honored just like other tracks. In addition to ‘ data_key ’ parameter, several other generic parameters are also supported which include: shown , category , and subcategory
| key_name | value | comment |
|---|---|---|
| data_key | A NetCache key |
‘tracks’ parameter examples:
-
show sequence track, SNP track, gene model track and alignment tracks “track” parameter:
tracks=[key:sequence_track][key:SNP_track] [key:gene_model_track,annots:Unnamed,Options:ShowAll,SNPs:true] [key:alignment_track]
-
show sequence track, SNP track, gene model track and two dbvar tracks with named annotation accessions “track” parameter:
tracks=[key:sequence_track][key:SNP_track] [key:gene_model_track,annots:Unnamed] [key:dbvar_track,name:dbvar_track1,annots:NA000001999.1|NA000002000.1,Rendering:Default] [key:dbvar_track,dbvar_track2,annots:NA000002001.1,Rendering:SingleLine]
-
show tracks with comments specified “track” parameter:
tracks=[key:gene_model_track,comments:comment%201|28000|comment%202|48000] [key:alignment_track] \ [key:feature_track,subkey:STS,comments:histogram%20comment%201|20000|histogram%20comment%202|35000|histogram%20comment%203|44000]
-
tracks settings with ‘highlights’ specified “track” parameter:
tracks=[key:sequence_track] [key:SNP_track] [key:gene_model_track,annots:Unnamed] [key:dbvar_track,name:dbvar_track1,annots:NA000001999.1,Rendering:Default,highlights:nsv492962|nssv579665]
-
tracks settings with ‘filter’ specified “track” parameter:
tracks=[key:sequence_track] [key:feature_track,subkey:STS,name:all,display_name:All STSs] [key:feature_track,subkey:STS,filter:len between 260 and 650,name:filtered,display_name:filtered STSs]
-
tracks settings with ‘sort_by specified “track” parameter:
tracks=[key:feature_track,name:clone,display_name:Clone%20library\:%20CH242%20Assembly\:%20CCF_000003025.5,subkey:clone,category:Clone,subcategory:CLONES,annots:NA000004255.1,Rendering:Default,sort_by:concordancy]
Appendix B: Feature Subtype Storage Keys
| Index | Subtype Storage Key |
|---|---|
| 1 | Gene |
| 2 | Org |
| 3 | CDS |
| 4 | Prot |
| 5 | PreProtein |
| 6 | Mat-Peptide AA |
| 7 | Sig-Peptide AA |
| 8 | Transit-Peptide AA |
| 9 | precursor_RNA |
| 10 | mRNA |
| 11 | tRNA |
| 12 | rRNA |
| 13 | snRNA |
| 14 | scRNA |
| 15 | sno_RNA |
| 16 | misc_RNA |
| 17 | ncRNA |
| 18 | tmRNA |
| 19 | Pub |
| 20 | Seq |
| 21 | import |
| 22 | allele |
| 23 | attenuator |
| 24 | C_region |
| 25 | CAAT_signal |
| 26 | Imp_CDS |
| 27 | conflict |
| 28 | D-loop |
| 29 | D_segment |
| 30 | enhancer |
| 31 | exon |
| 32 | GC_signal |
| 33 | iDNA |
| 34 | intron |
| 35 | J_segment |
| 36 | LTR |
| 37 | mat_peptide |
| 38 | misc_binding |
| 39 | misc_difference |
| 40 | misc_feature |
| 41 | misc_recomb |
| 42 | misc_RNA |
| 43 | misc_signal |
| 44 | misc_structure |
| 45 | modified_base |
| 46 | mutation |
| 47 | N_region |
| 48 | old_sequence |
| 49 | polyA_signal |
| 50 | polyA_site |
| 51 | precursor_RNA |
| 52 | prim_transcript |
| 53 | primer_bind |
| 54 | promoter |
| 55 | protein_bind |
| 56 | RBS |
| 57 | repeat_region |
| 58 | repeat_unit |
| 59 | rep_origin |
| 60 | S_region |
| 61 | satellite |
| 62 | sig_peptide |
| 63 | source |
| 64 | stem_loop |
| 65 | STS |
| 66 | TATA_signal |
| 67 | terminator |
| 68 | transit_peptide |
| 69 | unsure |
| 70 | V_region |
| 71 | V_segment |
| 72 | variation |
| 73 | virion |
| 74 | 3'clip |
| 75 | 3'UTR |
| 76 | 5'clip |
| 77 | 5'UTR |
| 78 | -10_signal |
| 79 | -35_signal |
| 80 | gap |
| 81 | operon |
| 82 | oriT |
| 83 | site_ref |
| 84 | mobile_element |
| 85 | region |
| 86 | comment |
| 87 | bond |
| 88 | site |
| 89 | rsite |
| 90 | user |
| 91 | txinit |
| 92 | num |
| 93 | psec_str |
| 94 | non_std_residue |
| 95 | het |
| 96 | biosrc |
| 97 | clone |
| 98 | variation |
- http://www.ncbi.nlm.nih.gov/Sitemap/sequenceIDs.html
- http://www.ncbi.nlm.nih.gov/books/NBK1058/
- http://eutils.ncbi.nlm.nih.gov/corehtml/query/static/elink_help.html
- http://blast.ncbi.nlm.nih.gov/Blast.cgi?CMD=Web&PAGE_TYPE=BlastDocs
- http://www.ncbi.nlm.nih.gov/Class/MLACourse/Modules/BLAST/rid.html
Appendix C: Objects/Features tooltips preprocessing
This feature allows to modify links before they are shown in an Objects/Feature tooltip. It is based on an ability to set a callback function for preprocessing an array of objects describing links coming with the tooltip information.
setTooltipPreprocessor(callback) - the callback function receives the following two parameters:
- Array of link objects:
linksList: [{ name: string, type: string, // 'Extra', 'Basic', 'Download' html: string, // may be added by a preprocessor function links: [{ label: string, link: string // url }, ...] },...]
- Some extra information about the feature/object:
obj_info: { acc: string, //sequence id (accession.ver) title: string, // feature/object title start_pos: int, // start position end_pos: int // end position }
If the preprocessing function added html property to a linksList object Sequence Viewer uses it instead of the array links . Removing an object from a linksList removes it from the tooltip.
Example (removes each 3rd link from the list):
var app = SeqView.App.findAppByDivId(‘YOUR\_SV\_DIV\_ID’);
app.setTooltipPreprocessor(function(linksList, obj\_info) {
for (var i = linksList.length - 1; i >= 0; i--) {
if (i % 3 == 0) linksList.splice(i, 1);
}
Table of Contents
- Sequence Viewer application
- Documentation Home
- General
- Help
- Interface
- Tutorials
- Manuals
- Demo pages
- Related Resources