NCBI Bookshelf. A service of the National Library of Medicine, National Institutes of Health.
Slaughter-Acey J, Behrens K, Claussen AM, et al. Social and Structural Determinants of Maternal Morbidity and Mortality: An Evidence Map [Internet]. Rockville (MD): Agency for Healthcare Research and Quality (US); 2023 Dec. (Comparative Effectiveness Review, No. 264.)

Social and Structural Determinants of Maternal Morbidity and Mortality: An Evidence Map [Internet].
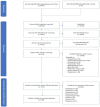
Show detailsOur search identified 8,378 unique publications for screening. Based on inclusion criteria, we identified 118 eligible studies. We list all studies excluded at full text appraisal, by exclusion category, in Appendix B. Exclusions captured under “other reasons” are varied and overlapping, so often not easily placed into a more singular category. For example, an “other reasons” exclude might have been for both study quality and a challenging interpretation on whether the risk factors were interpersonal in nature. See Figure 3.1 for details of the screening process.

Figure 3.1
Literature flow diagram. Abbreviations: n = number
The 118 included studies were published between 2000 and 2022. The studies contained 221 specifically named exposures or factors of interest. While many of these exposures or factors of interest are comparable or overlap, studies used various language and operational definitions for them. Using the named exposures, we categorized the studies into 11 broad exposure domains based on the main social-structural determinant of health. Table 3.1 presents the number of included studies by Key Question and exposure domain. The exposure domains are illustrated by example named exposure or factor of interest. Some studies used data that focused on particular populations, such as Black, Hispanic, or military veterans. As shown in Table 3.1, these populations represent only a subset of the many potential populations of interest.
Table 3.1
Identified eligible studies by major exposure domain.
Table 3.2 presents the number of included studies by Key Qquestion, outcome domain, and special populations for those outcomes. The outcome domains are illustrated by examples of named outcome variables from included studies.
Table 3.2
Identified eligible studies by outcome domain.
As shown in Table 3.3, included data varied widely in sample size and source. Sample sizes ranged from as small as 16 women whose deaths were examined for potential preventability, to several million pregnant or birthing people. Categories of data sources are provided in Table 3.3. Nine studies used Pregnancy Risk Assessment Monitoring System data.
Table 3.3
Data sources, number of studies, and sample size ranges.
- Search Results - Social and Structural Determinants of Maternal Morbidity and Mo...Search Results - Social and Structural Determinants of Maternal Morbidity and Mortality: An Evidence Map
- Summary Table for Modifiers of Effectiveness - Treatment Strategies for Women Wi...Summary Table for Modifiers of Effectiveness - Treatment Strategies for Women With Coronary Artery Disease
- Detailed Electronic Database Search Strategies - Methods for Insulin Delivery an...Detailed Electronic Database Search Strategies - Methods for Insulin Delivery and Glucose Monitoring: Comparative Effectiveness
- Introduction - Cervical Ripening in the Outpatient SettingIntroduction - Cervical Ripening in the Outpatient Setting
- Quality Assessment of Randomized Trials and Observational Studies - Outpatient C...Quality Assessment of Randomized Trials and Observational Studies - Outpatient Case Management for Adults With Medical Illness and Complex Care Needs
Your browsing activity is empty.
Activity recording is turned off.
See more...