Introduction
Bacterial organisms like Escherichia coli have developed mechanisms to detect and direct cell movement toward substrate when starved. Such behavior is known as chemotaxis (15 for recent review).
Some nutrition (amino acids, sugar, etc.) can be sensed by the chemotaxis signal transduction system (Fig. 1). When the concentration of attractants increases, a signal is transmitted from the chemoreceptors to flagellar motor which influences the random walk of the bacterium. The fraction of time spent in run gets longer as the signal is transmitted, permitting the cells to be close to the nutrition rich environment for a longer period of time.

There are two modes of swimming behavior that are controlled by flagellar motor rotation: counter clockwise rotation, which causes the cell to ‘run’ and clockwise rotation, which makes the cell ‘tumble’ more frequently. In a nonstimulated environment, cells run four times longer than tumbling. Attractants like aspartate (Asp) shorten the tumbling time to increase a smooth run and lead cells to be in a more favorable environment.
The signal molecule that transmits the chemical signal to the flagellar motor is CheY protein. The phosphorylated form of CheY can interact with the flagellar motor protein FliM and make the motor rotate clockwise.14 Under a nonstimulated environment, large fraction of CheA, which forms a complex with CheW and the receptor protein (Tar, for Asp), are in active form and undergo autophosphorylation of this histidine kinase.7 CheA then transfers its phosphate to methyl esterase CheB or response regulator CheY. In exposure to attractants, the receptor complex tends to be in an inactive form, which in consequence decreases the phosphorylation level of CheY and then changes the switching of the flagellar motors to make cells tumble less.4
After stimulation, cells gradually adapt to the stimulus. This is a result of feedback by the receptor methylation caused by methyltransferase CheR and methyl esterase CheB. Methylation level of the Tar receptor is known to be enhanced by ligand binding and the methylated receptors recover its activity even in the sustained existence of attractants.
A numbers of models are proposed to explain how a chemotaxis system controls this swimming behavior quantitatively, because this system is qualitatively one of the best understood signal transduction system in the field of molecular biology. This system shows two remarkable properties, high gain of signals and precise adaptation. Explanations of how these properties are achieved should be given using quantitative data and analysis. Most biochemical data needed to construct models can be retrieved from papers published from 1970s to now, which enables us to construct and simulate models and analyze this system quantitatively.
However, each modeling study employs different formulisms and simulation algorithms, so comparisons of their performance is a nontrivial problem. To study the characteristics of each of these models and to compare their behavior, it would be helpful to be able to execute simulations on a single platform. The E-Cell Simulation Environment Version 3 (E-Cell 3) provides a flexible framework in which both deterministic and stochastic algorithms can be used to simulate models with either continuous or discrete variables. Our main goal is to test E-Cell's multi algorithm capabilities with a well-characterized system. To demonstrate the utility of this framework, we have constructed a model library of E. coli chemotaxis that allows comparative analysis of previously published models. It thus would be interesting when we try to analyze and get new insight on biological problems to compare models which have different assumptions and see which characteristics of each model bring the difference in representations of these models.
In this chapter, we introduce basic assumptions and profiles of the imported models and make clear the difference between reference models and imported E-Cell models. We have the following three models on E-Cell 3 thus far: (i) a minimal deterministic model of adaptation, based on Bray et al5 in which receptors have only a single methylation site, (ii) a more detailed, deterministic model in which the receptor has four methylation sites, as proposed by Mello and Tu8 and (iii) a stochastic model which explicitly represents the kinetics of all reactions present in (ii), based on Morton-Firth and Bray.10
These models are available at the following URL:
Models and Methods
Initial amount of substances, kinetic equation and kinetic parameters are taken from the original models and published papers. All these data are shown in our website.16
Shared Assumptions
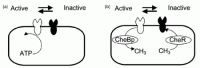
The implemented models share two assumptions; a two-state model of receptor activation1 and a robust adaptation mechanism2,9 (Fig. 2). Based on two-state model, chemoreceptors are in equilibrium between two conformations (S: swimming/T: tumbling). S receptors are called inactive receptors, for CheA activity in complex with S receptor is low. On the other hand, T receptors are called active receptors. Attractants bind to T receptors and shift equilibrium between S/T to increase S receptors. Simultaneously, S receptors accept methylation. Methylation causes receptors to more favorably shift to T form, although kinetic rates of methylation and demethylation are small compared to the effect induced by attractants. Barkai and Leibler2 and Morton-Firth and Bray9 suggested conditions to gain robust perfect adaptation that assume receptor methylation changes depending on activity of the receptor, thus CheR only bind receptors in inactive conformation while CheB only bind receptors in active conformation.
Canonical Adaptation Model (Loosely Based on Bray et al, 1993)
Methods
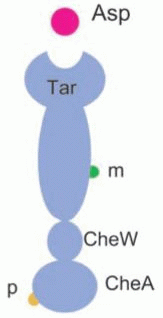
Model (i) employs the simplest mechanism for adaptation, loosely based on the reference.5 The reference model has the following features: (i) assumes the existence of only Tar receptors and does not incorporate effects from four other chemoreceptors (Tap, Trg, Tsr, Aer) that the Che protein can interact with, (ii) simplifies receptor methylation states in only two forms (methylated/not methylated), which denotes that the chemoreceptor has only two methylation sites (Fig. 3).
As E-Cell 3 was still in early development at the time we developed the model library, we needed to clarify the accuracy of the numerical integration of E-Cell system. For this purpose, we implemented the same model to GNU Octave and compared the results brought by the two software programs.
The model on E-Cell represents all 36 chemical reactions and numerically integrates by the Stepper class ODE45Stepper, which calculates numerical solution for simultaneous ordinary differential equations (ODE) with fourth order of precision and fifth order of error control.13 The model for validation implemented on GNU Octave was written in the form of 12 differential equations for simulation variables, such as proteins, and ODE was solved by lsode, which is based on the ODE solver LSODE by Hindmarch.
Results
Simulation outputs of E-Cell 3 and Octave were consistent as shown in Figure 5a. The results are shown as time-course data of phosphorylated CheYp, the output of the chemotaxis signal transduction system, which interacts directly to a flagellar motor. Simulation results are shown in Figure 5b. Attractants were induced at 2000 seconds when the system has reached steady state and then removed 2000 seconds after the stimulation when the cell adapted to the stimulation. The model can partially adapt to the stimulus. The Adaptation errors were under 3%, which do not meet perfect adaptation criterion.2 The Adaptation error shows a strong correlation with the magnitude of the stimulation (Fig. 6a). It enhances exponentially depending on the induced Asp concentration.

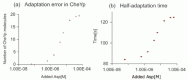
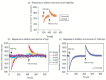
Figure 6
a) Adaptation error observed in model (i). Difference of CheYp molecules before and after adaptation. b) Adaptation time in model (i). Half adaptation times are plotted against the stimulus concentration.
Though the model didn't show perfect adaptation, it reproduced the dependence of adaptation time to the magnitude of induced stimulant (Fig. 6b). Because this model didn't adapt perfectly, time spent to recover half of reduced phosphorylated CheY is plotted to show adaptation time. It shows sigmoid curve to the logarithms of the stimulation magnitudes, which is consistent with experimental data published in ref. 3, Figure 2.
Perfect Adaptation Model (Based on Mello and Tu, 2003 and Morton-Firth and Bray, 1999)
Methods
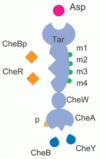
Mello and Tu6 proposed a model that introduces six conditions derived in an analytical study of the perfect adaptation. They also examined another model that is biologically consistent but moderately violates two of these conditions.10 The two models adapt almost equally exact, with adaptation error lower than 1%. This is the most detailed deterministic model that can be used to analyze adaptation behavior of a chemotaxis system for now and both models have the following features (i) represented by 12 differential equation, (ii) chemoreceptors with four methylation sites and shift among five methylation states and active/inactive conformation, (iii) CheB doesn't interact with no-methylated receptor species and CheR doesn't interact with 4-methylated receptors.
The methylation state of each receptor affects its probability to be in active state. A more methylated receptor can be found in the active state with high probability and interact more frequently with CheBp than CheR.
We have implemented the biologically realistic model referred to in the reference6 on E-Cell. We deducted the reference model to 375 elementary reactions. The model was simulated using ODE45Stepper. The Tar receptor complex has different binding states in regards to the methyl group and phosphate group (Fig. 4). Each state is implemented as a distinct simulation object on E-Cell 3.
Results
Figure 7 shows the simulation results of the model (ii). Phosphorylated CheY protein shows perfect adaptation for the stimulation by five orders of magnitude. Concentrations of each molecular species at a steady state was the same as the data shown in ref. 6, table IV.
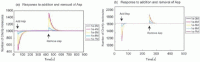
Figure 7
a) Response of CheYp molecule to the addition and removal of Asp. Stimulants were added at 50 simulation seconds and then removed after 400 seconds. b) Results of the model implemented on Mathematica, that perfectly adapts to the stimulation.
For a reference, outputs from a mathematically strict model, which was implemented in Mathematica Version 4.2, is shown in Figure 7b. It shows exact adaptation at any concentration of 0.1 μM to 1.0 mM stimulant.
Stochastically Represented Perfect Adaptation Model (Based on Morton-Firth and Bray, 1999)
Methods
The model that reference6 referred to as a biologically consistent model is originally a model on a stochastic simulator, StochSim, developed by Morton-Firth et al.9,10 This stochastic model was also implemented on E-Cell as model (iii). This model can be used to analyze effects of random fluctuation of the system, which can't be discussed by deterministic models.
StochSim is a stochastic simulator for biological systems. It treats each molecule as distinct simulation objects. Simulation objects in StochSim models interact according to reaction rate constants and stochastic constants calculated by free energy and kinetic rate constants. In one simulation step, two objects are randomly selected. A generated random number will be compared with stochastic constants of the reaction. The system will calculate the reaction and update itself if the random number was larger than the stochastic constant.
Simulation with stochastic algorithm is suitable for analysis of biological systems in which the quantity of constitutive molecules are small, for example CheR.
The main feature of this reference model is the same as that described in model (ii). The imported model has an alteration from the original model: Tsr effects are not considered. This is for simplicity and to make comparison with model (ii) easier. Bindings of ligands are implicit in the rate of reactions. This is because the binding/dissociation reaction between ligand and receptors is very fast compared to other reactions in this system and can be assumed to be rapid equilibrium.
We imported this model using GillespieStepper, an implementation of Gillespie and Gibson's algorithm. Simulation outputs were compared with the results of StochSim calculation.17
Results
The simulation outputs of E-Cell 3 and StochSim were consistent as shown in Figure 8.
This model also achieved perfect adaptation (Fig. 8). Also, the magnitude of the stimulation and adaptation time shows correlativity as in Model (i). In the stochastic model, response to 0.1 μM induction of the stimulus was concealed by the fluctuation (Fig. 9).
Summary and Discussion
Model (i) demonstrates that a single methylation site is insufficient for perfect adaptation when activity-dependent kinetics is assumed. This result is consistent with the recent analysis by Shimizu et al.12 The logarithmic dependence of adaptation time on stimulus size, however, can be reproduced even in this simplified model.
Model (ii), derived in an analytical study of the constraints required for exact adaptation, is presently the most detailed deterministic model for analyzing the adaptive behavior of the bacterial chemotaxis pathway. Because the model is a faithful reduction of the stochastic model of Morton-Firth et al,10 it can be used to answer questions about perfect adaptation (except those pertaining to stochastic aspects) and can be solved much more efficiently than stochastic models.
Model (iii) ported to E-Cell 3 faithfully reproduced the behavior of the StochSim implementation. Interestingly, the time spent to run a 1500 second simulation was nearly the same between the two simulation systems. One of the reasons that StochSim was developed was to circumvent the difficulty that the time required for simulations using the Gillespie algorithm is proportional to the number of possible reactions in the system. The improved Gillespie-Gibson algorithm implemented in E-Cell 3, however, was expected to be faster than StochSim because it uses efficient data structures that make the execution time proportional to the logarithm of the number of reactions. It will be interesting to consider in more detail the conditions under which each algorithm outperforms the other.
Both deterministic and stochastic models of chemotaxis have been successfully implemented on E-Cell 3. In future work, it can be interesting to further exploit the flexibility of this system to combine deterministic and stochastic computations within the same model. For example, we believe such a framework would be useful for studying the following problems: (i) the response of a stochastic model to various input signals that take the form of continuous functions, (ii) to combine dynamic models of the flagellar motor with the pathway models.
References
- 1.
- Asakura S, Honda H. Two-state model for bacterial chemoreceptor proteins: the role of multiple methylation. J Mol Biol. 1984;176:349–367. [PubMed: 6748079]
- 2.
- Barkai N, Leibler S. Robustness in simple biochemical networks. Nature. 1997;387:913–917. [PubMed: 9202124]
- 3.
- Berg HC, Tedesco PM. Transient response to chemotactic stimuli in Escherichia coli. Proc Natl Acad Sci USA. 1975;72:3235–3239. [PMC free article: PMC432957] [PubMed: 1103143]
- 4.
- Borkovich KA, Kaplan N, Hess JF. et al. Transmembrane signal transduction in bacterial chemotaxis involves ligand-dependent activation of phosphate group transfer. Proc Natl Acad Sci USA. 1989;86:1208–1212. [PMC free article: PMC286655] [PubMed: 2645576]
- 5.
- Bray D, Bourret RB, Simon MI. Computer simulation of the phosphorylation cascade controlling bacterial chemotaxis. Mol Biol Cell. 1993;4:469–482. [PMC free article: PMC300951] [PubMed: 8334303]
- 6.
- Le Novere N, Shimizu TS. Stochsim: modelling of stochastic biomolecular processes. Bioinformatics. 2001;17:575–576. [PubMed: 11395441]
- 7.
- McNally DF, Matsumura P. Bacterial chemotaxis signaling complexes: formation of a CheA/CheW complex enhances autophosphorylation and affinity for CheY. Proc Natl Acad Sci USA. 1991;88:6269–6273. [PMC free article: PMC52064] [PubMed: 2068106]
- 8.
- Mello BA, Tu Y. Perfect and near-perfect adaptation in a model of bacterial chemotaxis. Biophys J. 2003;84:2943–2956. [PMC free article: PMC1302857] [PubMed: 12719226]
- 9.
- Morton-Firth CJ, Bray D. Predicting temporal fluctuations in an intracellular signalling pathway. J Theor Biol. 1998;192:117–218. [PubMed: 9628844]
- 10.
- Morton-Firth CJ, Shimizu TS, Bray D. A free-energy-based stochastic simulation of the tar receptor complex. J Mol Biol. 1999;286:1059–1074. [PubMed: 10047482]
- 11.
- Ninfa EG, Stock A, Mowbray S. et al. Reconstitution of the bacterial chemotaxis signal transduction system from purified components. J Biol Chem. 1991;266:9764–9770. [PubMed: 1851755]
- 12.
- Shimizu TS, Aksenov SV, Bray D. A spatially extended stochastic model of the bacterial chemotaxis signaling pathway. J Mol Biol. 2003;329:291–309. [PubMed: 12758077]
- 13.
- Takahashi K, Kaizu K, Bin H. et al. A multi-algorithm, multi-timescale method for cell simulation. Bioinformatics. 2004;20:538–546. [PubMed: 14990450]
- 14.
- Welch M, Oosawa K, Aizawa S. et al. Phosphorylation-dependent binding of a signal molecule to the flagellar switch of bacteria. Proc Natl Acad Sci USA. 1993;90:8787–8791. [PMC free article: PMC47445] [PubMed: 8415608]
- 15.
- Wadhams GH, Armitage JP. Making sense of it all: bacterial chemotaxis. Nat Rev Mol Cell Biol. 2004;5:1024–1037. [PubMed: 15573139]
- 16.
- E-Cell project website. http://www.e-cell.org/
- 17.
- Gibson MA, Bruck j. Effiecient exact stochastic simulation of chemical systems with many species and many channels. J. Phys. Chem. 2000;104:1876–1889.
Publication Details
Author Information and Affiliations
Authors
Yuri Matsuzaki*.Affiliations
Copyright
Publisher
Landes Bioscience, Austin (TX)
NLM Citation
Matsuzaki Y. A Model Library of Bacterial Chemotaxis on E-Cell System. In: Madame Curie Bioscience Database [Internet]. Austin (TX): Landes Bioscience; 2000-2013.


