Introduction
Since a mature mammalian erthrocyte is enucleated and it is void of mitochondria, gene expression does not take place, while glycolysis is the only mechanism to produce ATP. This simplicity makes its metabolism unique from other cells. Due to its simple structure and the traceability of the cell, erythrocyte metabolism and enzymology have been well studied over the last three to four decades. Although vast amounts of erythrocyte component information is available, the quantitative and physiological role of the metabolism is still an open question because the nature of the cellular function is the complex dynamics of components. Mathematical models for biochemical pathways comprising complex networks are of particular interest in order to identify the features of biological systems that cannot be investigated by the analysis of their individual components alone. Because of its simplicity, the robustness of the erythrocyte that enables the cell to circulate in the body for about 120 days and the abundance of knowledge, erythrocytes have been a good subject for numerous modeling and simulation studies. There is a long history of detailed metabolic models of erythrocyte metabolism with differential equations. The first mathematical models of erythrocyte metabolism were developed by Rapoport et al and the model by Heinrich et al, which only included the glycolytic pathway.1-3 Ataullakhanov et al expanded the glycolytic model to represent the pentose phosphate pathway.4 Subsequently, adenine nucleotide metabolism was first considered by Schauer et al.5 The comprehensive biochemical network, which has been widely accepted as the complete network of the metabolic system in erythrocytes, was reconstructed by Joshi and Palsson in 1989-1990, involving membrane transports, the Na+/K+ pump and osmotic pressure.6-9 Mulquiney and Kuchel developed a precise model that describes magnesium equilibrium, binding metabolites to oxyhemoglobin (oxyHb) considering the most detailed kinetics of glycolytic enzymes.10,11 Based on these studies, several models focusing on human erythrocyte metabolism have been developed using E-Cell System, which is one of the leading simulation platforms for applying various modeling methods, mathematical analyses and multi-time/multi-size behaviors. The simulation analysis of these models predicted various aspects of the metabolism under physiological and pathological conditions: the importance of the de novo synthesis and transport of glutathione in glucose-6-phosphate dehydrogenase (G6PDH)-deficient cells,12 the physiological significance of NADPH-dependent methemoglobin-reducing pathway13 and the effectiveness of intracellular protein bindings in hypoxia-induced alterations of the metabolism through hemoglobin allostery.14
This chapter presents these applications of the metabolic model of human erythrocytes developed on E-Cell System in some detail.
Simulation Analysis of Glucose-6-Phosphate Dehydrogenase (G6PDH) Deficiency
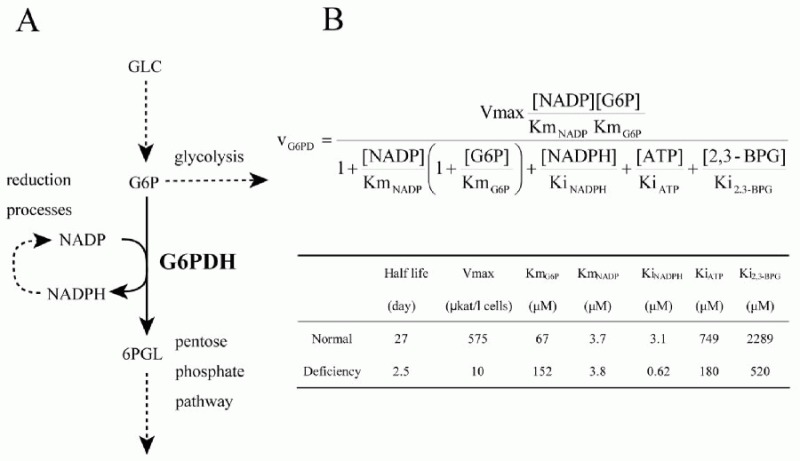
Using the metabolic model of human erythrocyte on E-Cell System, which consists of glycolysis, pentose phosphate pathways, nucleotide metabolism, simple membrane transport systems and the ATP dependent-Na+/K+ pump, we carried out a simulation analysis of G6PDH. The basic model was based on that developed by Joshi and Palsson.6-9 G6PDH deficiency is the most common enzymopathy in human erythrocytes with more than two hundred million people affected by the disease. In serious cases, this disease causes chronic hemolytic anemia due to attenuated reducing potential. G6PDH, the initial step of the pentose-phosphate pathway (PPP), catalyzes the oxidation of glucose-6-phosphate (G6P) to 6-phosphoglucolactone (6PGL) concomitantly reducing NADP to NADPH (Fig. 1A) and is regulated by ATP and 2,3-BPG. NADPH is needed for conversion of GSH from GSSG, and GSH protects the cell membrane and any other proteins in a human erythrocyte from oxidative stress both directly and indirectly. We employed the initial metabolic model of human erythrocytes to reproduce the pathological condition of G6PDH deficiency. Figure 1B shows the kinetic equation of G6PDH and the corresponding parameter values of normal and deficient cells used in this study. In our first simulation of G6PDH deficiency, we substituted normal kinetic parameters with those obtained from the patients with the deficiency.
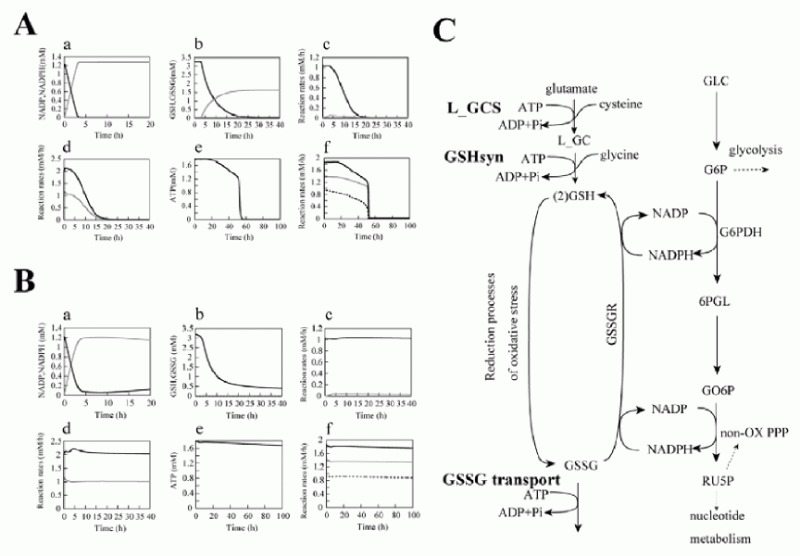
As a result, several sequential changes were observed in the simulation of G6PDH deficiency: reaction rate of G6PDH was very low, a decrease in NADPH occurred and GSH rapidly decreased (Fig. 2A, panel a-c). ATP kept its initial concentration for several simulation hours, because consumption and production of ATP in glycolysis was balanced. However, after approximately 55 hours, ATP began to decrease and glycolytic enzyme activities started to depress and finally depleted completely (Fig. 2A, panel d-f ). It is experimentally known that in G6PDH-deficient cells, ATP and glycolytic enzyme activities keep their normal levels while the metabolites or metabolic fluxes in PPP are lowered;15 however, the simulation results didn't agree with this metabolic feature of G6PDH deficiency.
After a precise survey of the metabolic pathways in erythrocytes, we hypothesized that the difference between the simulation model and the actual cell was caused by the lack of significant pathways in the model: de novo synthesizing GSH and excretion of GSSG. The first step of synthesis of GSH in human erythrocytes produces gamma-glutamyl cysteine (L_GC) from cysteine and glutamate using ATP. The reaction is catalyzed by gamma-glutamyl cysteine synthetase (L_GCS), the rate-limiting enzyme of glutathione synthesis. In the second step, GSH is produced from L_GC and glycine using ATP, which is catalyzed by glutathione synthetase (GSHsyn). Therefore, the GSH synthetic process involves the three kinds of amino acids which are transported through cell membrane and two molecules of ATP.16 Due to the strong feedback inhibition of L_GCS by GSH, the synthesis of GSH is suppressed in the normal state in which GSH exists in high concentration. On the other hand, under abnormal conditions, e.g., suffering from oxidative stress or genetically deficient of steps in generating GSH, the pathway is speculated to be efficiently activated. In addition, erythrocytes have an ATP-dependent transport system of GSSG, which was first demonstrated by Srivastava and Beutler17 and kinetically examined by Kondo and Beutler.18 We added these pathways, which are neglected in former models, to the initial model. The rate equations and kinetic parameters of the expanded pathways were not shown here but presented in other models.12
Using the expanded model that contains the above pathways around GSH-GSSG, the following behaviors were predicted in the simulation of G6PDH deficiency: a lesser decrease in GSH, lower levels of GSSG and a higher NADP/NADPH ratio than that of the previous model (Fig. 2B, a-c). Note that the activities of glycolytic enzymes stayed at almost the initial rate, which was one of the most remarkable difference from the previous model, culminating in the retention of the ATP level (Fig. 2B, d-f ). The lifetime predicted from the ATP level of the pathway-expanded model was much longer than that of the previous model. These results corresponded to the results by Ferretti et al that G6PDH-deficient cells have normal glycolytic activity and abnormally low activity of the pentose phosphate pathways.15
These results suggest that the expanded pathways, which have not so far been considered in modeling, play a significant role not only in keeping the GSH/GSSG ratio but also in retention of glycolytic activity, the ATP level in the G6PDH-deficient erythrocyte. Most patients of G6PDH deficiency are not anemic until the RBCs are exposed to strong oxidant stress. The compensatory effect of the expanded pathways, de novo GSH synthesis and GSSG transport, helps explain why many varieties of G6PDH deficiency have no significant phenotype in normal states. It is also well known that patients of G6PDH deficiency have significant resistance to severe malaria and due to its ability to protect against malaria, high frequency of G6PDH deficiency is shown. Under these circumstances, this study could also suggest that the compensatory mechanism may help the spread of G6PDH deficiency, thus decreasing its severity and promoting the propagation of the disease during evolution.
Simulation Study for Methemoglobin Reduction Pathways
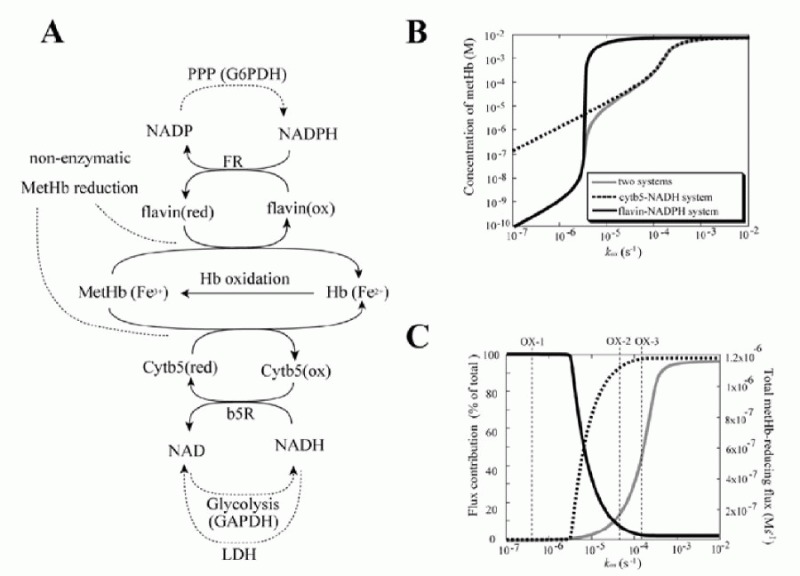
In circulating erythrocytes, hemoglobin oxidation to metHb continuously occurrs via intracellular and extracellular reactive oxygen species and via exogenous and endogenous nitrites/nitric oxide. The accumulation of intracellular metHb reduces the supply of oxygen to tissues. As the cycling of hemoglobin and metHb causes an associated persistent production of superoxide anions, metHb accumulation potentially results in additional oxidative stress.19,20 In normal erythrocytes, metHb is maintained at a level of less than 1% of total hemoglobin through two metHb-reducing pathways.21,22 One of these systems is the redox cycle consisting of cytochrome b5 (cytb5) and cytochrome b5-metHb reductase (b5R), which uses NADH as an electron transfer to cytb5 (“cytb5-NADH system”). The other pathway uses flavin as an electron carrier for the reduction of metHb coupled with NADPH oxidation, catalyzed by NADPH-dependent flavin reductase (FR) (“flavin-NADPH system”). The pathway schemes are shown in Figure. 3A.
Cytb5-NADH system is estimated to be responsible for more than 95% of metHb-reducing capacity under experimental conditions.23-25 In addition, hereditary methemoglobinemia, the condition where the level of metHb is greater than 1% of the total hemoglobin content of the cell,26 is a congenital deficiency of b5R and / or cytb5.27 Contrary to this, the contribution of flavin-NADPH system to the reduction of metHb has generally been considered to be negligible, as the deficiency of the flavin-NADPH system is not associated with a metHb-reduction-deficient phenotype.28 On the other hand, FR is reported to be widely distributed in human tissues, but is most abundant in erythrocytes.29,30 This appears to be an inefficient distribution pattern, given the potentially minor role of FR in metHb reduction.
NADH is produced by the reaction through GAPDH in glycolysis and is converted to NAD in the last step of glycolysis catalyzed by lactate dehydrogenase (LDH). These reactions are in a state of equilibrium, fully coupled to each other in human erythrocytes and the NADH/NAD ratio is kept very low for driving glycolysis. On the contrary, the ratio of NADPH/NADP is kept high by the metabolic property in the production of NADPH. The excess activity of G6PDH enables a high NADPH concentration and in an accute NADPH supply in response to naturally occurring oxidative challenges.31,32 It has thus been accepted that NADPH is a main source of intracellular reductive power while NADH is not critical for redox status in the cell.
Under these circumstances, a question arises: what is the physiological role of the flavin-NADPH system and why do erythrocytes primarily use an NADH-dependent reduction process for the reduction of metHb?
To make predictions about the two pathways, in terms of their metHb-reducing behavior, a mathematical model was developed including both the above-mentioned two metHb-reducing systems and the major metabolic pathways (glycolysis, PPP) in human erythrocytes as a supplier of NADH or NADPH. The cytb5-NADH system consists of an enzymatic reduction of oxidized cytb5 by b5R using NADH as an electron carrier and the subsequent non-enzymatic reduction of metHb by the reduced cytb5. The kinetic equations used in the model were:
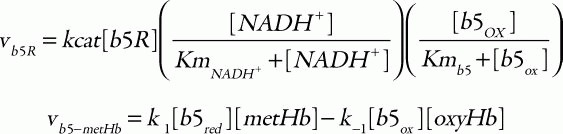
where the corresponding parameters are: kcat, 418 s1; KmNADH, 0.31 μM; Kmb5, 14.92 μM;33 [b5R], 0.07 μM;34 k1, 6.2 × 10³ M1s1; and k-1, 0.583 M1s1.35 For the flavin-NADPH system, the electron transport from NADPH to oxidized flavin catalyzed by FR obeys an ordered BiBi mechanism.36 MetHb is then reduced non-enzymatically by the reduced flavin:
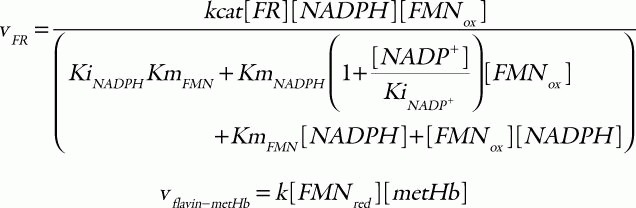
in which the parameter values used are: kcat, 0.099 s1; KmNADPH, 0.97 μM; KmFMN, 52.76 μM; KiNADPH 0.55 μM; KiNADP, 4.89 μM;36 [FR], 9.09 μM;25 and k, 5.5 × 10⁶ M1s1.25 Total concentration of cytb5 and flavin was set to 0.812 μM37 and 1.4 μM,38 respectively. The hemoglobin oxidation was represented as a first-order reaction with respect to the concentration of oxyhemoglobin:

where kox is a rate constant. In this model, the direct metHb-reducing effects by small molecules, such as ascorbic acid and GSH, were not included because the relative contribution of these molecules to the metHb-reducing rate is very small in comparison to those of the two above-mentioned metHb-reducing pathways.39
In addition, it was thought that the model should involve central energy metabolism which would account for NADH and NADPH production. The part of the model for glycolysis and PPP was taken from the model developed by Mulquiney and Kuchel.10,11 The final model includes 87 reaction processes involving all of the binding processes and 63 metabolites involving all of the complex forms. It consists of the metHb-reduction pathways, glycolysis, 2,3-BPG metabolism, PPP and some transport processes of metabolites (e.g., pyruvate, lactate).
The results of the steady-state accumulation of metHb in response to increased hemoglobin oxidation (kox), are shown in Figure 3B. Each line represents the results from the model involving the two metHb-reducing systems (black solid line), the cytb5-NADH system alone (broken line) and the flavin-NADPH system alone (gray solid line), respectively. The accumulation of metHb in the flavin-NADPH-only model was significantly lower than that in the cytb5-NADH-only model when the kox was below 3.5 × 10⁶ s1; however, when this rate was exceeded, an abrupt increase in metHb occurred in the flavin-NADPH-only model. The accumulation of metHb in the two-system model was similar to the flavin-NADPH-only model under the condition of slow hemoglobin oxidation; however, under conditions of fast hemoglobin oxidation it was similar to the cytb5-NADH-only model. From this result it was suggested that a switch from the flavin-NADPH system to the cytb5-NADH system occurs upon an increase in the oxidation rate of hemoglobin. The switching of the pathways' significance was also shown in the analysis of flux contribution. In Figure 3C, the overall flux of metHb reduction (gray solid line) and the flux contributions of the flavin-NADPH system (black solid line) and the cytb5-NADH system (black broken line) in proportion to total metHb-reducing flux are displayed. When kox was below 3.5 × 10⁶ s1, most of the metHb-reducing flux was responsible for the flavin-NADPH system and the concentration of metHb was much lower than 1 μM. When kox was over 3.5 × 10⁶ s1, an abrupt switch in flux contribution from the flavin-NADPH system to the cytb5-NADH system occurred.
In the model, under conditions where the cytb5-NADH system was responsible for greater than 95% of metHb reduction, the flux through the cytb5-NADH system (NADH consuming process) could potentially reach almost 1.2 × 10⁶ Ms1, which is much higher than the rate reported for nonglycolytic NADH consumption in human erythrocytes which is reported to be approximately 2.78 × 10⁹ Ms1.40 Furthermore, the rate of constitutive methemoglobin formation in normal erythrocytes is reported to be 3% of the total amount of hemoglobin in the cell per day,41 equal to 2.78 × 10⁹ Ms1 of a spontaneous rate of hemoglobin oxidation. This rate is significantly lower than 3.5 × 10⁶ s1, where the flavin-NADPH system exceeds its flux capacity. Under such low levels of oxidative stress, the flavin-NADPH system would be responsible for most of the metHb reduction, because the rate constant of the non-enzymatic system which directly reduces metHb is 1000-fold higher than in the cytb5-NADH system. From these results, it is suggested that either the two systems are active under distinct conditions of hemoglobin oxidation and make different contributions to the tolerance of oxidative stress: The flavin-NADPH system works mainly to provide reduction potential under normal conditions, while the cytb5-NADH system functions to reduce metHb under conditions of excess oxidation, such as during the intake of oxidant drugs. In addition, it is speculated that the oxidative rate under physiological conditions is estimated to be much lower than that of experimental and abnormal conditions. One reason why the contribution of flavin-NADPH system has not been uncovered may be because of difficulties in measuring the trace levels of oxidation occurring normally in vivo, whereas it is much easier to observe conditions of excess oxidative stress in which the cytb5-NADH system may play a major role.
NADPH is supplied from the pentose-phosphate pathway and the primary use of NADPH in erythrocytes is reducing GSSG into GSH catalyzed by GSSGR. It is known that the high enzyme activities of G6PDH and GSSGR in human erythrocyte are evolutionarily maintained because they are necessary to avoid strong NADPH depletion and GSSG accumulation under oxidative stress.31,32 One possible explanation for the use of NADH as a major source of reducing equivalents for metHb in abnormal oxidative stress may be to avoid competition for NADPH among glutathione and hemoglobin. Interestingly, the expression levels of soluble cytb5 and soluble b5R are significantly increased just prior to loss of the nucleus at the late stage of erythroid maturation. 42 Moreover, in nucleated erythrocytes containing TCA cycles (e.g., avian erythrocytes), the NADPH-dependent pathway has a dominant role in reducing metHb, even under conditions of excess oxidation of hemoglobin.43 It can be speculated that the preference of nucleated erythrocytes for the flavin-NADPH system is related to the lower availability of NADH-coupled reducing equivalents in the cytoplasm, which would result from their preferential transfer to mitochondria for the respiratory chain and/or for high malate dehydrogenase activity, resulting in a large flux of NADPH regeneration.
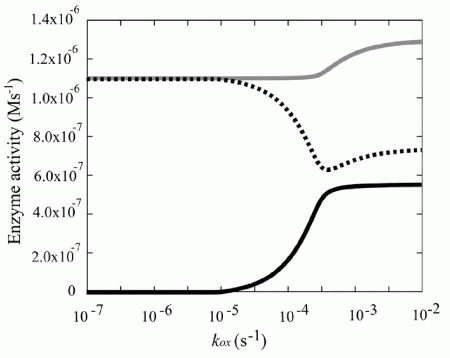
In the simulation model, the increased demand for NADH was met by the reverse reaction of lactate dehydrogenase (LDH), rather than by the increased glycolytic flux (Fig. 4). In other words, the vast amount of NADH is supplied by the lactate/pyruvate shuttle: a combination of the reverse reaction of LDH and the lactate/pyruvate transport process. It can thus be supposed that NADH production via reverse flux of LDH results in an increase in intracellular pyruvate concentration, which could then be released into the plasma. In fact, it has been reported that excess oxidative stress causes an accumulation of pyruvate in plasma, due to its release from erythrocytes coupling with the increase in metHb.44,45 It has been reported that, in some tissues including neurons, plasma pyruvate is rapidly transported from plasma into the tissue under excess oxidative stress caused by H2O2.46,47 Furthermore, it has been recently suggested that the lactate/pyruvate shuttle in astrocytes plays an important role in preventing oxidative injury in neurons by supplying pyruvate from plasma.48 These circumstances allow us to hypothesize that plasma pyruvate is partially supplied by erythrocytes via the reduction of metHb under high oxidative stress and these synergistic effects may be another story of the benefit to the existence and the oxidation level-dependent switching of this “hybrid system:flavin-NADPH and cytb5-NADH systems”.
Figure 4
Steady state enzyme activities that utilize NAD/NADH Steady state activities of b5R (solid line in black), LDH (dotted line) and GAPDH (solid line in gray) are plotted as a function of kox.
Prediction by Mathematical Modeling and its Verification by Metabolome Analysis for Oxygen Sensing Mechanism in Human Erythrocytes
In human erythrocytes, an extremely high concentration of Hb exists in the cell that enables oxygen (O2) delivery from the lungs to every tissue through the blood stream. The ability of Hb to carry O2 is modulated through allosteric regulation of Hb affected by a variety of metabolites, such as protons (H+), 2,3-BPG, nitric oxide (NO) and ATP. The behavior of the metabolism in erythrocytes is thus directly and highly related to the ability to deliver oxygen. Erythrocytes are known to accelerate glucose consumption in response to hypoxic exposure, which results from acceleration of glycolysis.49 As the increase in 2,3-BPG stabilizes the T-state of Hb and thereby facilitates O2 dissociation from the cells, the increment of 2,3-BPG should lead to a further T-state Hb stabilization. Furthermore, as T-state Hb has a higher affinity to 2,3-BPG and ATP than the R-state Hb, stabilization of hemoglobin into T-state would reduce amounts of free 2,3-BPG and ATP. A decrease in free ATP reduces the availability of maintenance of cellular homeostasis and deformability of the cells. From the fact that the initial steps of glycolysis (e.g., used by hexokinase (HK) and phosphofructokinase (PFK)) require ATP in triggering ATP synthesis itself, researchers have hypothesized that erythrocytes might have suitable mechanisms for responding quickly to hypoxia to up-regulate de novo ATP synthesis and glycolytic flux, leading to the increase in 2,3-BPG.
Meanwhile, evidence of compensatory mechanisms to maintain intracellular ATP levels through the interaction of Hb with Band III (BIII), a major transmembrane protein in erythrocytes,50 has been reported. The cytoplasmic domain of BIII binds to Hb with a greater affinity for T-state-Hb rather than R-state-Hb51 and also binds to some glycolytic enzymes such as PFK, aldolase (ALD) and GAPDH.52 The activity of these enzymes disappears while making complex with BIII, but is recovered upon dissociation from BIII.52 This evidence led us to hypothesize that Hb stabilized in the T-state upon hypoxia serves as a trigger to increase the activity of these glycolytic enzymes and to accelerate glucose consumption to increase the synthesis of ATP and 2,3-BPG. However, the dynamics of sequential glycolytic reactions based on the mechanistic features of the coordination and the alterations in intracellular metabolites resulting from such dynamics are not comprehensively understood. Moreover, the link between the metabolism and the Hb regulation is not fully understood, nor does mathematical model taking them into consideration simultaneously exist. Here, we further expanded the mathematical model of metabolism in erythrocytes, involving the O2-sensing mechanisms of Hb, to predict temporal alterations in intracellular metabolites and cellular energetics in response to hypoxia and to verify the predictions derived from the model through metabolome analyses.
The reversible binding of the glycolytic enzymes (PFK, ALD and GAPDH) and two allosteric forms of Hb (R- and T-states) to BIII on the membrane, also known as anion exchanger type I, were modeled on the basis of the individual association constants14 by adding the basal metabolic model.
The metabolic model covers comprehensive metabolic pathways including not only glycolysis, but also pentose phosphate pathways, adenine nucleotide metabolism, membrane transport of metabolites, the ion pump, the above-mentioned GSH metabolism since the pathways determine levels of such as GSH, AMP and Pi, which are known allosteric regulators of HK, PFK and GAPDH, respectively. In the model we also considered effects of Hbs (T-state Hb and R-state Hb) binding to intracellular metabolites (2,3-BPG, MgATP, ATP, ADP and 1,3-BPG) and magnesium ion (Mg2+) binding to ATP, ADP, AMP, 1,3-BPG, 2,3-BPG, F-1,6BP and GDP. BIII accounts for about 25% of the total erythrocyte membrane protein and its cytoplasmic domain displays a greater affinity for Hb in the T-state rather than the R-state:51 T-state Hb has 100-fold greater affinity to BIII and is much more likely to associate with this anion transporter than R-state Hb. Based on the recent observations,52 these three enzymes were modeled to be inactivated upon formation of the complex and activated reversibly upon dissociation in the model. Consequently, the competitive association of Hb and the glycolytic enzymes with BIII and the subsequent changes in glycolysis could be calculated in response to alterations in partial O2 tension (pO2). In this mathematical model, we can then manipulate pO2 as a parameter to predict glycolytic metabolism as an outcome. The oxygenation status alters the T-R transition of Hb according to a reversible Hill-type equation53 that is also dictated by pCO2, intracellular pH, concentrations of 2,3-BPG and ATP and temperature. To adapt the model to hypoxic conditions, pO2, which was initially set to 100 mmHg, was reduced to 30 mmHg, for desired lengths of time. As seen in previous studies, circulating erythrocytes may be exposed to such a pO2 value when they travel through capillaries under physiological conditions or when they traverse low-flow or static microvessels belonging to post-ischemic damaged regions in the liver.54,55
The simulation results of hypoxia-induced metabolic alterations in human erythrocytes and the measurement result of metabolomics under a similar condition to the simulation are shown in Figure 5A (see 14 for the details of experimental procedure). The differences in time-courses between the BIII(+) model, involving interactions between BIII and the intracellular proteins (Hb and the glycolytic enzymes) and the BIII() model, without these interactions, were predicted (Fig. 5A, left two lines). As expected, in the BIII(+) model, the activities of PFK, ALD and GAPDH were evaluated immediately by their release from BIII upon alteration of Hb allostery, while they did not change significantly in the BIII() model. Such effects of protein-interactions with BIII made distinct profiles in metabolite concentrations and the subsequent enzyme activities. In the BIII()model, G6P and F6P increased slightly while F1,6BP, DHAP, 3PG and PEP decreased modestly versus the steady-state baseline levels. In contrast, an opposite pattern to the BIII() model was displayed in the BIII(+) model: decreases in G6P and F6P by 50% and increases in F1,6BP, DHAP, 3PG and PEP by 40% versus the corresponding baseline levels (Fig. 2B) were shown. The decrease in G6P in the BIII(+) model resulted in further activation compared to the BIII() model through a product inhibition for HK by G6P. This would lead to help accelerate the first step of glycolysis. Moreover, hypoxia-triggered activation of GAPDH drives an activation of LDH as a downstream target by coupling with NAD-NADH and thereby facilitates the second half of the glycolytic reactions. Consequently, the hypoxia-dependent BIII interactions contributed to the overall activation of glycolysis and to sustaining the functions of the cell as judged by two indicators: the energy charge (EC) and the total amount of 2,3-BPG (the left line in Figure. 5A, the figures enclosed by bold line). Energy charge is an index of the content of high-energy phosphate bonds of adenylate nucleotides which is calculated by (ATP + 0.5ADP)/(ATP + ADP + AMP). The basal energy charge under normoxic steady-state conditions was predicted to 0.91, which is comparable to that reported in previous studies ranging from 0.86 to 0.935. Moreover, the amount of 2,3-BPG would contribute to a rapid increase in the Hb-2,3-BPG complex that could consequently lead to the release of residual Hb-bound O2 from erythrocytes.
The verification of the predicted alteration in glycolytic-metabolite concentrations was carried out by measuring metabolome using capillary electrophoresis mass spectrometry (CE-MS) along the procedure described in the literature.14 As seen in the right line in Figure 5A, G6P and F6P were significantly lower than those measured as steady-state controls under normoxic conditions whereas levels of F1,6BP, DHAP, 3PG and PEP were greater than normoxic steady-state controls. These results are entirely consistent with those predicted by the BIII(+) model.
To demonstrate whether the actual acceleration of glycolysis could occurr in response to hypoxia as predicted by the BIII(+) model, we determined the rate of glycolysis by measuring the conversion rate of 13C-glucose into 13C-lactate in human erythrocytes. As shown in the left graph in Figure 5B, the rate of production of 13C-lactate was accelerated 1.8-fold within 1 min after exposure to hypoxia, which means that a condition of hypoxia triggers an acceleration of glycolysis. On the other hand, as displayed in the right graph in Figure 5B, CO-treated erythrocytes in which Hb is stabilized in the R-state attenuated the hypoxia-induced acceleration of glycolysis judged by the lactate production. These results strongly supported the consequence that the hypoxia-induced stabilization of T-state Hb plays a crucial role in hypoxia-triggered glycolytic activation in erythrocytes.
To quantitatively assess such metabolic effectiveness through BIII-protein interactions of the simultaneous increase in EC and in 2,3-BPG generation during hypoxia, a model analysis was carried out by determining whether the amount of a particular enzyme can achieve a simultaneous increase in EC and 2,3-BPG by increasing the amount of each glycolytic enzyme in the pathway by 2-fold simultaneously with hypoxia. In human erythrocytes, HK, PFK and PK have high and positive flux control coefficient on glycolysis and they are known as “rate-determining enzymes” in glycolysis. As shown in Figure 5C, an activation of HK resulted in a decrease in EC and an increase in 2,3-BPG, while PK activation increased EC without stimulating 2,3-BPG generation. On the other hand, activation of PFK or PFK + ALD + GAPDH led to simultaneous elevation of EC and 2,3-BPG generation in the model. These analyses suggest that PFK activation is a crucial step for the upregulation of both energy charge and 2,3-BPG generation, while activation of initial (e.g., HK) or final (e.g., PK) steps of the glycolytic pathway fails to satisfy these requirements. Furthermore, activation of ALD and GAPDH appears to help PFK-activation-driven acceleration of glycolysis at the onset of hypoxia. These results allow us to hypothesize that the erythrocyte metabolism may be evolutionarily and systemically optimized for sustaining cellular energy status and for efficiently delivering oxygen to tissues.
Conclusion
In the previous sections, practical examples of using mathematical models focusing on human erythrocyte metabolism on E-Cell System were presented.
In Simulation Analysis of Glucose-6-Phosphate Dehydrogenase (G6PDH) Deficiency, an expansion was added to the model by introducing a GSH synthesis pathway and a GSSG export system. With this expansion, the model maintained high ATP concentrations even in the simulated condition of G6PDH deficiency. This suggests that these pathways may play an important role in alleviating the consequences of G6PDH deficiency and that these sub-pathways that are normally not particularly highly activated may play important roles in abnormal conditions. Models sufficient for representing the normal state can become inadequate for simulating irregular conditions such as deficiencies, because they lack alternative pathways that may normally not be particularly active but can compensate for the deficiency to some extent. This study also suggested that resolving the discrepancies between experimentally validated knowledge and the simulation results allows us to improve our understanding of the underlying mechanisms making fragility of the cells under particular conditions.
The next section discussed the rational design of metHb-reducing pathways in human erythrocytes with kinetic modeling. Erythrocytes are continuously subjected to oxidative stress and exposure to nitrite, which results in spontaneous formation of metHb, which is an oxidized form of hemoglobin preventing binding and carrying oxygen. To avoid accumulation of metHb, reductive pathways mediated by two substrates coupled with NADH- and NADPH-dependent metHb reductases keep the level of metHb in erythrocytes at less than 1% of the total hemoglobin under normal conditions. The results of simulation experiments suggest that NADH- and NADPH-dependent methemoglobin-reducing pathways have different but important roles: one has a high-elasticity, small-capacity reducing flux while the other has a low elasticity, high-capacity flux. This section also showed the necessity and effectiveness of using mathematical models to predict when and how the particular pathways work as a system in the various physiological conditions where experimental verification is difficult.
In Prediction by Mathematical Modeling and its Verification by Metabolome Analysis for Oxygen Sensing Mechanism in Human Erythrocytes, the example for the intercommunication between the simulation and the experiment was shown. Temporal alterations in metabolites predicted in the mathematical model, including the effects of BIII interactions with Hb and the glycolytic enzymes, are in good agreement with results obtained from the metabolome analyses using CE-MS, which has recently emerged as a powerful tool for the global analysis of charged metabolites.56 In contrast, the virtual model lacking the effects of the Hb-BIII interaction was unable to reproduce actual alterations in the metabolites, suggesting a pivotal role for this molecular interaction in the maintenance of erythrocyte energetics. Furthermore, a coordinated increase in the energy charge and 2,3-BPG was predicted when the mid-way glycolytic enzymes, but not up- or down-stream rate-limiting enzymes, are activated in response to the hypoxia-induced Hb binding to BIII. Furthermore, the hypoxia-induced activation of glycolysis was not observed when Hb was stabilized in R-state by treating the cells with CO. Under these circumstances, it can be suggested that Hb allostery in erythrocytes serves as an oxygen-sensing trigger that drives glycolytic acceleration to sustain intracellular energetics and to promote the ability to release oxygen from the cells through the rational design of metabolism.
The above simulation studies enabled us to see the rational design of metabolic pathways in human erythrocytes as an evolutionarily optimized system. Mathematical models can be applied not only for straightforward simulations, but also for explanations of the nature of network properties complying nonlinear dynamics in the cell.
On the other hand, the models do not include certain aspects of red blood cell metabolism, such as the oxidation of membrane proteins which are rapidly oxidized during elimination of H2O2, the direct inhibition of G6PDH by reactive oxygen species. Furthermore, many physical viewpoints have not yet been considered: the maintenance of cellular status through regulating intracellular pH, membrane potential, cell volume in connection with ion balances and cell shapes. They may be significant for considering the in vivo state of the cell.57 Another limitation of the current models is the lack of spatial information and diffusion processes. Because erythrocytes do not contain any cell organelle in cytoplasm, the intracellular system has been assumed as homogeneous in space. However, recent observations showed that glycolytic enzymes form a macromolecular complex and the complex changes its localization in response to oxygen availability,52 suggesting the importance of considering the spatial effect even when the model focuses on the metabolic reactions. E-Cell System will be a suitable platform for considering these features in more precise modeling.
Acknowledgements
I sincerely acknowledge my gratitude to Prof. Makoto Suematsu at the school of medicine of Keio University and to Prof. Tomoyoshi Soga for critical discussions and providing new perspectives, especially for the interrelation between experimental and simulation studies. The works in this chapter were carried out in association with Yoichi Nakayama (section 2 and 3), Tomoya Kitayama (section 3), Dr. Kosuke Tsukada (section 4) and Dr. Takako Hishiki (section 4). These works were supported by grants from the Japan Society for the Promotion of Science ( JSPS), supported in part by the Ministry of Education, Culture, Sports, Science and Technology, with a Grant-in-Aid for the 21st Century Center of Excellence (COE) Program entitled “Understanding and Control of Life's Function via Systems Biology (Keio University)” and by Core Research for Evolutional Science and Technology (CREST) of Japan Science and Technology Agency ( JST).
References
- 1.
- Rapoport TA, Otto M, Heinrich R. An extended model of the glycolysis in erythrocytes. Acta Biol Med Ger. 1997;36:461–8. [PubMed: 145774]
- 2.
- Heinrich R, Rapoport SM, Rapoport TA. Metabolic regulation and mathematical models. Prog Biophys Mol Biol. 1977;32:1–82. [PubMed: 343173]
- 3.
- Rapoport TA, Heinrich R, Rapoport SM. The regulatory principles of glycolysis in erythrocytes in vivo and in vitro. A minimal comprehensive model describing steady states, quasi-steady states and time-dependent processes. Biochem J. 1976;154:449–69. [PMC free article: PMC1172726] [PubMed: 132930]
- 4.
- Ataullakhanov FI, Vitvitsky VM, Zhabotinsky AM. et al. The regulation of glycolysis in human erythrocytes. The dependence of the glycolytic flux on the ATP concentration. Eur J Biochem. 1981;115:359–65. [PubMed: 7238510]
- 5.
- Schauer M, Heinrich R, Rapoport SM. [Mathematical modelling of glycolysis and adenine nucleotide metabolism of human erythrocytes. I. Reaction-kinetic statements, analysis of in vivo state and determination of starting conditions for in vitro experiments] Acta Biol Med Ger. 1981;40:1659–82. [PubMed: 6285649]
- 6.
- Joshi A, Palsson BO. Metabolic dynamics in the human red cell. Part I-- A comprehensive kinetic model. J Theor Biol. 1989;141:515–28. [PubMed: 2630803]
- 7.
- Joshi A, Palsson BO. Metabolic dynamics in the human red cell. Part II-- Interactions with the environment. J Theor Biol. 1989;141:529–45. [PubMed: 2630804]
- 8.
- Joshi A, Palsson BO. Metabolic dynamics in the human red cell. Part III-- Metabolic reaction rates. J Theor Biol. 1990;142:41–68. [PubMed: 2141093]
- 9.
- Joshi A, Palsson BO. Metabolic dynamics in the human red cell. Part IV-- Data prediction and some model computations. J Theor Biol. 1990;142:69–85. [PubMed: 2141094]
- 10.
- Mulquiney PJ, Bubb WA, Kuchel PW. Model of 2,3-bisphosphoglycerate metabolism in the human erythrocyte based on detailed enzyme kinetic equations: in vivo kinetic characterization of 2,3-bisphosphoglycerate synthase/phosphatase using 13C and 31P NMR. Biochem J. 1999;342 Pt 3: 567–80. [PMC free article: PMC1220498] [PubMed: 10477268]
- 11.
- Mulquiney PJ, Kuchel PW. Model of 2,3-bisphosphoglycerate metabolism in the human erythrocyte based on detailed enzyme kinetic equations: equations and parameter refinement. Biochem J. 1999;342 Pt 3:581–96. [PMC free article: PMC1220499] [PubMed: 10477269]
- 12.
- Nakayama Y, Kinoshita A, Tomita M. Dynamic simulation of red blood cell metabolism and its application to the analysis of a pathological condition. Theor Biol Med Model. 2005;2:18. [PMC free article: PMC1142344] [PubMed: 15882454]
- 13.
- Kinoshita A, Nakayama Y, Kitayama T. et al. Simulation study of methemoglobin reduction in erythrocytes. Differential contributions of two pathways to tolerance to oxidative stress. Febs J. 2007;274:1449–58. [PubMed: 17489100]
- 14.
- Kinoshita A, Tsukada K, Soga T. et al. Roles of hemoglobin Allostery in hypoxia-induced metabolic alterations in erythrocytes: simulation and its verification by metabolome analysis. J Biol Chem. 2007;282:10731–41. [PubMed: 17289676]
- 15.
- Ferretti A, Bozzi A, Di Vito, M. et al. 13C and 31P NMR studies of glucose and 2-deoxyglucose metabolism in normal and enzyme-deficient human erythrocytes. Clin Chim Acta. 1992;208:39–61. [PubMed: 1638753]
- 16.
- Meister A. Glutathione, metabolism and function via the gamma-glutamyl cycle. Life Sci. 1974;15:177– 90. [PubMed: 4620960]
- 17.
- Srivastava SK, Beutler E. The transport of oxidized glutathione from human erythrocytes. J Biol Chem. 1969;244:9–16. [PubMed: 5773294]
- 18.
- Kondo T, Beutler E. Developmental changes in glucose transport of guinea pig erythrocytes. J Clin Invest. 1980;65:1–4. [PMC free article: PMC371333] [PubMed: 7350191]
- 19.
- Hebbel RP. Erythrocyte antioxidants and membrane vulnerability. J Lab Clin Med. 1986;107:401–4. [PubMed: 3701187]
- 20.
- Rice-Evans C, Omorphos SC, Baysal E. Sickle cell membranes and oxidative damage. Biochem J. 1986;237:265–9. [PMC free article: PMC1146974] [PubMed: 3800879]
- 21.
- Jaffe ER. Methaemoglobinaemia. Clin Haematol. 1981;10:99–122. [PubMed: 7011627]
- 22.
- Mansouri A, Lurie AA. Concise review: methemoglobinemia. Am J Hematol. 1993;42:7–12. [PubMed: 8416301]
- 23.
- Yubisui T, Takeshita M. Purification and properties of soluble NADH-cytochrome b5 reductase of rabbit erythrocytes. J Biochem (Tokyo). 1982;91:1467–77. [PubMed: 7096301]
- 24.
- Yubisui T, Murakami K, Shirabe K. et al. Structural analysis of NADH-cytochrome b5 reductase in relation to hereditary methemoglobinemia Prog Clin Biol Res1989319107–19. discussion 120-1. [PubMed: 2695933]
- 25.
- Yubisui T, Takeshita M, Yoneyama Y. Reduction of methemoglobin through flavin at the physiological concentration by NADPH-flavin reductase of human erythrocytes. J Biochem (Tokyo). 1980;87:1715–20. [PubMed: 7400118]
- 26.
- Hultquist DE, Passon PG. Catalysis of methaemoglobin reduction by erythrocyte cytochrome B5 and cytochrome B5 reductase. Nat New Biol. 1971;229:252–4. [PubMed: 4324110]
- 27.
- Wang Y, Wu YS, Zheng PZ. et al. A novel mutation in the NADH-cytochrome b5 reductase gene of a Chinese patient with recessive congenital methemoglobinemia. Blood. 2000;95:3250–5. [PubMed: 10807796]
- 28.
- Yubisui T, Matsuki T, Takeshita M. et al. Characterization of the purified NADPH-flavin reductase of human erythrocytes. J Biochem (Tokyo). 1979;85:719–28. [PubMed: 34598]
- 29.
- Quandt KS, Hultquist DE. Flavin reductase: sequence of cDNA from bovine liver and tissue distribution. Proc Natl Acad Sci U S A. 1994;91:9322–6. [PMC free article: PMC44804] [PubMed: 7937764]
- 30.
- Zhu H, Qiu H, Yoon HW. et al. Identification of a cytochrome b-type NAD(P)H oxidoreductase ubiquitously expressed in human cells. Proc Natl Acad Sci U S A. 1999;96:14742–7. [PMC free article: PMC24718] [PubMed: 10611283]
- 31.
- Salvador A, Savageau MA. Quantitative evolutionary design of glucose 6-phosphate dehydrogenase expression in human erythrocytes. Proc Natl Acad Sci U S A. 2003;100:14463–8. [PMC free article: PMC283614] [PubMed: 14614139]
- 32.
- Salvador A, Savageau MA. Evolution of enzymes in a series is driven by dissimilar functional demands. Proc Natl Acad Sci U S A. 2006;103:2226–31. [PMC free article: PMC1413729] [PubMed: 16461898]
- 33.
- Higasa K, Manabe JI, Yubisui T. et al. Molecular basis of hereditary methaemoglobinaemia, types I and II: two novel mutations in the NADH-cytochrome b5 reductase gene. Br J Haematol. 1998;103:922–30. [PubMed: 9886302]
- 34.
- Kuma F. Properties of methemoglobin reductase and kinetic study of methemoglobin reduction. J Biol Chem. 1981;256:5518–23. [PubMed: 7240153]
- 35.
- Abe K, Sugita Y. Properties of cytochrome b5 and methemoglobin reduction in human erythrocytes. Eur J Biochem. 1979;101:423–8. [PubMed: 520306]
- 36.
- Cunningham O, Gore MG, Mantle TJ. Initial-rate kinetics of the flavin reductase reaction catalysed by human biliverdin-IXbeta reductase (BVR-B). Biochem J. 2000;345 Pt 2:393–9. [PMC free article: PMC1220769] [PubMed: 10620517]
- 37.
- Kuma F, Inomata H. Studies on methemoglobin reductase. II. The purification and molecular properties of reduced nicotinamide adenine dinucleotide-dependent methemoglobin reductase. J Biol Chem. 1972;247:556–60. [PubMed: 4333267]
- 38.
- Yubisui T, Matsukawa S, Yoneyama Y. Stopped flow studies on the nonenzymatic reduction of methemoglobin by reduced flavin mononucleotide. J Biol Chem. 1980;255:11694–7. [PubMed: 7440566]
- 39.
- Curry S. Methemoglobinemia. Ann Emerg Med. 1982;11:214–21. [PubMed: 7073040]
- 40.
- Grimes A. Human Red Cell Metabolism. In:Blackwell Scientific Publications, Oxford. 1980
- 41.
- Nagababu E, Rifkind JM. Reaction of hydrogen peroxide with ferrylhemoglobin: superoxide production and heme degradation. Biochemistry. 2000;39:12503–11. [PubMed: 11015232]
- 42.
- Bulbarelli A, Valentini A, DeSilvestris M. et al. An erythroid-specific transcript generates the soluble form of NADH-cytochrome b5 reductase in humans. Blood. 1998;92:310–9. [PubMed: 9639531]
- 43.
- Board PG, Agar NS, Gruca M. et al. Methaemoglobin and its reduction in nucleated erythrocytes from reptiles and birds. Comp Biochem Physiol B. 1977;57:265–7. [PubMed: 299636]
- 44.
- Sullivan SG, Stern A. Glucose metabolism of oxidatively stressed human red blood cells incubated in plasma or medium containing physiologic concentrations of lactate, pyruvate and ascorbate. Biochem Pharmacol. 1984;33:1417–21. [PubMed: 6732859]
- 45.
- Zerez CR, Lachant NA, Tanaka KR. Impaired erythrocyte methemoglobin reduction in sickle cell disease: dependence of methemoglobin reduction on reduced nicotinamide adenine dinucleotide content. Blood. 1990;76:1008–14. [PubMed: 2393709]
- 46.
- Desagher S, Glowinski J, Premont J. Pyruvate protects neurons against hydrogen peroxide-induced toxicity. J Neurosci. 1997;17:9060–7. [PMC free article: PMC6573585] [PubMed: 9364052]
- 47.
- Lee YJ, Kang IJ, Bunger R. et al. Enhanced survival effect of pyruvate correlates MAPK and NF-kappaB activation in hydrogen peroxide-treated human endothelial cells J Appl Physiol 200496793–801. discussion 792. [PubMed: 14578369]
- 48.
- Cerdan S, Rodrigues TB, Sierra A, Benito M. et al. The redox switch/redox coupling hypothesis. Neurochem Int. 2006;48:523–30. [PubMed: 16530294]
- 49.
- Murphy JR. Erythrocyte metabolism. II. Glucose metabolism and pathways. J Lab Clin Med. 1960;55:286–302. [PubMed: 14425397]
- 50.
- Ellsworth ML, Forrester T, Ellis CG. et al. The erythrocyte as a regulator of vascular tone. Am J Physiol. 1995;269:H2155–61. [PubMed: 8594927]
- 51.
- Tsuneshige A, Imai K, Tyuma I. The binding of hemoglobin to red cell membrane lowers its oxygen affinity. J Biochem (Tokyo). 1987;101:695–704. [PubMed: 3597347]
- 52.
- Campanella ME, Chu H, Low PS. Assembly and regulation of a glycolytic enzyme complex on the human erythrocyte membrane. Proc Natl Acad Sci U S A. 2005;102:2402–7. [PMC free article: PMC549020] [PubMed: 15701694]
- 53.
- Dash RK, Bassingthwaighte JB. Blood HbO2 and HbCO2 dissociation curves at varied O2, CO2, pH, 2,3-DPG and temperature levels. Ann Biomed Eng. 2004;32:1676–93. [PubMed: 15682524]
- 54.
- Suganuma K, Tsukada K, Kashiba M. et al. Erythrocytes with T-state-stabilized hemoglobin as a therapeutic tool for postischemic liver dysfunction. Antioxid Redox Signal. 2006;8:1847–55. [PubMed: 16987037]
- 55.
- Tsai AG, Johnson PC, Intaglietta M. Oxygen gradients in the microcirculation. Physiol Rev. 2003;83:933–63. [PubMed: 12843412]
- 56.
- Soga T, Baran R, Suematsu M. et al. Differential metabolomics reveals ophthalmic acid as an oxidative stress biomarker indicating hepatic glutathione consumption. J Biol Chem. 2006;281:16768–76. [PubMed: 16608839]
- 57.
- Kuchel PW. Current status and challenges in connecting models of erythrocyte metabolism to experimental reality. Prog Biophys Mol Biol. 2004;85:325–42. [PubMed: 15142750]
Publication Details
Author Information and Affiliations
Authors
Ayako Kinoshita*.Affiliations
Copyright
Publisher
Landes Bioscience, Austin (TX)
NLM Citation
Kinoshita A. Simulation of Human Erythrocyte Metabolism. In: Madame Curie Bioscience Database [Internet]. Austin (TX): Landes Bioscience; 2000-2013.