U.S. flag

An official website of the United States government

NCBI Bookshelf. A service of the National Library of Medicine, National Institutes of Health.

National Clinical Guideline Centre (UK). Psoriasis: Assessment and Management of Psoriasis. London: Royal College of Physicians (UK); 2012 Oct. (NICE Clinical Guidelines, No. 153.)

  • Update information September 2017: The guideline has been revised throughout to link to MHRA advice and NICE technology appraisals that have been completed since original publication. Minor updates since publication August 2019: Links to the MHRA safety advice on the risk of using retinoids in pregnancy have been updated to the June 2019 version.

Update information September 2017: The guideline has been revised throughout to link to MHRA advice and NICE technology appraisals that have been completed since original publication. Minor updates since publication August 2019: Links to the MHRA safety advice on the risk of using retinoids in pregnancy have been updated to the June 2019 version.

Cover of Psoriasis

Psoriasis: Assessment and Management of Psoriasis.

Show details

Appendix KNetwork meta-analysis topicals trunk and limbs

K.1. Clinical question

In people with chronic plaque psoriasis: what are the clinical effectiveness, safety, tolerability and cost-effectiveness of topical vitamin D or vitamin D analogues, potent or very potent corticosteroids, tar, dithranol and retinoids?

K.2. Introduction

The results of conventional meta-analyses of direct evidence alone (as presented in Chapter 8) make it difficult to determine which intervention is most effective in the treatment of chronic plaque psoriasis. The challenge of interpretation has arisen for two reasons:

  • Some pairs of alternative strategies have not been directly compared in a randomised controlled trial (for example, concurrent vitamin D or vitamin D analogues and potent corticosteroid vs combined vitamin D or vitamin D analogues and potent corticosteroid)
  • There are frequently multiple overlapping comparisons (for example vitamin D or vitamin D analogues vs potent corticosteroid, vitamin D or vitamin D analogues vs combined vitamin D or vitamin D analogues and potent corticosteroid and potent corticosteroid vs combined vitamin D or vitamin D analogues and potent corticosteroid) that could potentially give inconsistent estimates of effect.

To overcome these problems, a hierarchical Bayesian network meta-analysis (NMA) was performed. This type of analysis allows for the synthesis of data from direct and indirect comparisons and allows for the ranking of different interventions in order of efficacy, defined as the achievement of clearance or near clearance. The analysis also provides estimates of effect (with 95% credible interval, the Bayesian equivalent of a confidence interval) for each intervention compared to one another and compared to a single baseline risk. These estimates provide a useful clinical summary of the results and facilitate the formation of recommendations based on the best available evidence. Furthermore, these estimates were used to parameterise treatment effectiveness of the topical therapies in the original cost-effectiveness modelling (see Appendix M).

Conventional meta-analysis assumes that for a fixed effect analysis, the relative effect of one treatment compared to another is the same across an entire set of trials. In a random effects model, it is assumed that the relative effects are different in each trial but that they are from a single common distribution and that this distribution is common across all sets of trials.

Network meta-analysis requires an additional assumption over conventional meta-analysis. The additional assumption is that intervention A has the same relative effect across all trials of intervention A compared to intervention B as it does across trials of intervention A versus intervention C, and so on. Thus, in a random effect network meta-analysis, the assumption is that intervention A has the same effect distribution across all trials of A versus B, A versus C and so on.

K.3. Methods

K.3.1. Study selection and data collection

To estimate the odds ratios and relative risks, we performed a NMA that simultaneously used all the relevant randomised controlled trial evidence from the clinical evidence review (presented in Chapter 8). As with conventional meta-analyses, this type of analysis does not break the randomisation of the evidence, nor does it make any assumptions about adding the effects of different interventions. The effectiveness of a particular treatment strategy combination will be derived only from randomised controlled trials that had that particular combination in a trial arm.

The inclusion criteria for the base case NMA were the same as in the clinical review (section 8.1.1), except that the one study1 containing only children was not included. However, it was included in a sensitivity analysis.

The outcomes considered as part of the NMA were restricted to those measuring response:

  • Clear/nearly clear or marked improvement (at least 75% improvement) on Investigator’s assessment of overall global improvement (IAGI) or clear/nearly clear/minimal (not mild) on Physician’s Global Assessment (PGA)
  • Clear/nearly clear or marked improvement (at least 75% improvement) on Patient’s assessment of overall global improvement (PAGI) or clear/nearly clear/minimal (not mild) on Patient’s Global Assessment

Some included studies will have reported both outcomes, whereas some will have only included one or the other. For this reason, two networks of evidence were developed and analysed.

As noted in the review of direct evidence, the preferred figures for the network meta-analysis were based on a modified available case analysis (whereby patients known to have dropped out due to lack of efficacy are included in the denominator for efficacy outcomes and those known to have dropped out due to adverse events are included in the numerator and denominator when analysing adverse events). This method was used rather than intention-to-treat analysis to avoid making assumptions about the participants for whom outcome data were not available.

However, when the data were presented as an ITT analysis in the study it was not possible to modify this to an available case analysis as insufficient detail was provided. This was the case in 36 studies for efficacy outcomes. In the remaining 14 studies ACA figures as reported in the paper were used216. However, it was still possible to use a modified available case analysis for withdrawal outcomes for most studies, apart from in one study where data were taken from the Cochrane review, which reported on the ITT population 17, and one study for which withdrawals were not reported by group3.

K.3.2. Interventions

The interventions compared in the NMAs were those found in the randomised controlled trials included in the clinical evidence review (see Chapter 8). In order to reduce heterogeneity in the network, interventions were broken down by treatment frequency from the outset. In other words, once daily vitamin D or vitamin D analogues and twice daily vitamin D or vitamin D analogues were considered separate comparators in the NMA. Placebo/vehicle delivered once daily was also considered separately from twice daily placebo/vehicle.

The interventions included were

  • Vehicle/Placebo once daily (OD)
  • Vehicle/Placebo twice daily (BD)
  • Vitamin D or vitamin D analogue OD
  • Vitamin D or vitamin D analogue BD
  • Potent corticosteroid OD
  • Potent corticosteroid BD
  • Very potent corticosteroid OD
  • Very potent corticosteroid BD
  • Combined vitamin D or vitamin D analogues and potent corticosteroid OD
  • Concurrent vitamin D or vitamin D analogues and potent corticosteroid (morning and evening application, respectively)
  • Retinoid OD (tazarotene)
  • Coal tar OD
  • Coal tar BD
  • Dithranol OD

K.3.3. Baseline risk

The baseline risk is defined here as a person’s ‘risk,’ or probability, of achieving clearance or near clearance with no active treatment other than vehicle/placebo. This figure is useful because it allows us to convert the results of the NMA from odds ratios to relative risks.

Deriving the figure from our randomised controlled trials involved aggregating the number of patient’s achieving ‘clear’ or ‘nearly clear’ across the vehicle/placebo arms of studies included in our NMA and dividing by the aggregate sample size from the same arms. Because there appeared to be a difference between the likelihood of response between once daily and twice daily vehicle/placebo, twice daily vehicle/placebo was chosen as the baseline comparator for both networks of evidence.

Using this method produced a baseline probability of 12.5% (95% CI: 10.4% to 14.6%) for achieving clearance or near clearance as measured by IAGI and PGA.

Using this method produced a baseline probability of 14.4% (95% CI: 11.7% to 17.0%) for achieving clearance or near clearance as measured by PAGI.

K.3.4. Statistical analysis

A hierarchical Bayesian network meta-analysis (NMA) was performed using the software WinBUGS19. We adapted a multi-arm random effects model template from the University of Bristol website (https://www.bris.ac.uk/cobm/research/mpes/mtc.html). This model accounts for the correlation between arms in trials with any number of trial arms. The code can be found towards the end of this appendix ()

In order to be included in the analysis, a fundamental requirement is that each treatment is connected directly or indirectly to every other intervention in the network. For each population and outcome subgroup, a diagram of the evidence network was produced (Figure 342 and Figure 345) and is presented in section K.4.

Figure 342. Clear or nearly clear – IAGI and PGA.

Figure 342

Clear or nearly clear – IAGI and PGA. Note: Solid lines indicate direct head-to-head comparisons and the colour indicates the number of trials per comparison included in the base case. Dashed lines indicate all head-to-head comparisons included (more...)

Figure 345. Clear or nearly clear - PAGI.

Figure 345

Clear or nearly clear - PAGI. Note: Solid lines indicate direct head-to-head comparisons and the colour indicates the number of trials per comparison included in the base case. Dashed lines indicate all head-to-head comparisons included in the sensitivity (more...)

The model used was a random effects logistic regression model, with parameters estimated by Markov chain Monte Carlo Simulation. As it was a Bayesian analysis, the evidence distribution is weighted by a distribution of prior beliefs. A non-informative prior distribution was used to maximise the weighting given to the data. These priors were normally distributed with a mean of 0 and standard deviation of 10,000.

For each analysis, a series of 20,000 burn-in simulations were run to allow convergence and then a further 40,000 simulations were run to produce the outputs. Convergence was assessed by examining the history and kernel density plots.

We tested the goodness of fit of the model by calculating the residual deviance. If the residual deviance is close to the number of unconstrained data points (the number of trial arms in the analysis) then the model is explaining the data well.

The results, in terms of relative risk, of pair-wise meta-analyses are presented in the clinical evidence review (see Chapter 8). In preparation for the NMA, these conventional meta-analyses were re-run to produce odds ratios and these are presented as part of the NMA results section.

The outputs of the NMA were odds ratios. Odds ratios and their 95% credible intervals were generated for every possible pair of comparisons by combining direct and indirect evidence in the network. To be consistent with the comparative effectiveness results presented elsewhere in the clinical evidence review and for ease of interpretation, relative risks were computed from the outputs of the NMA. Relative risks (RR) were derived from the odds ratios for each intervention compared back to a single ‘no treatment’ baseline risk, using the baseline risk as described above and the following formula:

RR=OR1-P0(1-OR)

where Po is the baseline risk.

We estimated the RR for each of the 40,000 simulations, treating Po as a constant. The point estimate of the RR was taken to be the median of the 40,000 simulations and the 95% credible intervals for the RR were taken to be the 2.5th and 97.5th centiles from the distribution of the RR.

We also assessed the probability that each intervention was the best treatment by calculating the relative risk of each intervention compared to once daily vehicle/placebo, and counting the proportion of simulations of the Markov chain in which each intervention had the highest relative risk. Using this same method, we also calculated the overall ranking of interventions according to their relative risk compared to once daily vehicle/placebo.

A key assumption behind NMA is that the network is consistent. In other words, it is assumed that the direct and indirect treatment effect estimates do not disagree with one another. Discrepancies between direct and indirect estimates of effect may result from several possible causes. First, there is chance and if this is the case then the network meta-analysis results are likely to be more precise as they pool together more data than conventional meta-analysis estimates alone. Second, there could be differences between the trials included in terms of their clinical or methodological characteristics. Differences that could lead to inconsistency include:

  • Different populations (e.g. sex, age, baseline severity)
  • Different interventions (e.g. product, dose, vehicle type)
  • Different measures of outcome (different scales for IAGI and PGA; PAGI)
  • Different follow-up periods (e.g. 2 weeks, 4 weeks, 6 weeks, 8 weeks)

This heterogeneity is a problem for network meta-analysis and should be dealt with by subgroup analysis and sometimes by re-defining inclusion criteria. Inconsistency in the direct evidence, caused by heterogeneity, was assessed using Bucher’s method, comparing the odds ratios from the pairwise meta-analysis wherever a loop of direct evidence was available. We also explored inconsistency by comparing the odds ratios from the direct evidence (from pair-wise meta-analysis) to the odds ratios from the combined direct and indirect evidence (from NMA). We performed a significance test to determine whether the differences between estimates of effect from the pair-wise meta-analyses and network meta-analyses were statistically significant. No significant inconsistency using either method was identified.

K.4. Results

A total of 37 studies310,1416,1843 from the original evidence review met the inclusion criteria for the base case in at least one network - 34 studies for the IAGI/PGA network and 14 for the PAGI network. An additional 3 studies1,44,45 were included in the IAGI/PGA network sensitivity analysis and an additional 2 studies1,26 were included in the PAGI network sensitivity analysis. Table 1 presents all the available data used in the base case analysis for both investigator and patient assessed outcomes. Figure 342 and Figure 345 show the 2 networks created by eligible comparisons for each NMA. Of the 105 possible pair-wise comparisons between the 14 interventions in the networks, 22 have been compared directly in at least one trial. Based on the GRADE quality ratings from the review of direct comparisons (Chapter 8 of full guideline), the evidence included in the network meta-analysis ranges in quality from very low to moderate.

Table 1. Study characteristics and IAGI/PGA and PAGI efficacy data used in networks.

Table 1

Study characteristics and IAGI/PGA and PAGI efficacy data used in networks.

K.4.1. Clear/nearly clear as measured by IAGI or PGA

Figure 1 presents all the interventions included in the NMA as well as shows where there is direct evidence for a particular comparison and the number of studies that have included that comparison. For example, there are 7 studies reporting the outcome ‘clear’ or ‘nearly clear’ as measured by IAGI or PGA for the comparison of twice daily vehicle/placebo and twice daily vitamin D or vitamin D analogues. The diagram also highlights where there are gaps in the direct evidence. For example, there are no studies comparing combined vitamin D or vitamin D analogues and potent corticosteroid to concurrent vitamin D or vitamin D analogues and potent corticosteroid.

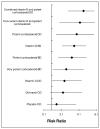
Table 2 presents the relative risk of each intervention compared to once daily vehicle/placebo. It also gives a probability that the intervention is the most effective overall. Figure 343 presents these estimates and their uncertainty as a forest plot.

Table 2. Relative risks of clear/nearly clear on IAGI/PGA for all interventions compared to twice daily vehicle/placebo.

Table 2

Relative risks of clear/nearly clear on IAGI/PGA for all interventions compared to twice daily vehicle/placebo.

Figure 343. Relative risks for all interventions compared to twice daily vehicle/placebo.

Figure 343

Relative risks for all interventions compared to twice daily vehicle/placebo.

Based on the relative risk estimates, it would appear that all active interventions with the exceptions of once daily coal tar and once daily retinoid are more likely to induce clearance or near clearance than twice daily vehicle/placebo. Twice daily vehicle/placebo appears to perform slightly better than once daily, but the effect is not statistically significant.

It is difficult to observe differences between active comparators based on the relative risk estimates presented in Table 2 and Figure 343. The NMA also produced odds ratios for every possible pair-wise comparison, regardless of whether they have been compared directly in a clinical trial. These estimates, presented in Figure 344, indicate that there are very few comparisons for which the treatment effect reaches statistical significance.

Figure 344. Odds ratios for clear/nearly clear as measured by IAGI or PGA, results of conventional and network meta-analyses.

Figure 344

Odds ratios for clear/nearly clear as measured by IAGI or PGA, results of conventional and network meta-analyses. Note: Results in the white area are the odds ratios and 95% confidence intervals from the conventional meta-analyses of direct evidence between (more...)

A few exceptions include:

  • Once daily combined vitamin D or vitamin D analogues and potent corticosteroid are more effective than once daily vitamin D or vitamin D analogues
  • Once daily combined vitamin D analogue and potent corticosteroid is more effective than once daily potent corticosteroid and once daily retinoid
  • Twice daily very potent corticosteroid is more effective than once daily retinoid and once daily dithranol
  • Twice daily vitamin D or vitamin D analogues, twice daily potent corticosteroids, twice daily very potent corticosteroids, combined and concurrent vitamin D or vitamin D analogues and potent corticosteroids are all more effective than once daily coal tar

In terms of the probability of being most effective, in nearly half of all simulations (48%), twice daily very potent corticosteroid emerges as the most effective topical. In a further 25% of simulations, once daily very potent corticosteroid emerged as the most effective topical. This means that in nearly three quarters of all simulations, very potent corticosteroids were the most effective topical among all topical therapies evaluated. Combined and concurrent vitamin D or vitamin D analogues and potent corticosteroid were most effective in 13% and 8% of simulations, respectively.

In addition to the probability that a given treatment is most effective, the network meta-analysis also provides an indication of the overall rank of topical treatments in terms of their relative effectiveness. This statistic gives us an indication of the confidence we might have in a particular treatment being among the best or among the worst relative to the other treatments available. For example, the results show us that once and twice daily vehicle/placebo are consistently the least effective topical therapies, rarely ranking better than 3rd least effective among the 40,000 simulations.

As for active treatments, the results indicate that with the exception of very potent corticosteroid and combined vitamin D or vitamin D analogues and potent corticosteroid, once daily application of any topical ranks far lower in terms of effectiveness than twice daily application of any topical. In other words, once daily application of potent corticosteroid, vitamin D or vitamin D analogue, dithranol, retinoid and coal tar were consistently among the least effective topical interventions.

Twice daily application of potent corticosteroid, vitamin D or vitamin D analogues and coal tar all rank consistently in the middle of all 14 comparators (i.e. 4th, to 7th most effective). They are neither the most effective nor the least effective.

As indicated by the high relative risks for twice daily very potent corticosteroid and combined or concurrent vitamin D or vitamin D analogues and potent corticosteroid, these were consistently ranked among the most effective (i.e. most to 3rd most effective).

The residual deviance of the base case model was 85.23, with the number of unconstrained data points being 78. The closeness of these values indicates a reasonably good model fit. No significant inconsistency was identified between the odds ratios generated from pairwise meta-analyses of the available direct evidence and the odds ratios generated from the network meta-analyses of direct and indirect comparisons. However, some of the point estimates were somewhat different between the pairwise and network analyses. Notably the odds ratio for combined treatment versus once daily placebo was 12.1 in the pair-wise analysis and 22.6 in the network analysis. We can offer two explanations for this. First, the sample odds ratio from the Fleming 2010 trial is infinite (since there were zero events in the placebo arm. For the pair-wise analysis, RevMan would have added 0.5 to each cell, whereas the network meta-analysis being in the form of a logistic regression does not need to make such an assumption. Second indirect evidence within the network points to a larger effect size; for example the Guenther 2002 trial indicates an odds ratio for combined vs twice daily placebo of 17.0, implying an even bigger odds ratio compared to once daily placebo. For these reasons the credible interval from the network meta-analysis was wider than the confidence interval from the pairwise comparison.

K.4.6. Clear/nearly clear as measured by PAGI

Figure 345 presents all the interventions included in the NMA as well as shows where there is direct evidence for a particular comparison and the number of studies that have included that comparison. From the diagram, one can see that fewer studies have reported PAGI. There are 4 studies reporting the outcome of ‘clear’ or ‘nearly clear’ as measured by PAGI (in contrast to 7 studies reporting for IAGI or PGA) for the comparison of twice daily vehicle/placebo and twice daily vitamin D or vitamin D analogues.

Table 3 presents the relative risk of each intervention compared to twice daily vehicle/placebo. It also gives a probability that the intervention is the most effective overall. Figure 346 presents these estimates and their uncertainty as a forest plot.

Table 3. Relative risks of clear/nearly clear with PAGI for all interventions compared to twice daily vehicle/placebo.

Table 3

Relative risks of clear/nearly clear with PAGI for all interventions compared to twice daily vehicle/placebo.

Figure 346. Relative risks of clear/nearly clear on PAGI for all interventions compared to twice daily vehicle/placebo.

Figure 346

Relative risks of clear/nearly clear on PAGI for all interventions compared to twice daily vehicle/placebo.

Based on the relative risk estimates, it would appear that all active interventions are more likely to induce clearance or near clearance than twice daily vehicle/placebo, although the results for once daily dithranol and once daily vitamin D or vitamin D analogues fail to reach statistical significance. A slightly counterintuitive finding is that once daily vehicle/placebo appears to perform slightly better than twice daily when using the patient reported outcome measure, but the effect is not statistically significant.

It is difficult to observe differences between active comparators based on the relative risk estimates presented in Table 3 and Figure 346. The NMA also produced odds ratios for every possible pair-wise comparison, regardless of whether they have been compared in a clinical trial. These estimates indicate that there are only two comparisons between active agents for which the treatment effect reaches statistical significance: Once daily combined vitamin D or vitamin D analogues and potent corticosteroid is more effective than once daily vitamin D or vitamin D analogues and more effective than once daily dithranol.

Figure 347. Odds ratios for clear/nearly clear as measured by PAGI, results of conventional and network meta-analyses.

Figure 347

Odds ratios for clear/nearly clear as measured by PAGI, results of conventional and network meta-analyses. Note: Results in the white area are the odds ratios and 95% confidence intervals from the conventional meta-analyses of direct evidence between (more...)

In terms of the probability of being most effective, in just over half of all simulations (51%), once daily combined vitamin D or vitamin D analogues and potent corticosteroid emerges as the most effective topical. In a further 28% of simulations concurrent vitamin D or vitamin D analogues and potent corticosteroid emerges as the most effective topical strategy. This means that in nearly 75% of all simulations, a combination of vitamin D or vitamin D analogues and potent corticosteroid, applied separately in two products or applied together in one product, was the most effective topical among all topical therapies evaluated. Once daily potent corticosteroid was the most effective treatment in just 12% of simulations. These results are markedly different from the results based on the investigator assessed outcome (IAGI/PGA) where very potent corticosteroids had a 75% probability of being most effective. This is likely due to differences in the availability of data between investigator assessed and patient assessed outcomes.

As for the investigator assessed outcome (IAGI/PGA), the network meta-analysis provides an indication of the overall rank of topical treatments in terms of their relative effectiveness as assessed by the patient him/herself. The results in terms of rank appear to differ between the patient assessed and investigator assessed outcomes, potentially for two reasons. First, there was less PAGI data available to inform estimates of effect than IAGI/PGA data. This limitation could result in seemingly inconsistent measures of effect between the two outcomes. Secondly, it is possible that patient assessment of ‘clear or nearly clear’ differs from investigator assessment, and this could give rise to slightly different results.

As in the investigator assessed results, once and twice daily vehicle/placebo are consistently the least effective topical therapies, never ranking better than between least and 4th least effective.

As for active treatments, the results indicate that once daily application of vitamin D or vitamin D analogue and of dithranol were consistently among the least effective topical interventions.

The results also show that twice daily application of vitamin D or vitamin D analogues, potent corticosteroid and very potent corticosteroid perform moderately well overall, consistently ranking between 4th and 6th most effective. They are neither the most effective nor the least effective.

As indicated by the high relative risks for once daily potent corticosteroid and combined or concurrent vitamin D or vitamin D analogues and potent corticosteroid, these were consistently ranked among the most effective (i.e. most to 3rd most effective).

At odds with the results of the investigator assessed evidence is the result showing once daily potent corticosteroid to be more effective than both twice daily potent and very potent corticosteroid. This difference is more than likely caused by a difference in the study data available as opposed to a difference in assessment of efficacy or actual efficacy.

The residual deviance of the base case model was 32.79, with the number of unconstrained data points being 33. The closeness of these values indicates a good model fit.

K.5. Sensitivity Analyses

In a sensitivity analysis we explored the impact of a slightly different protocol on the results of the base case. In the sensitivity analysis, we included:

  • Two studies which were excluded from the review of direct evidence on the basis that they did not report an included comparison (even though each treatment being compared was included somewhere in the review). Hence these added greater statistical power to the analysis.
    • One study(Thawornchaisit, 2007) compared twice daily potent corticosteroid with twice daily crude coal tar.
    • Another study (Menter, 2009) compared once daily combined product containing vitamin D analogue and potent corticosteroid with twice daily very potent corticosteroid.
  • A study conducted entirely in children(Oranje, 1997).
  • A further comparator– twice daily combined vitamin D or vitamin D analogues and potent corticosteroid. It was excluded from the base case and the review of direct evidence because it is currently unlicensed at a twice daily application frequency. Although this did not add any new studies to the existing networks of evidence, it did mean that we would include an additional trial arm of several included studies.
  • Data from one study (Papp, 2003) for the PAGI outcome (it was excluded from the clinical review of direct evidence given that in the paper it was reported graphically).

The dashed lines in Figure 342 and Figure 345 present the network diagrams when these studies and comparators were included, for the clear/nearly clear outcomes as assessed by IAGI or PGA and PAGI, respectively.

Table 4 presents the relative risk of each intervention compared to twice daily vehicle/placebo for the outcome of clear/nearly clear on the investigator assessed outcome (IAGI/PGA). It also gives a probability that the intervention is the most effective overall in this sensitivity analysis as well as in the base case. This provides an easy way of comparing the results between the base case and the sensitivity analysis.

Table 4. Relative risks of clear/nearly clear on IAGI/PGA for all interventions compared to twice daily vehicle/placebo – Sensitvity analysis wherein all data and twice daily combined vitamin D analogue and potent corticosteroid are included.

Table 4

Relative risks of clear/nearly clear on IAGI/PGA for all interventions compared to twice daily vehicle/placebo – Sensitvity analysis wherein all data and twice daily combined vitamin D analogue and potent corticosteroid are included.

Results of the sensitivity analysis indicate two things. First, it demonstrates that the risk ratios from the base case for most topical therapies compared to twice daily vehicle/placebo are insensitive to the additional data. In other words, the median point estimates and their 95% credible intervals have changed very little, and therefore we can be confident in the treatment effect estimates generated in the base case.

Secondly, the results of the sensitivity analysis demonstrate how effective twice daily combined vitamin D analogue and potent corticosteroid is compared to alternatives. Indeed, when it is included as a relevant comparator, it emerges as the most effective strategy in nearly 50% of simulations. Interestingly, the pairwise odds ratios from the sensitivity analysis (Figure 348) indicate that based on direct evidence from one study (Guenther, 2002) alone, twice daily combined vitamin D analogue and potent corticosteroid is more effective than once daily (OR 1.61 (1.03 to 2.5). However, when all direct and indirect evidence is combined, this difference does not reach statistical significance (OR 1.77 (0.62 to 5.03)).

Figure 348. Odds ratios for clear/nearly clear as measured by IAGI or PGA, results of sensitivity analysis wherein all data and twice daily combined vitamin D analogue and potent corticosteroid are included.

Figure 348

Odds ratios for clear/nearly clear as measured by IAGI or PGA, results of sensitivity analysis wherein all data and twice daily combined vitamin D analogue and potent corticosteroid are included. Note: Results in the white area are the odds ratios and (more...)

Table 5 presents the relative risk of achieving clearance or near clearance as assessed by the patient (PAGI) for each intervention compared to twice daily vehicle/placebo. It also gives a probability that the intervention is the most effective overall in this sensitivity analysis as well as in the base case. This provides an easy way of comparing the results between the base case and the sensitivity analysis.

Table 5. Relative risks of clear/nearly clear with PAGI for all interventions compared to twice daily vehicle/placebo - sensitivity analysis wherein all data and twice daily combined vitamin D analogue and potent corticosteroid are included.

Table 5

Relative risks of clear/nearly clear with PAGI for all interventions compared to twice daily vehicle/placebo - sensitivity analysis wherein all data and twice daily combined vitamin D analogue and potent corticosteroid are included.

As in the case of the IAGI and PGA outcomes, the results of the analysis demonstrate that the majority of the base case results are robust to changes in the data. The one noteworthy exception is twice daily vitamin D or vitamin D analogue. The base case showed the relative risk for twice daily vitamin D or vitamin D analogue compared to twice daily vehicle/placebo was 3.56 (2.16 to 4.92). In the sensitivity analysis, twice daily vitamin D or vitamin D analogue appears to be less effective than in the base case (but still more effective than vehicle/placebo) with a relative risk of 2.82 (1.86 to 3.83).

The effectiveness of twice daily combined vitamin D analogue and potent corticosteroid is also demonstrated for this patient-reported outcome. Again, it has a greater than 50% probability of being the most effective topical therapy. But again, the pairwise odds ratios of direct evidence (Figure 349) indicate that there is a non-significant difference between once daily and twice daily application of the combined product (OR 1.22 (0.47 to 3.24)).

Figure 349. Odds ratios for clear/nearly clear as measured by PAGI, results of sensitivity analysis wherein all data and twice daily combined vitamin D analogue and potent corticosteroid are included.

Figure 349

Odds ratios for clear/nearly clear as measured by PAGI, results of sensitivity analysis wherein all data and twice daily combined vitamin D analogue and potent corticosteroid are included. Note: Results in the white area are the odds ratios and 95% confidence (more...)

K.6. Discussion

Based on the results of conventional, pairwise meta-analyses of direct evidence, as has been previously presented in chapter 6, deciding upon the most effective topical for the treatment of mild to moderate psoriasis is difficult. Many interventions have not been directly compared to one another in a randomised controlled trial and there are many instances of overlapping comparisons that could potentially give inconsistent estimates of effect. In order to overcome these challenges and to base decisions on a coherent set of treatment effects across all the trial evidence, a network meta-analysis was performed.

The NCGC analysis was based on a total of 37 studies, including up to 13,887 patients randomised to 14 different interventions. These studies formed 2 networks of evidence, which were differentiated by outcome. The first network is comprised of evidence on the effectiveness of topical therapies in achieving a physician or investigator assessed outcome of response (clear/nearly clear); the second network is comprised of evidence on the effectiveness of a subset of the same topical therapies in terms of a patient assessed outcome of response (clear/nearly clear). Fewer trials reported data for the patient assessed outcome than the investigator assessed outcome. The findings from the NMA fed into the original economic analysis of topical therapy sequences (see Appendix M), and helped to facilitate GDG decision-making about the optimal treatments for patients with mild to moderate plaque psoriasis of the trunk and limbs.

Results of the first network, in which outcomes were based on investigator/physician assessment, showed that all topicals with active agents (non-vehicle cream or ointment) were more effective than placebo/vehicle. There was a non-significant trend towards twice daily application of a given topical to be more effective than once daily application. Very potent corticosteroids were found to be among the most effective agents in terms of induction of clearance or near clearance, and once or twice daily application was shown to be the most effective intervention in nearly 75% of simulations. The next most effective interventions involved a combination of potent corticosteroid and vitamin D analogue, either applied once daily in a single two-compound formulation product or applied separately, one in the morning and the other in the evening. Interventions such as potent corticosteroids and vitamin D analogues, coal tar and dithranol were all between 3 and 5 times more likely to induce clearance than placebo, but there were only small and non-significant differences between them.

In a sensitivity analysis of the first network, the protocol was broadened to include additional trial evidence and comparators. Twice daily application of two-compound formulation product (combined potent corticosteroid and vitamin D analogue) was excluded from the base case because it is not licensed at this high dose, but it was included in the sensitivity analysis.. The estimates and ranking of strategies were largely consistent with the base case analysis; however twice daily coal tar was less effective than in the base case. The additional comparator, twice daily two-compound formulation product, was found to be the most effective intervention, surpassing very potent corticosteroids. When compared to once daily application, the twice daily two-compound formulation product trended toward being more effective, but this trend failed to reach statistical significance.

Results of the second network, in which outcomes were based on patient assessment, were broadly similar to the results from the investigator/physician assessed analysis. The effectiveness of very potent corticosteroid was markedly less when assessed by patients, but it is unclear what may be driving this finding. Combined and concurrent potent corticosteroid and vitamin D analogue were the best topicals, followed by potent corticosteroids and vitamin D analogues. In this analysis, once daily potent corticosteroid performed slightly better than twice daily, but twice daily vitamin D or vitamin D analogue was more effective than once daily. Again, when the protocol was expanded and twice daily two-compound formulation product was included as a comparator, it was shown to be most effective, but not significantly more effective than once daily application.

The NMA was undertaken to synthesise estimates of efficacy for different topical therapies under consideration for the treatment of mild to moderate psoriasis. The GDG considered response, in terms of the achievement of clearance or near clearance, to be the most important outcome from the clinical evidence review; however, other outcomes, namely those measuring safety, were also very important. They were aware that many of the most effective interventions, potent and very potent corticosteroids, are sometimes associated with certain adverse events (e.g. irreversible skin atrophy, rapid relapse, disease destabilisation) that may limit their utility in the long term management of patients with psoriasis. In interpreting the evidence and making recommendations, the GDG relied on the efficacy results from the NMA as well as results for the other outcomes, particularly adverse events, included in the clinical evidence review of direct evidence.

K.7. WinBUGS code (Base case analysis)

#Random effects model for multi-arm trials (any number of arms)


model{

for (i in 1:NS)

                          {           Events[i] <- r[i,1]*equals(t[i,1],1)

                                       Numpatients[i] <- n[i,1]*equals(t[i,1],1) }

totEvents<-sum(Events[])

totNumpatients<-sum(Numpatients[])


BR<- totEvents/totNumpatients


for(i in 1:NS){

        w[i,1] <-0

                   delta[i,t[i,1]]<-0

                   mu[i] ~ dnorm(0,.0001)                                             # vague priors for 24 trial baselines

                   for (k in 1:na[i]) {

                         r[i,k] ~ dbin(p[i,t[i,k]],n[i,k])                                  # binomial likelihood

                            logit(p[i,t[i,k]])<-mu[i] + delta[i,t[i,k]]                 # model


#Deviance residuals for data i

       rhat[i,k] <- p[i,t[i,k]] * n[i,k]

       dev[i,k] <- 2 * (r[i,k] * (log(r[i,k])-log(rhat[i,k])) + (n[i,k]-r[i,k]) * (log(n[i,k]-r[i,k]) - log(n[i,k]-
rhat[i,k])))

                            }


             sdev[i]<- sum(dev[i,1:na[i]])


                            for (k in 2:na[i]) {

               delta[i,t[i,k]] ~ dnorm(md[i,t[i,k]],taud[i,t[i,k]])               # trial-specific LOR distributions

               md[i,t[i,k]] <- d[t[i,k]] - d[t[i,1]] + sw[i,k]                     # mean of LOR distributions

               taud[i,t[i,k]] <- tau *2*(k-1)/k                                      #precision of LOR distributions

               w[i,k] <- (delta[i,t[i,k]] - d[t[i,k]] + d[t[i,1]])             #adjustment, multi-arm RCTs

               sw[i,k] <-sum(w[i,1:k-1])/(k-1) }                   # cumulative adjustment for multi-arm trials

  }


d[1]<-0

for (k in 2:NT){d[k] ~ dnorm(0,.0001) }                       # vague priors for basic parameters


sd~dunif(0,2)                                        # vague prior for random effects standard deviation

tau<-1/pow(sd,2)


rr[1]<-1

for (k in 2:NT) {logit(v[k])<-logit(BR)+d[k]

rr[k]<-v[k]/BR }                                # calculate relative risk


sumdev <- sum(sdev[])                             # Calculate residual deviance


# Ranking and prob{treatment k is best}

for (k in 1:NT) {

              rk[k]<-NT+1-rank(rr[],k)

best[k]<-equals(NT+1-rank(rr[],k),1)}

# pairwise ORs and RRs

for (c in 1:(NT-1))

          { for (k in (c+1):NT)

                { lor[c,k] <- d[k] - d[c]

                   log(or[c,k]) <- lor[c,k]

                   lrr[c,k] <- log(rr[k]) - log(rr[c])

                   log(rrisk[c,k]) <- lrr[c,k]

                 }

           }

}


# NT=no. treatments, NS=no. studies;

# NB : set up M vectors each r[,]. n[,] and t[,], where M is the Maximum number of treatments

# per trial in the dataset. In this dataset M is 5.


list(NS=34,NT=14)

 r[,1] n[,1] r[,2] n[,2] r[,3] n[,3] r[,4] n[,4] r[,5] n[,5] t[,1] t[,2] t[,3] t[,4] t[,5] na[]

 1 26 13 28 NA 1 NA 1 NA NA 2 3 NA NA NA 2

 0 84 37 84 NA 1 NA 1 NA NA 2 3 NA NA NA 2

 0 40 9 79 14 83 44 162 NA NA 2 3 5 10 NA 4

 16 157 107 480 176 476 276 490 NA NA 2 3 5 10 NA 4

 5 91 33 184 73 183 NA 1 NA NA 2 3 10 NA NA 3

 7 45 18 50 NA 1 NA 1 NA NA 2 5 NA NA NA 2

 5 33 144 189 NA 1 NA 1 NA NA 2 7 NA NA NA 2

 7 229 24 439 NA 1 NA 1 NA NA 2 9 NA NA NA 2

 2 214 26 421 NA 1 NA 1 NA NA 2 9 NA NA NA 2

 9 29 21 29 NA 1 NA 1 NA NA 1 4 NA NA NA 2

 13 32 24 32 NA 1 NA 1 NA NA 1 4 NA NA NA 2

 23 123 87 124 NA 1 NA 1 NA NA 1 4 NA NA NA 2

 11 62 46 62 NA 1 NA 1 NA NA 1 4 NA NA NA 2

 8 107 103 308 174 312 NA 1 NA NA 1 4 6 NA NA 3

 19 206 115 227 95 150 NA 1 NA NA 1 4 10 NA NA 3

 4 37 15 39 NA 1 NA 1 NA NA 1 6 NA NA NA 2

 1 83 12 78 NA 1 NA 1 NA NA 1 6 NA NA NA 2

 0 29 84 162 NA 1 NA 1 NA NA 1 8 NA NA NA 2

 27 125 85 120 NA 1 NA 1 NA NA 1 8 NA NA NA 2

 1 20 10 61 NA 1 NA 1 NA NA 1 8 NA NA NA 2

 2 60 47 60 NA 1 NA 1 NA NA 1 8 NA NA NA 2

 49 172 69 172 73 172 NA 1 NA NA 3 4 11 NA NA 3

 43 252 143 249 NA 1 NA 1 NA NA 3 10 NA NA NA 2

 67 128 81 130 NA 1 NA 1 NA NA 4 6 NA NA NA 2

 119 205 116 207 NA 1 NA 1 NA NA 4 6 NA NA NA 2

 142 365 169 363 NA 1 NA 1 NA NA 4 6 NA NA NA 2

 22 49 27 39 NA 1 NA 1 NA NA 4 11 NA NA NA 2

 13 27 3 27 NA 1 NA 1 NA NA 4 12 NA NA NA 2

 6 28 14 27 NA 1 NA 1 NA NA 4 13 NA NA NA 2

 47 65 28 57 NA 1 NA 1 NA NA 4 13 NA NA NA 2

 23 60 24 54 NA 1 NA 1 NA NA 4 14 NA NA NA 2

 92 153 67 131 NA 1 NA 1 NA NA 4 14 NA NA NA 2

 180 231 116 227 NA 1 NA 1 NA NA 4 14 NA NA NA 2

 6 89 4 77 NA 1 NA 1 NA NA 4 14 NA NA NA 2

END


list(

d=c(NA,0,0,0,0,0,0,0,0,0,0,0,0,0),

sd=.2,

mu=c(-3,-1,3,-1,0,3,-2,-2,-1,-3,0,-1,2,3,3,2,3,3,1,3,-2,-2,3,-2,3,3,3,1,-1,1,1,-1,1,-1),

delta = structure(.Data =
c(NA,NA,3,NA,NA,NA,NA,NA,NA,NA,NA,NA,NA,NA,NA,NA,1,NA,NA,NA,NA,NA,NA,NA,NA,NA,NA,NA,N
A,NA,-3,NA,-3,NA,NA,NA,NA,-2,NA,NA,NA,NA,NA,NA,-
1,NA,2,NA,NA,NA,NA,0,NA,NA,NA,NA,NA,NA,1,NA,NA,NA,NA,NA,NA,-
2,NA,NA,NA,NA,NA,NA,NA,NA,1,NA,NA,NA,NA,NA,NA,NA,NA,NA,NA,NA,NA,NA,NA,NA,-
2,NA,NA,NA,NA,NA,NA,NA,NA,NA,NA,NA,NA,NA,NA,NA,-
3,NA,NA,NA,NA,NA,NA,NA,NA,NA,NA,NA,NA,NA,1,NA,NA,NA,NA,NA,NA,NA,NA,1,NA,NA,NA,NA,NA,
NA,NA,NA,NA,NA,NA,NA,NA,0,NA,NA,NA,NA,NA,NA,NA,NA,NA,NA,NA,NA,NA,3,NA,NA,NA,NA,NA,NA
,NA,NA,NA,NA,NA,NA,NA,0,NA,NA,NA,NA,NA,NA,NA,NA,NA,NA,NA,NA,NA,-
1,NA,3,NA,NA,NA,NA,NA,NA,NA,NA,NA,NA,NA,-
2,NA,NA,NA,NA,NA,3,NA,NA,NA,NA,NA,NA,NA,NA,NA,-
3,NA,NA,NA,NA,NA,NA,NA,NA,NA,NA,NA,NA,NA,-
3,NA,NA,NA,NA,NA,NA,NA,NA,NA,NA,NA,NA,NA,NA,NA,1,NA,NA,NA,NA,NA,NA,NA,NA,NA,NA,NA,NA
,NA,0,NA,NA,NA,NA,NA,NA,NA,NA,NA,NA,NA,NA,NA,-
1,NA,NA,NA,NA,NA,NA,NA,NA,NA,NA,NA,NA,NA,-
2,NA,NA,NA,NA,NA,NA,NA,NA,NA,2,NA,NA,NA,NA,NA,NA,3,NA,NA,NA,NA,NA,NA,NA,NA,NA,NA,NA,
NA,-1,NA,NA,NA,NA,NA,NA,NA,NA,NA,-2,NA,NA,NA,NA,NA,NA,NA,NA,NA,NA,NA,NA,NA,-
3,NA,NA,NA,NA,NA,NA,NA,NA,NA,NA,NA,NA,NA,0,NA,NA,NA,NA,NA,NA,NA,NA,NA,NA,NA,NA,NA,NA
,NA,NA,NA,NA,1,NA,NA,NA,NA,NA,NA,NA,NA,NA,NA,NA,NA,NA,NA,2,NA,NA,NA,NA,NA,NA,NA,NA,N
A,NA,NA,NA,NA,NA,3,NA,NA,NA,NA,NA,NA,NA,NA,NA,NA,NA,NA,NA,2,NA,NA,NA,NA,NA,NA,NA,NA,
NA,NA,NA,NA,NA,NA,1,NA,NA,NA,NA,NA,NA,NA,NA,NA,NA,NA,NA,NA,0,NA,NA,NA,NA,NA,NA,NA,NA
,NA,NA,NA,NA,NA,1,NA,NA,NA,NA,NA,NA,NA,NA,NA,NA,NA,NA,NA,0

),.Dim=c(34, 14))))
Image ch4f1
Copyright © National Clinical Guideline Centre - October 2012.

Apart from any fair dealing for the purposes of research or private study, criticism or review, as permitted under the Copyright, Designs and Patents Act, 1988, no part of this publication may be reproduced, stored or transmitted in any form or by any means, without the prior written permission of the publisher or, in the case of reprographic reproduction, in accordance with the terms of licences issued by the Copyright Licensing Agency in the UK. Enquiries concerning reproduction outside the terms stated here should be sent to the publisher at the UK address printed on this page.

The use of registered names, trademarks, etc. in this publication does not imply, even in the absence of a specific statement, that such names are exempt from the relevant laws and regulations and therefore for general use.

The rights of National Clinical Guideline Centre to be identified as Author of this work have been asserted by them in accordance with the Copyright, Designs and Patents Act, 1988.

Bookshelf ID: NBK327695

Views

  • PubReader
  • Print View
  • Cite this Page
  • PDF version of this title (11M)

Recent Activity

Your browsing activity is empty.

Activity recording is turned off.

Turn recording back on

See more...