Matched Annotation from NCBI and EMBL-EBI (MANE)
What is MANE?
The MANE project - The Matched Annotation from the NCBI and EMBL-EBI (MANE) is a collaborative project that aims to converge on human gene and transcript annotation and to define a genome wide set of representative transcripts and corresponding proteins (when applicable) for human genes. Each MANE transcript represents an exact match in exonic regions between a Refseq transcript and its counterpart in the Ensembl/GENCODE annotation such that the two identifiers can be used synonymously. Further, a MANE transcript matches GRCh38 reference genome assembly perfectly and is chosen based on biologically relevant criteria such as transcript expression levels and conservation of coding regions. Currently, the deliverables of the project include:
MANE Select: The MANE Select set consists of one transcript at each locus across the genome that is representative of biology at that locus. This set is useful as a universal standard for clinical reporting, as a default for display on browsers and key genomic resources, and as a starting point for comparative or evolutionary genomics. MANE Select transcripts are identified using computational methods complemented by manual review and discussion.
MANE Plus Clinical: The MANE Plus Clinical set includes additional transcripts for genes where MANE Select alone is not sufficient to report all "Pathogenic (P)" or "Likely Pathogenic (LP)" clinical variants available in public resources.
Watch the MANE webinar on YouTube!
Citing MANE
Please use the following publication to cite MANE: Morales, J., Pujar, S., Loveland, J.E. et al. A joint NCBI and EMBL-EBI transcript set for clinical genomics and research. Nature. 2022 Apr;604(7905):310-315. PubMed; PubMed Central; DOI: 10.1038/s41586-022-04558-8
Rationale
While both the NCBI’s RefSeq and EMBL-EBI’s Ensembl/GENCODE annotations have similarities, they may be different at the transcript level. Transcripts representing a specific splice structure or coding sequence may be missing from one of the two gene sets. Additionally, transcripts representing the same splice structure may differ in the length of the untranslated regions (UTRs) or have sequence mismatches due to SNPs. Consequently, researchers using a preferred gene set to design studies and to report results may find it difficult to communicate their work to others in the scientific community. Data resources, such as genome browsers and variation databases, may also use different annotation sets to represent a default transcript, which may cause confusion. Matched MANE transcripts, which are identical in the RefSeq and the Ensembl/GENCODE annotation sets, are expected to facilitate better communication and exchange of data among the scientific community when represented across most public genomic resources. In addition, the MANE dataset represents a high-quality annotation subset backed by expert curators and the combined computational strength of the NCBI and EMBL-EBI.
MANE Select
As a first step in the MANE project, in December 2018, NCBI and EMBL-EBI jointly released the first version of MANE Select (MANE v0.5), which covered 53% of human protein-coding genes. Since then, we have provided incremental MANE releases. The current release (MANE version 1.4) represents a coverage of >99% of human protein-coding genes and all genes from the American College of Medical Genetics and Genomics (ACMG) Secondary Findings list (SF) v3.0. Sixty two MANE Select transcripts are annotated on alternate loci as they cannot be represented on the primary assembly. The current release also contains the first batch of non-coding MANE Select genes known to be associated with disease.
MANE Select Methodology
Choosing the transcript
Initially, independent pipelines at NCBI and EMBL-EBI choose the ‘select’ transcript for each gene. The ‘RefSeq Select’ pipeline for protein-coding genes is described in the RefSeq Select section. MANE Select for non-coding genes are chosen by manual review using data available in the literature, input from collaborating groups and criteria including clinical importance, transcript expression and number of exons. The Ensembl pipeline uses similar criteria to choose the ‘select’ transcript, albeit with slightly different implementations.

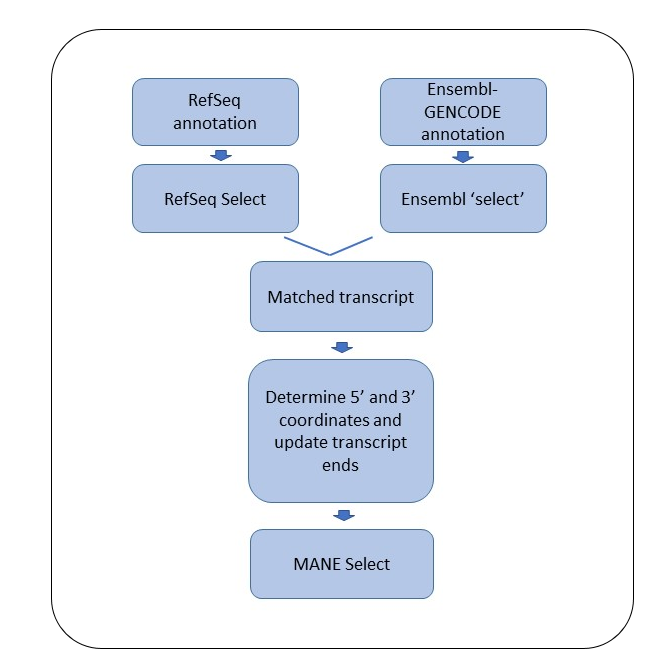
Figure 1. A flowchart showing the steps involved in the designation of a MANE Select transcript.
The transcript sets generated by the two pipelines are compared to identify matched pairs, where a match, at this point, is defined as the same splice structure and the same coding sequence (CDS). When a matching pair is not available, expert curators from the two groups examine the transcripts and create a match by 1) switching the pipeline choice of the RefSeq or the Ensembl ‘select’ to a different transcript, or 2) creating a new transcript when a matching transcript is not available in one of the annotation sets, or 3) updating the coding region of a transcript in one of the annotation sets, which is deemed wrong, to match the pipeline choice from the other annotation set.
Matching transcript ends
Once the splice structure and the coding region are matched, the next step is to match the transcript start and end coordinates of the two transcripts in the matched pair.
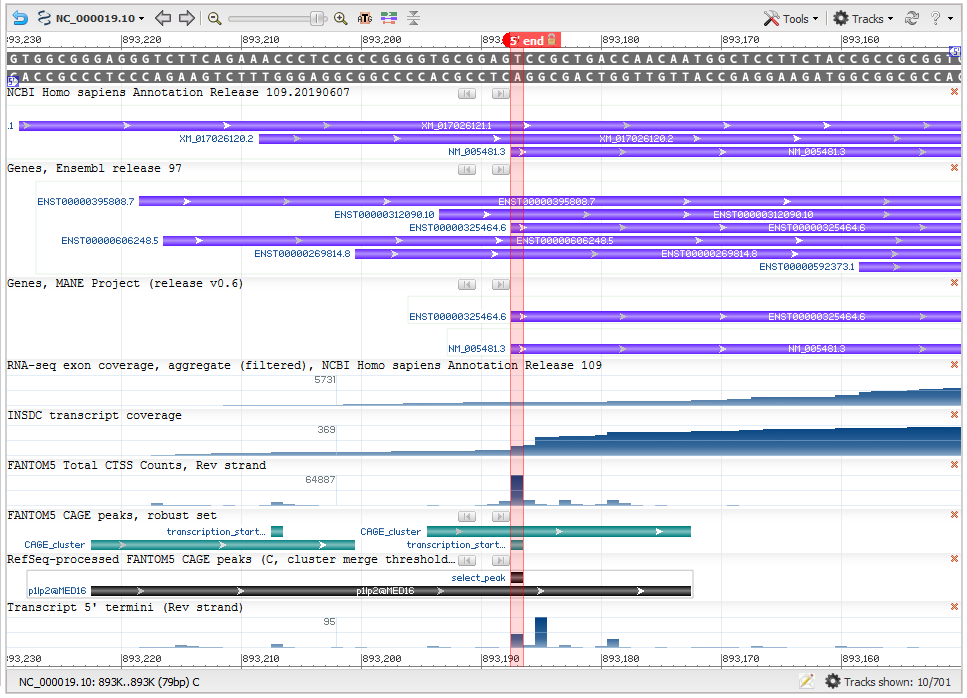
Transcript start: NCBI developed a method to leverage a high-througput sequencing technique called CAGE (cap analysis of gene expression), that specifically captures the 5’ ends of genes. We used CAGE data from the FANTOM consortium to determine the most likely used transcription start site (TSS). The precomputed CAGE data from the FANTOM5 dataset was reprocessed (Figure 2) to a) merge clusters that were close to each other (within 50 bases), and b) recalculate the TSS as the 5’-most base position within a cluster with a tag count that is at least 50% of that at the nucleotide position in the cluster with the maximum CAGE tag count. The goal of the reprocessing is to determine a frequently used TSS that is representative of the overall data, rather than the one with the absolute maximum tag counts.

Figure 2: Determination of the 5’ end of matched transcripts (Gene MED16). This screenshot from NCBI’s Genome Data Viewer shows several useful data tracks for evaluating the transcript 5’ end. The ‘RefSeq-processed FANTOM CAGE peaks’ track (black horizontal bar) of the screenshot represents the RefSeq-processed CAGE cluster, while the green bars in the ‘FANTOM5 CAGE peaks, robust set’ track are CAGE clusters from the FANTOM5 data. The vertical red highlight marks the calculated transcription start site (TSS). The matching RefSeq and Ensembl transcripts (seen in the ‘Genes, MANE project (version 0.6)' track) have been updated to use that TSS. The calculated TSS corresponds well with the 5’ end of the overall conventional transcript data (as seen in the INSDC transcript coverage track).
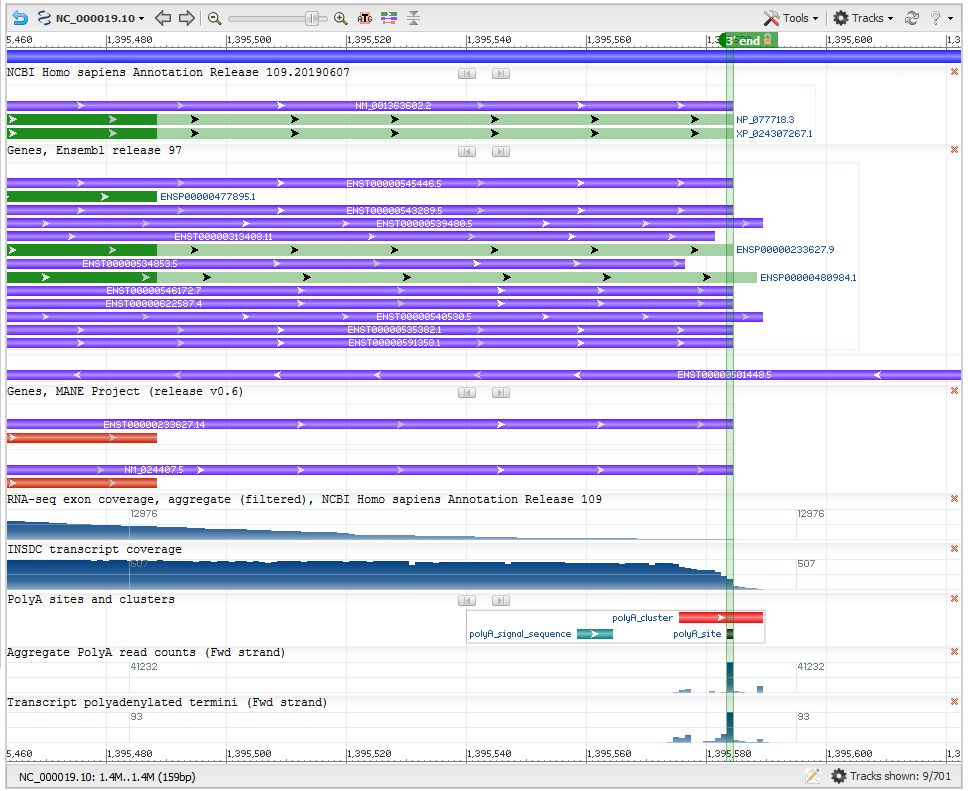
Transcript stop: The last base of the transcript is decided based on polyadenylated transcript data from conventional transcripts as well as high-throughput polyA-seq studies (PMID:30840896, PMID:30143597, PMID:29891946, PMID:29234016, PMID:26801249, PMID:26765774, PMID:25906188 and PMID:22454233). The maximum extent of the 3’ untranslated region (3’ UTR) is determined based on conventional polyadenylated transcripts, when available. As in the case of the CAGE data, polyadenylation clusters were calculated using data from multiple high-throughput polyA-seq studies, and the 3’-most nucleotide in the cluster with a sequence read count that is at least 50% of the maximum count in the cluster, is determined as the last base of the transcript (Figure 3).

Figure 3: Determination of transcript end (Gene NDUFS7). This screenshot from NCBI’s Genome Data Viewer shows several useful data tracks for evaluating the transcript 3’ end. The upper data tracks show the varying ends of transcripts in the RefSeq and Ensembl annotation sets. The ‘polyA sites and clusters’ track shows the polyadenylation (polyA) cluster (red horizontal bar) computed from multiple polyA-seq studies. Each polyA cluster is associated with a polyA signal feature (horizontal green bar). Within the polyA cluster, the polyA site (dark filled rectangle below the polyA cluster) represents the transcript end. The computed polyA site (green vertical highlight) corresponds with the most frequently used polyA site in conventional transcript data (transcript polyadenylated termini track at the bottom) as well as the end of the transcript coverage graph (seen in the INSDC transcript coverage track).
Salient features of MANE Select transcripts
- The MANE Select transcript for a human protein-coding gene consists of a pair of identically annotated transcripts, the RefSeq transcript (with an NM_ identifier) and the Ensembl transcript (with an ENST identifier). The two transcripts in the pair have identical sequence and splice structure and the same start and end coordinates.
- The MANE Select set includes only curated transcripts from the RefSeq and the Ensembl/GENCODE annotation sets.
- MANE Select transcripts exactly match the sequence of the GRCh38 human reference genome assembly. Mappings of MANE transcripts to GRCh37.p13 and other human assemblies such as T2T-CHM13v2.0 are available to help with clinical interpretation on those assemblies, but users will need to account for sequence differences when mapping variants to MANE transcripts.
- Changes to MANE Select transcripts, including sequence changes and/or transcript identifier changes, may occur on rare occasions, but our goal is to stabilize the set and only make changes for compelling reasons. To make our users aware of genes where updates were made, the ftp site for MANE v1.4 contains a list of updated MANE Select transcripts.
Manual curation of MANE data
While most of the MANE Select transcripts are chosen computationally, there are cases where the pipeline is unable to choose a suitable transcript due to a variety of reasons (for example, lack of data or insufficient data to make an unequivocal choice). Such cases are reviewed by expert curators from the RefSeq group and EMBL-EBI (the GENCODE and the LRG curation groups) to choose the MANE Select transcript. Additionally, curators play a crucial role in maintaining the quality of the MANE data by reviewing MANE Select transcripts flagged by a battery of QA tests.
Accessing MANE Select data
Currently, the MANE Select data can be accessed in the following ways:
-
Bulk download via FTP: Separate files are provided in GFF3, GTF and FASTA formats for both the RefSeq and Ensembl identifiers, and additionally in GenBank flatfile format for the RefSeq transcripts and proteins. Further information is available in this README file.
-
NCBI Entrez search: The ‘MANE Select’ keyword included in RefSeq flat files (see RefSeq Select) can be used in Nucleotide and Protein database queries For example: PALM[gene] AND MANE Select[keyword]. The entire list of MANE Select transcripts can be obtained using the Entrez query “Homo sapiens[organism] AND MANE_select[keyword]”. The list can then be downloaded and saved to a file using the “Send to” tab at the top of the search results page.
-
NCBI Gene knowledge box: Querying the Gene page by gene symbol (for example, 'human AND LARP1B') brings up a 'knowledge box' at the top of the resulting page. Expanding the 'RefSeq Sequences' section reveals a table showing RefSeq transcripts associated with the gene, with the MANE Select being on the top of the list flagged as 'MANE Select' in the status column.
-
RefSeq annotation files available via FTP: Column 9 of the GFF and the GTF files contain a “MANE Select” tag attribute (tag=MANE Select in GFF3, or tag ”MANE Select” in GTF), in the rows associated with the mRNA, CDS and exon features. In addition, column 9 also contains the matching Ensembl transcript identifier as an external database reference (Dbxref). Rows in the annotation files associated with the CDS feature contain the MANE Select tag, along with the matching Ensembl protein identifier.
-
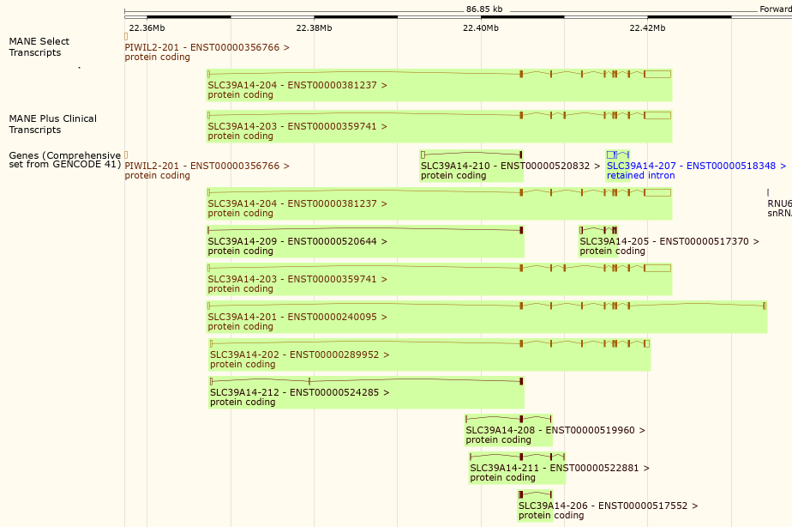
MANE transcripts are available in multiple genome browsers including NCBI’s Genome Data Viewer (Figure 4), UCSC Genome Browser (Figure 5), and Ensembl Genome Browser (Figure 6).
-
A track hub of the MANE Select data (available here) can be used to visualize MANE transcripts in popular genome browsers. Figure 5 shows the MANE track hub in UCSC Genome Browser.

Figure 4: A view of the gene SLC39A14 in Genome Data Viewer, showing the 'Genes, MANE project (release v1.0)' track at the top. The track includes the NCBI transcript and protein identifiers for MANE Select (NM_001128431.4/NP_001121903.1) and MANE Plus Clinical (NM_015359.6/NP_056174.2). The tool tip obtained by hovering over the MANE Select or MANE Plus Clinical transcript includes additional information, including the corresponding Ensembl accession numbers.

Figure 5: A view of the gene SLC39A14 in the UCSC Genome Browser (GRCh38/hg38 assembly), showing the native track 'NCBI RefSeq and Ensembl transcripts from the MANE Project (v1.0)' (top), and the track hub ‘MANE Project v1.0’ (bottom) with RefSeq and Ensembl identifiers. The MANE Select transcripts, NM_001128431.4 and ENST00000381237.6, are in blue, and the MANE Plus Clinical transcripts, NM_015359.6 and ENST00000359741.10, are in red.

Figure 6: A view of the gene SLC39A14 in the Ensembl Genome Browser showing the 'MANE Select transcripts' and 'MANE Plus Clinical transcripts' tracks (top).
Contact information
We welcome your feedback on the MANE project. Please use the yellow vertical Feedback tab on the bottom right of the page to send us your comments and suggestions on the contents of this webpage. Please send suggestions and questions about MANE, and specific requests about new or existing MANE transcripts, to one of the following email addresses:
