Molecular Modeling Database (MMDB) Help


This help document provides detailed descriptions of the Entrez Structure database content, search system,
and display formats. The "How To" page provides quick start guides for some common types of searches.
Once records of interest are retrieved, follow Entrez's "Links" to discover associations among previously disparate data. The Entrez Help document provides additional information about the search system and the databases it can be used to search.


DETAILED TABLE OF CONTENTS  
BRIEF TABLE OF CONTENTS
 
  What are macromolecular structures?
How can they be used?
Useful features of database
Computation
Analysis
Sequence-structure relationships
Connections to associated data
Database content
Source database
Data processing (biounits, interactions,
merged PDB split files)
Record types (X-ray/NMR, other)
Update frequency
Input:  Search tips
Search methods
Search fields
Link from other Entrez Database
Output:  Search results
Display settings, Send To
Filter your results
Refine your results
Find related data
Structure Summary Page
Identifiers (PDB ID, MMDB ID)
Descriptive information
Similar structures: VAST+
Display options (biological/asymmetrical)
Biological unit N
Structure images (molecular graphic,
interactions schematic)
Download Structure Data (save structure)
Molecular components
Web API
References


WHAT ARE MACROMOLECULAR STRUCTURES?
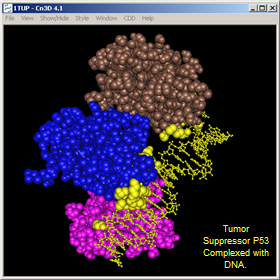
Thumbnail image showing 3D structure of Tumor Suppressor P53 Complexed with DNA (accession 1TUP). Yellow spheres represent amino acids within 5 Angstroms of DNA strands.  Click on image to read about macromolecular structures and how they can be used to learn more about proteins and other biomolecules.


SEQUENCE-STRUCTURE-FUNCTION
Example: structural basis of aspirin activity
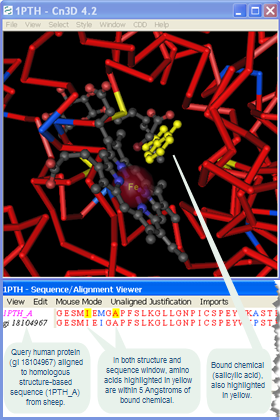
Thumbnail image of Prostaglandin H2 Synthase from sheep (accession 1PTH), showing 3D structure of active site and corresponding protein sequence data.  Click on image to read more about interactive displays of sequence-structure relationships and how can 3D structures be used to learn more about proteins and other biomolecules.


STRUCTURE SUMMARY PAGE (sample)
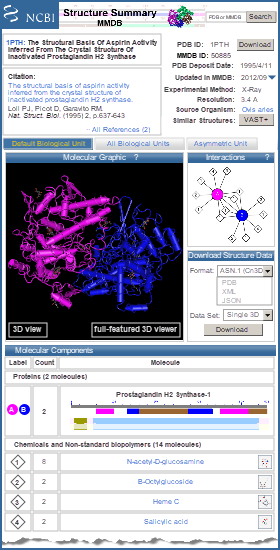
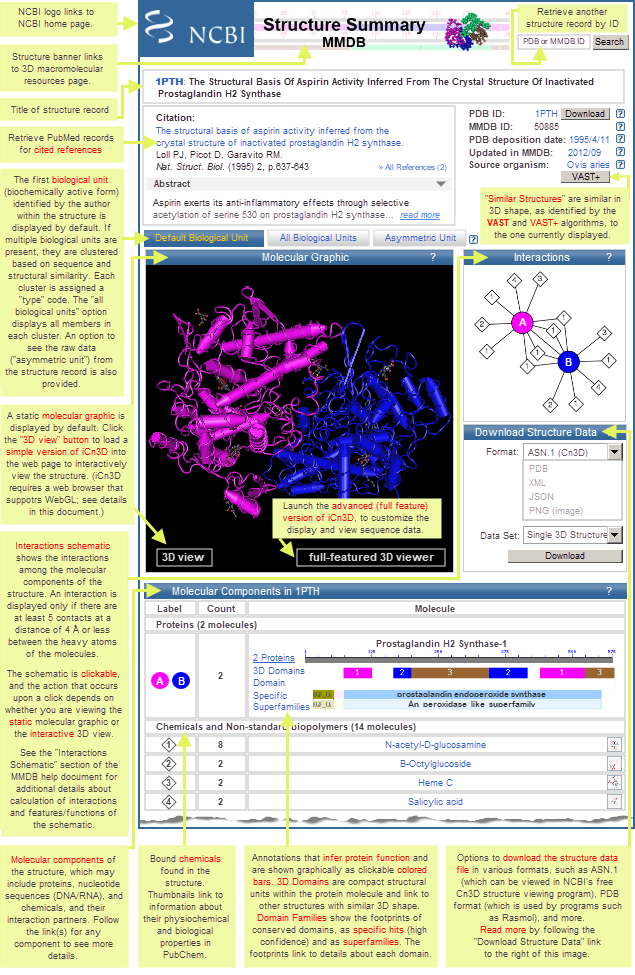
Thumbnail image of a sample structure summary page, for sheep prostaglandin H2 synthase (MMDB ID 50885, PDB ID 1PTH). Click on the image to read more about the features and options on a structure summary page.


MOLECULAR GRAPHIC (static → interactive)
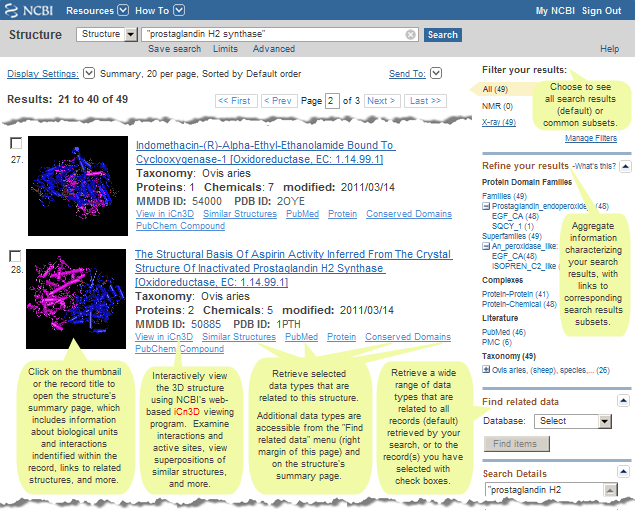
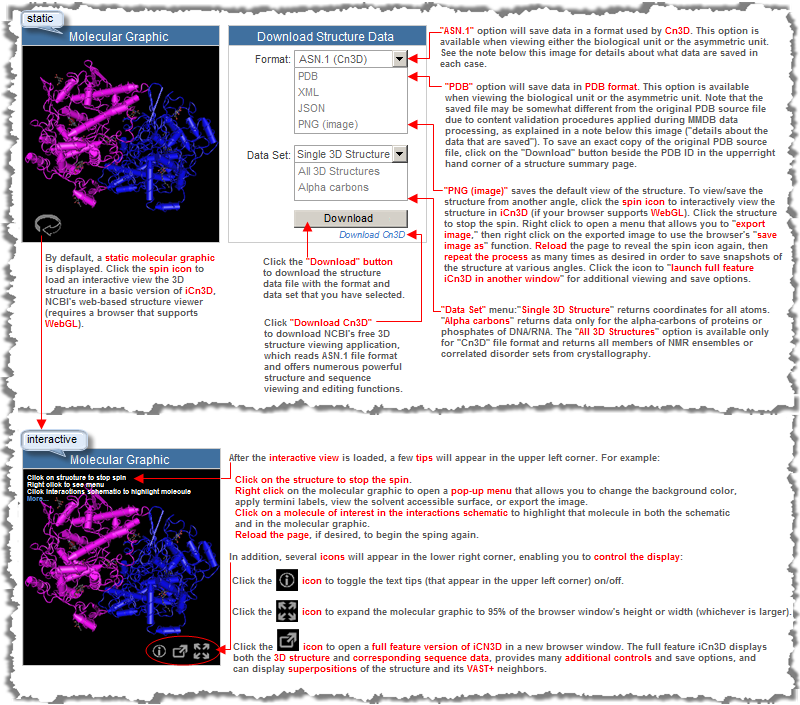
Sample thumbnail molecular graphic for 1PTH, prostaglandin H2 synthase-1 from sheep. A static image is shown by default. Click the 3D view button or the full-featured 3D viewer button near the bottom of a static molecular graphic to load an interactive view.


INTERACTIONS SCHEMATIC
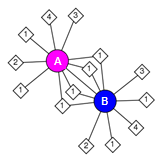
Sample interactions schematic for sheep prostaglandin H2 sythase, from the 1PTH structure record.


What are macromolecular structures? back to top

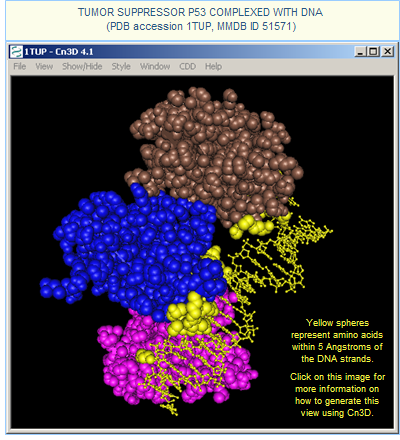
Image showing 3D structure of Tumor Suppressor P53 Complexed with DNA (accession 1TUP). Yellow spheres represent amino acids within 5 Angstroms of DNA strands.  Click on the image for more information on how to generate this view using Cn3D. Macromolecular structures show the three-dimensional shape of proteins and other biomolecules and provide a wealth of information on the biological function, on mechanisms linked to the function, and on the evolutionary history of and relationships between macromolecules. Most structure data are obtained from experimental methods such as X-ray crystallography and NMR-spectroscopy.

While genome projects and individual labs have deciphered the nucleotide sequences of genes and the linear protein sequences of their gene products, the functions of proteins and other biomolecules ultimately depend upon their shape. Because of this, the study of structural biology is an important complement to genomics. Together, those fields contribute insights into the biology of thousands of organisms and provide a foundation for yet more research on protein functions and classifications, the chemicals to which they bind, biological systems, and more.

In the illustration to the right, for example, the P53 tumor suppressor (accession 1TUP) is bound to double-stranded DNA, as viewed in the free Cn3D stand-alone program. The three-dimensional structure shows the functional shape of the protein and can be used to infer the specific amino acids that are active in binding to DNA. Here, yellow spheres represent amino acids within 5 Angstroms of the DNA strands. (Click on the image for step by step instructions on how to generate that particular view using the stand-alone Cn3D program. The structure can also be viewed in the free iCn3D web-based 3D viewer (open 1TUP in iCn3D), where the iCn3D menu option for "Select > By Distance" can be used to highlight the interaction interfaces.) A number of the mutations (allelic variants) observed in patients with Li-Fraumeni syndrome and various cancers appear to have occurred in or near those regions of the protein, based on an alignment of the 393 amino acid TP53 protein discussed in Online Mendelian Inheritance in Man (OMIM 191170) to the 3D structure's protein sequence data. Together, the sequence data, 3D structure, and phenotypic observations yield a greater understanding of the protein and its biological function than any one of them alone could. Open the structure record (accession 1TUP) to read more about it, and use either the Cn3D stand-alone program or the iCn3D web-based program to interactively view the structure and its corresponding sequence data.

Throughout this help document, the structures of the P53 tumor suppressor (1TUP) and prostaglandin-endoperoxide synthase (1PTH, discussed in the sequence-structure-function section of this document) are used in search examples and illustrations to show the ways in which the Molecular Modeling database can be searched and to describe the contents and features of a structure record.

Four Levels of Protein Structure back to top

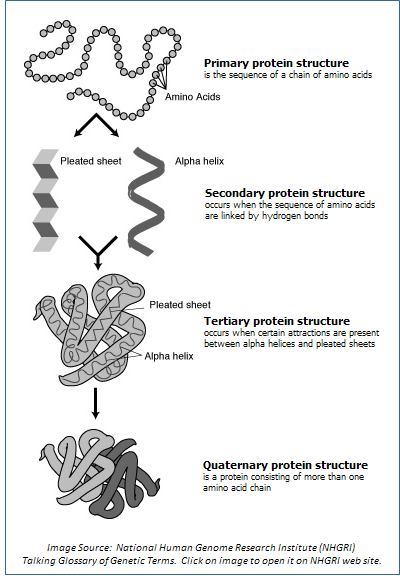
Image showing the four levels of protein structure: primary, secondary (alpha helices and beta sheets), tertiary, and quaternary.  Click on the image to view it on the NHGRI Talking Glossary of Genetic Terms, the source of the image. A linear protein (referred to as the primary structure) consists of amino acids with varying chemical properties. Forces of attraction among the amino acids cause regions of the protein molecule to fold into one of two basic shapes, which are referred to as secondary structures and take the shape of alpha-helices and beta-sheets (also known as pleated-sheets). Depending on its length and composition, a single protein molecule can contain one or more secondary structures; for example, some regions of the molecule might fold into alpha-helices while another folds into a beta-sheet. The three-dimensional shape of the complete protein molecule is called its tertiary structure. Some biological molecules are composed of two or more proteins that are assembled into a complex, and the shape of the overall complex is called its quaternary structure. These levels of structure are shown in the illustration to the right.

An example of a biomolecule with a quaternary structure is the human P53 tumor suppressor (accession 1TUP). It is composed of three protein molecules, as shown in brown, blue, and pink portions of the illustration for "what are macromolecular structures?". Open the 1TUP record in MMDB, and then click on the "full featured 3D viewer" button in the molecular graphic to view 1TUP interactively in the free iCn3D web-based 3D viewer to see: (a) its linear protein sequences (primary structures); (b) the secondary structures into which each protein molecule folds (alpha helices are shown as green spirals and beta sheets as yellow bands in Cn3D's default view); and (c) how the three proteins come together (tertiary and quaternary structures) to form the biolocially active molecule that binds with DNA. (The 1TUP structure can also be downloaded in ASN.1 (Cn3D) format and viewed in the free stand-alone Cn3D program.)

Experimental Methods back to top

Most structure data are obtained from X-ray crystallography and NMR-spectroscopy. X-ray crystallography determines the arrangement of atoms within a protein by passing X-rays through a crystallized form of the protein and analyzing the resulting X-ray diffraction pattern. This technique provides the highest resolution and usually yields only one model of a structure. Nuclear magnetic resonance (NMR) determines the structure of a protein in solution and generally yields multiple models, which allow for characterization of the biomolecule's motion in solution. An example of each type of structure is shown in the section of this document on "record types", and additional experimental methods are listed in the ExpMethod search field of the database.

As an alternative to these experimental methods, some researchers use computational modeling to predict the structure of a protein by simulating the forces that act on each atom in a molecule of known composition. However, this method produces non-experimental models and the least reliable results. For these reasons, the Molecular Modeling Database excludes computationally generated structures or other theoretical models and includes only experimentally determined structures.

How can 3D structures be used to learn more about proteins and other biomolecules? back to top

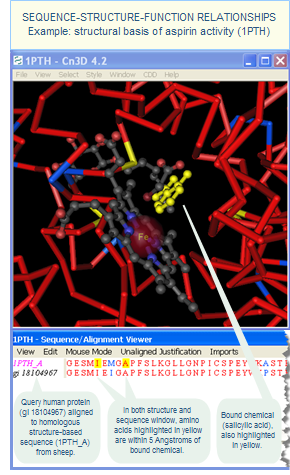
Image depicting the sequence-structure-function relationships that can be revealed by 3-dimensional macromolecular structures. A query protein sequence from human (NP_000953) is aligned to a homologous sheep sequence that has a resolved 3D structure (1PTH), which reveals the inferred structural basis of aspirin activity. Click on the image to view step by step instructions on how to generate this view using the free Cn3D software program. Identify Representative 3D structures for Protein Families:  Because the techniques for resolving 3D structures are not as rapid as sequencing technologies, the number of protein structures available in the Molecular Modeling Database is smaller than the number of sequences in the Protein and Nucleotide databases. However, a large fraction of all known protein sequences have homologs in the set of resolved 3D structures, and one may often learn more about a protein by examining 3-D structures of its homologs. These can be found by following the "Related Structures" link when viewing a protein sequence record, as shown frame B in the illustrated example of how to retrieve 3D structures for a gene or product of interest.

Examine Sequence-Structure-Function Relationships:   The sequence-structure relationship of all structures in the Molecular Modeling Database can be interactively explored using the free iCn3D web-based 3D viewer or the free Cn3D stand-alone software program. In addition, when structures include a bound chemical or other observed interactions, the function of the biomolecule is elucidated. For example, the illustration to the right shows the 3-D structure of an ovine prostaglandin H2 synthase protein (1PTH), which reveals the inferred structural basis of aspirin activity. The homologous human protein (NP_000953, prostaglandin-endoperoxide synthase 1) does not yet have a resolved structure but can be aligned to the sheep's protein sequence in Cn3D, and the relationship between the two sequences and corresponding 3D structure can then be examined interactively. Click on the image to view step by step instructions on how to do this in the stand-alone Cn3D. Or, see an example of how to align a protein sequence with unknown structure to a sequence-similar 3D structure using the web-based iCn3D. The Cn3D tutorial and the iCn3D help document provide additional details on how to use the programs.

View 3D Structures of Conserved Core Motifs:   The Conserved Domain Database (CDD), a related resource maintained by the NCBI Structure Group, includes an NCBI-curated data set whose goal is to provide insights into how patterns of residue conservation and divergence in a protein family relate to functional properties, and to provide useful links to more detailed information that may help to understand those sequence/structure/function relationships. To achieve this, the curators combine information about conserved domains from multiple sequence alignments with what we can infer from three-dimensional structure and three-dimensional structure superposition. As a result, the NCBI-curated conserved domain records include representations of conserved structural core motifs whenever possible, and the 3D structure images in the domain's conserved feature summary box link to specially annotated views of the 3D structures that highlight the conserved feature.

Identify Putative Active Site Residues:   The free iCn3D web-based 3D viewer or the free Cn3D stand-alone software program can be used to identify putative active site residues. To do this in the web-based iCn3D, use the menu option for "Select > By Distance." To do this in stand-alone Cn3D, use the "Show/Hide:Select by Distance" option to highlight amino acids within a specified distance (e.g., 5 Angstroms) of a molecule of interest. Examples using stand-alone Cn3D are shown in the image to the right and in the human P53 Tumor Suppressor protein image shown in "What are macromolecular structures?". Click on either image to open a separate page with step-by-step instructions on how to generate that view in the stand-alone Cn3D. The Cn3D tutorial and the iCn3D help document provide additional details on how to use the programs.

The NCBI-curated data set in CDD also identifies amino acids involved in catalysis and binding whenever possible and describes their function in the conserved feature summary box of a conserved domain record. The specific amino acids involved in the conserved feature are marked with hash signs (#) in the domain model's multiple sequence alignment and highlighted in specially annotated 3D structures, when available.


Useful Features of the Molecular Modeling Database back to top


Facilitate computation on 3D structure data back to top

Uniform processing and validation of 3D structure data enables a variety of computational analyses within individual structure records and across the complete MMDB database, in order to identify salient features of 3D structures and relationships among them.

The results of the analyses, along with the connection of structure records to associated data throughout the Entrez system, permit the retrieval of data sets that have certain attributes, as well as the association of proteins that do not yet have resolved 3D structures with those that do. For example, in MMDB it is possible to:


Analysis of individual structures and relationships among them back to top

A variety of computational analyses are performed during MMDB data processing in order to identify salient features of individual 3D structures, and to identify relationships among structures across the database:
Biological and geometrical features within 3D structures
The primary content of 3D structure records are the spatial (x,y,z) coordinates of each atom in the structure. The NCBI data processing procedure analyzes that information to identify: (1) distinct biological units within the structure; (2) interactions among its molecular components; and (3) secondary structures (alpha helices, beta strands) as well as 3D domains within individual protein molecules. This information is then used in further analyses to identify evolutionary relationships and functional relationships among 3D structures.

Conserved protein domain annotations
Each protein sequence in a 3D structure is compared against the Conserved Domain Database using the CD-Search (RPS-BLAST) tool to identify the conserved domains within the protein and therefore infer its function.

Structure data are also incorporated into NCBI-curated conserved domains whenever possible in order to combine information that has been derived from multiple sequence alignments with what we can infer from three-dimensional structure and three-dimensional structure superposition, providing insights into how patterns of residue conservation and divergence in a protein family relate to functional properties. These sequence-structure associations also make it possible to view 3D structures of conserved core motifs and identify putative active site residues.
Evolutionary relationships among 3D structures
The Vector Alignment Seach Tool (VAST) computer algorithm was developed to identify similar protein 3-dimensional structures by purely geometric criteria, and to identify distant homologs that cannot be recognized by sequence comparison.

To do this, VAST identifies 3D domains (substructures) within each protein structure in the Molecular Modeling Database (MMDB), and then finds other structures that contain similarly shaped protein molecules. This output, referred to as "Original VAST," reflects comparisons between individual protein molecules, which can share a similar shape along their entire length, or only along a fraction of their length, such as a single 3D domain.

In addition, VAST+, an expanded version of the program, finds macromolecular structures that have similarly shaped biological units (also referred to as "biounits"), not just those that share similarly shaped individual protein molecules or fragments.

VAST and VAST+ are applied during data processing to identify similar 3D structures for every protein in MMDB, and the pre-computed results are accessible via "Similar Structures: VAST+" links on the structure summary pages.

The VAST+ help document provides details about the differences between VAST and VAST+, an illustrated example of VAST+ results, and an illustrated example of original VAST results.

(The VAST Search page can also be used to compare the coordinates of a newly resolved structure in PDB format against all structures in MMDB to find its neighbors.)

Interactive views of sequence-structure relationships back to top

All structures in MMDB can be viewed with the the free iCn3D web-based 3D viewer or the free Cn3D stand-alone software program, which were developed as companion resources to MMDB in order to visualize three-dimensional structures with an emphasis on interactive examination of sequence-structure relationships. Both iCn3D and Cn3D can simultaneously display a 3D structure and its corresponding sequence data, and allow you to select items of interest (e.g., entire protein or nucleotide molecules, spans of sequence data, or individual amino acids or nucleotides, as desired) in either view in order to examine their location in both views. An illustrated example of the stand-alone Cn3D display is shown featuring the human P53 tumor suppressor, in which amino acids within 5 Angstroms of the bound DNA are highlighted in yellow in Cn3D's structure and sequence view windows.

Proteins with similar sequence data can also be imported into either iCn3D or Cn3D and aligned to the structure's sequence data, as shown in the illustrated example showing Cn3D's alignment of human prostaglandin endoperoxide synthase 1 to a sheep homolog with a resolved 3D structure.

iCn3D and Cn3D can also be used to display superpositions of geometrically similar structures (i.e., VAST Similar Structures), conserved core motifs identified in conserved domains, and newly resolved structures in PDB format that are not yet present in MMDB.

Connections between 3D structure records and associated literature, molecular, and chemical data back to top

For each structure in MMDB, the data processing procedure identifies associated literature, molecular, and chemical data throughout the Entrez system, and then establishes connections among those data sets. These related data are accessible as Links on the MMDB search results and structure summary pages.


Content of the Molecular Modeling Database back to top

Source Database back to top

The Molecular Modeling DataBase (MMDB) is a database of experimentally determined three-dimensional biomolecular structures, and is also referred to as the Entrez Structure database. It is a subset of three-dimensional structures obtained from the RCSB Protein Data Bank (PDB), excluding theoretical models. The data processing procedure at NCBI results in the addition of a number of useful features that facilitate computation on the data and link them to many other data types in the Entrez system.

Each MMDB record cross-references the source PDB record from which it was derived (i.e., the MMDB summary page for a structure displays both its MMDB ID and the corresponding PDB ID). If an MMDB record represents a structure that was merged from two or more PDB split files, then the summary page will show the PDB IDs of all the source PDB records that compose the merged structure.

MMDB contains various record types, reflecting various experimental methodologies such as X-ray crystallography and Nuclear Magnetic Resonance (NMR), and various molecule types such as proteins, DNA, and RNA, with or without bound chemicals.

The content of an individual structure record reflects the data provided by the submitter, and the literature associated with a structure record provides more details about it. Note that various data submitters might use different terminology to describe the same gene or protein (for example, some might use the term "suppressor" while others use the term "inhibitor"), so it is often helpful to include synonyms, such as acronyms, full spellings, and disease names, if appropriate, when searching the database (see search tips).

How are the data processed at NCBI? back to top

| validation | deposit sequence and chemical data | identify biological units (oligomeric states, example: hemoglobin) | merge PDB split files (examples: viral capsid, rat liver vault, ribosome) | identify interactions | identify geometrical features | identify the gene that corresponds to each protein | identify relationships among 3D structures | create links to associated data |

Content Validation:back to top


When PDB structure records are imported into MMDB, the information in each structure record is reorganized and validated in a way that enables cross-referencing between the chemistry and the three-dimensional structure of macromolecules. While the PDB data model provides an elegant and concise description of a crystal structure, there is no one-to-one correspondence between a site, a structure, and an atom in the chemical sense. MMDB provides this chemical information in an explicit manner. Its data specification includes a description of a biopolymer's spatial structure, a description of how it is organized chemically, and a set of pointers linking the two.

  • The first step in creating MMDB is getting an accurate sequence that is consistent with the atom site coordinates in PDB. For example:


    • The SEQRES records in an original PDB file are generally intended to represent the molecule that was purified, crystallized, and measured. However, it might not have been possible to experimentally resolve the atomic coordinates for all of the amino acids in some structures, especially in flexible regions of proteins such as N- and C- terminals. In addition, sometimes the atomic coordinates might indicate the presence of additional residues not listed in the SEQRES records. In the latter case, MMDB derives the biopolymer sequence from the atomic coordinates and not from the original SEQRES records. The derived biopolymer sequence will then appear in the MMDB record, and in the SEQRES records of the PDB-formatted file saved from the MMDB database.


    • Some PDB records may have discontinous residue numbers, which exist in a free text field. MMDB assigns a consecutive series of positive integers to residues in biopolymers, using a numerical data field. This ensures correspondence between the residue numbers in the structure file and those in the corresponding protein and/or nucleotide sequence records.

  • The second step is to construct a complete chemical graph for the molecule, representing all bonds and chirality. An important component of this second step matches the amino acid and nucleotide groups defined by PDB against a dictionary that defines all bond and atom types.


  • The third and final step is to recover disorder information in the structure.

(Note: Because such changes may occur during data processing, the content of a PDB-formatted file that you save from the MMDB database might differ from the original PDB file.)


Deposit sequence and chemical data into Entrez Protein, Nucleotide, and PubChem databases:back to top


In addition to providing the spatial (x,y,z) coordinates of every atom in a 3D macromolecular structure, a structure record includes the sequence data for each component nucleotide (DNA, RNA) and/or protein molecule. As part of MMDB data processing, the sequence data for each molecule are deposited into the Entrez Nucleotide or Entrez Protein database, as appropriate. The data processing procedures for those databases, in turn, identify relationships (i.e., similarities) among the sequence data from 3D structures and the other sequences in those databases, facilitating the use of 3D structure data to learn more about proteins and other biomolecules.

A structure record may also include bound chemicals. Data records for those chemicals are deposited into the PubChem Substance database, and then linked to corresponding records in the non-redundant, curated PubChem Compound database. This makes it possible, for example, to find 3D protein structures bound to a specific chemical (e.g., aspirin), even if submitters of 3D structures used various names or abbreviations for a given chemical.


Identify biological units (oligomeric states):back to top

what is a biological unit? | asymmetric unit → biological unit (example: hemoglobin )
procedures to identify biological unit: author/software determination, transformations from crystallographic symmetry, identify distinct biological units, note about biological units in merged PDB split files | technical note about asymmetric unit

What is a biological unit?

The biochemically active form of a biomolecule can range from a monomer (single protein molecule) to an oligomer of 100+ protein molecules, and is referred to as "biological unit" for brevity.

The raw data present structure records resolved by x-ray crystallography or neutron diffraction of a crystal are often casually referred to as the "asymmetric unit." These data can represent either: (a) the complete biological unit, (b) a portion of the biological unit, or (c) multiple copies of the biological unit, as in the human hemoglobin examples shown below. Authors of structure records use programs such as PISA to identify the biological unit within a structure record. If multiple interpretations of the biological unit exist, the author may choose to annotate the various interpretations in their record. The MMDB data processing pipeline applies several procedures to identify a structure's biological unit(s) and displays it by default on a structure summary page. (See technical note about asymmetric unit.)

The asymmetric unit is equivalent to the biological unit in approximately 60% of structure records resolved by x-ray crystallography or neutron diffraction of crystals. In the remaining 40% of the records, the asymmetric unit represents a portion of the biological unit that can be reconstructed using crystallographic symmetry, or it represents multiple copies of the biological unit.

Additionally, some structures exceed the size limits implicit to the PDB file format and are therefore split by PDB into several files. In those cases, the biological unit might be spread across multiple PDB files. The MMDB data processing pipeline merges the split files into a single structure record. In such cases, "asymmetric unit" is the only display option for merged PDB split files from crystallographic studies, because the biological unit of the complete structure is not specified in a computer readable way in the PDB source files. The structure summary page for a merged crystallographic structure therefore simply uses the label of "asymmetric unit" above the molecular graphic, because it represents the unification of raw data from the original PDB files. The asymmetric unit can represent the structure's complete biological unit, a portion of the biological unit, or multiple copies of the biological unit. In the case of structures resolved by electron microscopy (EM) or nuclear magnetic resonance (NMR), the term "asymmetric unit" does not apply, and the term "biological unit" is shown instead on the summary page for a merged structure from either of those technologies. Please refer to the corresponding publication for a structure, if/as available, for the author's description of its biologically active form.


Asymmetric unit (raw data) → Biological unit (default display)back to top

Example: -- As an example of the varying degrees to which a biological unit can be represented by the raw data in a structure record, compare the following records for human hemoglobin. Each one contains the spatial coordinates and sequence data for a different number of protein molecules, yet the fundamental biological unit in all three structures is a tetramer consisting of two alpha, two beta subunits, and four heme groups. By default, an MMDB structure summary page displays the biological unit:

 
ASYMMETRIC UNIT (RAW DATA)
IN THREE DIFFERENT STRUCTURE RECORDS FOR HUMAN HEMOGLOBIN:
right arrow BIOLOGICAL UNIT
IS SIMILAR IN ALL:
PDB ID: 2DN2
MMDB ID: 39206
PDB ID: 1LFT
MMDB ID: 20898
PDB ID: 1LFL
MMDB ID: 20896
right arrow The MMDB summary page for each record displays the biological unit by default:
3D view of the raw data for human hemoglobin submitted in PDB record 2DN2, which contains a complete copy of the structure's biological unit (in this case, a tetramer). Click on the thumbnail to open the structure record in MMDB, where you can launch an interactive 3D view and then color by molecule, as shown here. 3D view of the raw data for human hemoglobin submitted in PDB record 1LFT, which contains half of the structure's biological unit (that is, half of the hemoglobin tetramer). Click on the thumbnail to open the asymmetric unit view in MMDB, where you can choose to view the biological unit and/or launch an interactive 3D view, and then color by molecule as shown here. 3D view of the raw data for human hemoglobin submitted in PDB record 1LFL, which contains two copies of the structure's biological unit. Click on the thumbnail to open the asymmetric unit view in MMDB, where you can choose to view the biological unit and/or launch an interactive 3D view, and then color by molecule as shown here. 3D view of the biological unit (tetramer) of human hemoglobin.
Complete tetramer (two alpha subunits and two beta subunits) of human hemoglobin Half of the tetramer (one alpha subunit and one beta subunit)

(Although the raw data in this structure record represents only half of the tetramer, MMDB's automated data processing procedure applies the tranformations derived from crystallographic symmetry to generate the other half, as shown in the corresponding biological unit.)
Two copies of the tetramer (four alpha subunits and four beta subunits)   Tetramer with two alpha subunits, two beta subunits, and four heme groups. A corresponding schematic shows the interactions among the components:
Interaction schematic for the human hemoglobin tetramer, showing protein molecules as circles and heme groups as diamonds, with lines indicating interactions with at least 5 contacts a distance of 4 Angstroms or less between the heavy atoms.
The summary page also provides display options to view all biological units (if applicable) or the asymmetric unit, if desired.


Procedures to identify the biological unit(s) within a structure record:back to top


author/software determination | transformations from crystallographic symmetry | comparison of biological units | note about biological units in merged PDB split files
 
  •  
  • author and/or software determination   The "REMARK 350" record of a PDB source file specifies the biological unit (oligomeric state) of the structure and lists the protein molecules of which it is composed. The REMARK 350 also indicates how the biological unit was determined -- by the author and/or a software program, and if the latter, which software program was used (e.g., PISA, PQS).

    MMDB parses that information to identify the biological unit(s) within the structure record, compares biological units to each other if two or more are present in order to determine if they are similar or distinct, and uses the results of the parsing and comparison steps to provide a variety of display options for a structure, such as a concise view showing only the default biological unit, a comprehensive view of all biological units, or the asymmetric unit. If biological units are displayed, the MMDB summary page indicates the method by which each was determined, as extracted from the "REMARK 350" record of the PDB source file.

    MMDB also identifies the non-biopolymers (e.g., chemicals, ions, heme groups, etc.) that are part of the biological unit by analyzing the interactions observed within the structure. If a non-biopolymer has five or more contacts with a biopolymer at an interatomic distance of 4 Å or less, the non-biopolymer is grouped into the relevant biological unit(s). If a non-biopolymer contacts two or more biopolymers, the interaction with the greatest number of contacts takes precedence. Chemicals that are not biologically significant to the structure, such as crystallization agents, water molecules, detergents, etc. are ignored.

    (NOTE: The biological unit display option is not available for merged PDB split files from crystallographic studies, because the biological unit of the complete structure is not specified in a computer readable way in the PDB source files. The structure summary page for a merged crystallographic structure therefore simply uses the label of "asymmetric unit." In such cases, please refer to the corresponding publication, if/as available, for the author's description of the structure's biologically active form.)


  •  
  • apply transformations
    derived from
    crystallographic symmetry
      If the raw data in a structure record represents a portion of the biological unit, and if the "REMARK 350" record of the PDB source file specifies the rotational and translational transformations that should be applied to the raw data, MMDB automatically applies these transformations to reconstruct the complete biological unit.

    For example, MMDB processing generated the second half of the biological unit for human hemoglobin in the 1LFT structure by applying the transformations specified in the PDB source file's REMARK 350 record.

    If any protein or nucleotide molecules in the structure were generated by applying transformations from crystallographic symmetry, they are depicted in the interactions schematic and molecular components summary table of an MMDB summary page with labels that have alphanumeric combinations (for example, Example of circle icons with alphanumeric labels used to depict protein molecules generated by applying transformations from crystallographic symmetry. or Example of square icons with alphanumeric labels used to depict nucleotide sequences generated by applying transformations from crystallographic symmetry.), indicating the source molecule from which they were generated and the copy number. Chemicals that interact only with such molecules were also generated by applying transformations from crystallographic symmetry.


  •  
  • compare biological units
    within a record to each other
    to identify distinct forms
      If multiple biological units exist within a single structure record, or if multiple interpretations of the biological unit have been annotated in the record, MMDB uses an algorithm to compare them to each other and determine if they are the similar or distinct.

    Biological units are considered similar if they contain the same number and type of molecular components and meet a threshhold for sequence and structural similarity. In such a case, they will be assigned the same "type" code on the MMDB summary page display of "all biological units." The thresholds currently used are 90% or more sequence similarity and an RMSD of 2 Å or less for a global superposition of the biological units. (RMSD is the root mean square superposition residual in Angstroms. This number is calculated after optimal superposition of two structures, as the square root of the mean square distances between equivalent C-alpha atoms. Note that the RMSD value scales with the extent of the structural alignments and that this size must be taken into consideration when using RMSD as a descriptor of overall structural similarity.)

    Biological units are considered to be distinct if they do not meet the above threshholds. In that case, each one will be assigned a different "type" code on the MMDB summary page display of "all biological units."

    For example, if the author has determined that the biological unit of the structure is a tetramer, and a software program has determined it to be a dimer, the interpretations of the biological unit are distinct from each other and each one will be assigned a different "type" code on the MMDB summary page display of all biological units, along with a corresponding annotation noting how each was determined.


  •  
  • note about biological unit
    in merged PDB split files
      Some structures exceed the size limits implicit to the PDB file format and are therefore split into several PDB files. The MMDB data processing procedures merge the PDB split files into a single structure record.

    The biological unit specification is contained in a free text field of the individual PDB source files. When a structure record has been reconstructed my merging two more PDB split files, that information cannot be parsed in an automated way for the complete structure. Therefore, only the asymmetric unit is displayed for merged crystallographic structures, representing the unification of raw data from the original PDB files. In the case of structures resolved by electron microscopy (EM) or nuclear magnetic resonance (NMR), the term "asymmetric unit" does not apply, and the term "biological unit" is shown instead on the summary page for a merged structure from either of those technologies. Please refer to the corresponding publications for those structures, if/as available, for the author's description of their biologically active form.

    The merged files now make it possible to view and/or download large macromolecular structures in their entirety, and to interactively view the sequence-structure relationships using the free iCn3D web-based 3D viewer or the free Cn3D 4.3 stand-alone software program (install). You can also retrieve all merged files, if desired.


    Asymmetric unit (technical note):back to top


    The raw data in a structure record (generated by x-ray crystallography or neutron diffraction) are often casually referred to as the "asymmetric unit." These data, which were submitted by the author and stored in the source PDB record, can represent either: (a) the complete biological unit (i.e, the biochemically active form of a biomolecule); (b) a portion of the biological unit; or (c) multiple copies of the biological unit, as shown in the illustrated example of three different human hemoglobin structure records. The display options on an MMDB summary page for an individual structure allow you to view your choice of biological unit(s) or asymmetric unit, with the biological unit shown by default.

    The "asymmetric unit" is equivalent to the biological unit in approximately 60% of structure records.

    The concepts of asymmetric unit and biological unit do not apply to structure records resolved by experimental methods other than x-ray crystallography and neutron diffraction.

    Note: The technical definition of asymmetric unit is somewhat different from its casual meaning. Technically, an asymmetric unit is the smallest part of a 3D structure from which the complete structure can be built using a specific set of rotational and translational matrices that describe the symmetry of the structure.


    Merging PDB split files into a single MMDB structure recordback to top


    Some structures exceed the size limits implicit to the PDB file format and are therefore split into several PDB files. The MMDB data processing procedures merge the PDB split files into a single structure record. The merged structures now make it possible to display and/or download large macromolecular structures in their entirety, and to interactively view the sequence-structure relationships using either iCn3D, a web-based 3D viewer that loads the structure within the web page without the need to install a separate application, or the stand-alone Cn3D 4.3 (install).

    Please note that "asymmetric unit" is the only display option for merged PDB split files from crystallographic studies, because the biological unit of the complete structure is not specified in a computer readable way in the PDB source files. The structure summary page for a merged crystallographic structure therefore simply uses the label of "asymmetric unit" above the molecular graphic, because it represents the unification of raw data from the original PDB files. The asymmetric unit can represent the structure's complete biological unit, a portion of the biological unit, or multiple copies of the biological unit. In the case of structures resolved by electron microscopy (EM) or nuclear magnetic resonance (NMR), the term "asymmetric unit" does not apply, and the term "biological unit" is shown instead on the summary page for a merged structure from either of those technologies. Please refer to the corresponding publication for a structure, if/as available, for the author's description of its biologically active form.

    Examples of merged structures, illustrated below, include the:

    You can also retrieve all merged files from the Molecular Modeling Database, if desired.


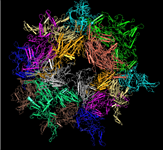
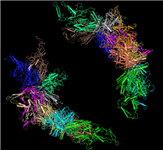
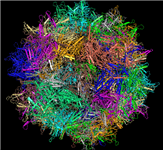
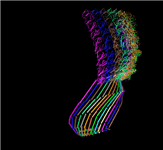
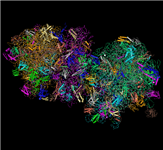
    Example: The viral capsid for the Adeno-associated Virus Serotype 6 (Aav-6) by Xie et al. was split into PDB records 1VU0, 1VU1, 3TSX, and was merged at MMDB into a single record with the MMDB ID 99554:


    PDB SPLIT FILES for the Adeno-associated Virus Serotype 6 (Aav-6) right arrow MMDB MERGED FILE
    PDB ID: 1VU0 PDB ID: 1VU1 PDB ID: 3TSX right arrow MMDB ID: 99554
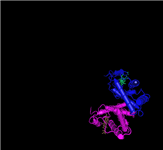
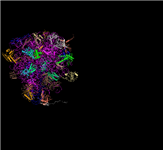
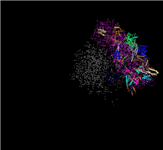
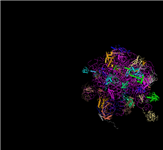
    First of three PDB split files for the viral capsid Aav-6, showing the 3D view for the portion of the structure that is in PDB record 1VU0. Second of three PDB split files for the viral capsid Aav-6, showing the 3D view for the portion of the structure that is in PDB record 1VU1 Last of three PDB split files for the viral capsid Aav-6, showing the 3D view for the portion of the structure that is in PDB record 3TSX. right arrow Thumbnail image of the Adeno-associated Virus Serotype 6 (Aav-6), in which the data from the three PDB split files have been merged together to provide a 3D view of the complete structure, shown here in MMDB ID 99554. The entire structure and its sequence data can be viewed interactively with the free stand-alone Cn3D program, or with the free web-based iCn3D program.
    Click on the thumbnail image above to open the merged file in the free stand-alone Cn3D 4.3 viewer to interactively view the entire structure and its sequence data. (If you do not yet have Cn3D 4.3 on your computer, install it before clicking the thumbnail.)

    Alternatively, open the structure summary page for MMDB ID 99554 in the Molecular Modeling Database, then click on the "full-featured 3D viewer" button near the bottom of the molecular graphic to interactively view the structure of the viral capsid with iCn3D, a web-based 3D viewer that loads the structure within the web page without the need to install a separate application.


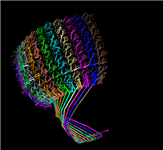
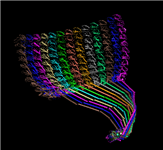
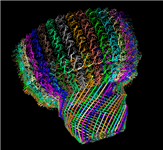
    Example: The rat liver vault by Tanaka et al. was split into PDB records 2ZUO, 2ZV4, 2ZV5, and was merged at MMDB into a single record with the MMDB ID 99596:
    (Note: The merged file represents half of the biological unit, as it was submitted by the author. The procedures to identify biological units cannot be applied in an automated way to a merged file; therefore, the asymmetric unit is diplayed instead. Please refer to the corresponding publication for a structure for the author's description of the biologically active form. )


    PDB SPLIT FILES for the Rat Liver Vault right arrow MMDB MERGED FILE
    PDB ID: 2ZUO PDB ID: 2ZV4 PDB ID: 2ZV5 right arrow MMDB ID: 99596
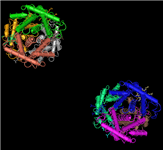
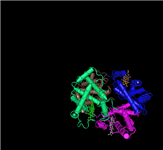
    First of three PDB split files for the rat liver vault, showing the 3D view for the portion of the structure that is in PDB record 2ZUO. Second of three PDB split files for the rat liver vault, showing the 3D view for the portion of the structure that is in PDB record 2ZV4 Last of three PDB split files for the rat liver vault, showing the 3D view for the portion of the structure that is in PDB record 2ZV5. right arrow Thumbnail image of the rat liver vault, in which the data from the three PDB split files have been merged together to provide a 3D view of the complete data set, shown here in MMDB ID 99596.
    Click on the thumbnail image above to open the merged file in the stand-alone Cn3D 4.3 viewer to interactively view the entire structure and its sequence data. (If you do not yet have Cn3D 4.3 on your computer, install it before clicking the thumbnail.)

    Alternatively, open the structure summary page for MMDB ID 99596 in the Molecular Modeling Database, then click on the "3D view" or the "full-featured 3D viewer" button near the bottom of the molecular graphic to interactively view the rat liver vault structure with iCn3D, a web-based 3D viewer that loads the structure within the web page without the need to install a separate application.


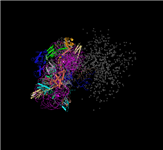
    Example: The ribosome structure by Selmer, Dunham, Murphy, Weixlbaumer, Petry, Kelley, Weir, and Ramakrishnan, the 2009 Nobel Laureate in Chemistry, was split into PDB records 2XFZ, 2XG0, 2XG1, 2XG2, and was merged at MMDB into a single record with the MMDB ID 99580:
    (Note: The merged file represents two copies of the biological unit, as submitted by the author. The procedures to identify biological units cannot be applied in an automated way to a merged file; therefore, the asymmetric unit is diplayed instead. Please refer to the corresponding publication for a structure for the author's description of the biologically active form. )


    PDB SPLIT FILES for the Structure of Cytotoxic Domain of Colicin E3 Bound to the 70S Ribosome
    PDB ID: 2XFZ PDB ID: 2XG0 PDB ID: 2XG1 PDB ID: 2XG2
    First of four PDB split files for the ribosome structure by Nobel Laureate Ramakrishnan, showing the 3D view for the portion of the structure that is in PDB record 2XFZ. Second of four PDB split files for the ribosome structure by Nobel Laureate Ramakrishnan, showing the 3D view for the portion of the structure that is in PDB record 2XG0 Third of four PDB split files for the ribosome structure by Nobel Laureate Ramakrishnan, showing the 3D view for the portion of the structure that is in PDB record 2XG1. Last of four PDB split files for the ribosome structure by Nobel Laureate Ramakrishnan, showing the 3D view for the portion of the structure that is in PDB record 2XG2.
    right arrow
    MMDB MERGED FILE: Complete structure of the Structure of Cytotoxic Domain of Colicin E3 Bound to the 70S Ribosome
    MMDB ID: 99580
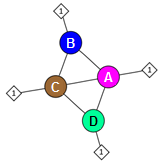
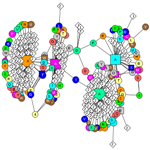
    Interactions schematic for the ribosome structure by Nobel Laureate Ramakrishnan, showing the interactions among the component molecules, and indicating that two copies of the ribosome are present in the structure file. The MMDB record for the complete ribosome structure by Nobel Laureate Ramakrishnan, in which the data from four PDB split files have been merged together to provide a 3D view of the complete structure, shown here in MMDB ID 99580. Click on the image to open the merged file in Cn3D and interactively view the entire structure and its sequence data.

    Click on the thumbnail image above to open the merged file in the stand-alone Cn3D 4.3 viewer to interactively view the entire structure and its sequence data. (If you do not yet have Cn3D 4.3 on your computer, install it before clicking the thumbnail.)

    Alternatively, open the structure summary page for MMDB ID 99580 in the Molecular Modeling Database, then click on the "3D view" or the "full-featured 3D viewer" button near the bottom of the molecular graphic to interactively view the ribosome structure with iCn3D, a web-based 3D viewer that loads the structure within the web page without the need to install a separate application.

    Note: the interactions schematic, shown above and also visible on the structure summary page for MMDB ID: 99580, indicates that there are two copies of the ribosome in the structure file, reflecting the data submitted by the author.


    In summary, the merged structure files, such as the viral capsid , the rat liver vault, and the ribosome illustrated above, now make it possible to view and/or download large macromolecular structures in their entirety, and to interactively view the sequence-structure relationships using the free stand-alone Cn3D 4.3 program (install), or the free web-based iCn3D viewer. You can also retrieve all merged files from the Molecular Modeling Database, if desired. Please refer to the corresponding publications for those structures, if/as available, for the author's description of their biologically active form.


    Identify interactions among molecular components:back to top


    As part of MMDB data processing, the spatial coordinates in a structure record are analyzed to identify interactions among the structure's molecular components. Interactions are reported on an MMDB Summary Page as an interactions schematic if they meet the following thresholds:


  •  
  • 4 Å interatomic distance   A contact is defined as a distance of 4 Å or less between the heavy atoms of biopolymers (proteins, DNA, and/or RNA). Interactions are identified in a pairwise fashion. For examples, if protein molecules A, B, and C form a trimer, the interactions will be reported between each pair of proteins (e.g., A:B, B:C, and A:C).
    Interactions between the heavy atoms of biopolymers and chemicals are also reported.


  •  
  • 5 or more contacts   An interaction between two molecular components is reported on a structure's summary page if five or more contacts exist between those molecules. For example, atoms from at least 5 amino acids or nucleotides in a biopolymer (protein, DNA, or RNA) must be closer than, or as close as, 4 Angstroms from one or more atoms in the "other molecule" in order for the interaction to be reported.  
     
     
  •  
  • rank interactions   Interactions among the molecular components are ranked by the number of contacts that meet the 4 Å distance threshold, and those with at least 5 contacts are shown in the interaction schematic on the structure summary page.

    Note: Ions that interact with the biomolecules in the structure but do not reach the 5 contact threshold will be absent from the interaction schematic; however, they will be listed in the tabular summary of molecular components. Interactions for short peptides, or for molecule types other than protein, DNA/RNA, and chemical, are not calculated. Molecules, such as crystallization agents, etc., that are not part of the biologically active molecule are absent from both the interaction schematic and the molecular components list.


    Identify geometrical features:back to top

     
  •  
  • secondary structures   Secondary structures (alpha helices and beta strands, as shown in the illustration on four levels of structure) in each protein molecule are identified algorithmically using purely geometric criteria, and the residue span of each secondary structure is noted in the MMDB record. (Note that because the spans are identified algorithmically, they might differ from the secondary structure residue spans annotated in the original PDB file by the data submitter.)  
     
     
  •  
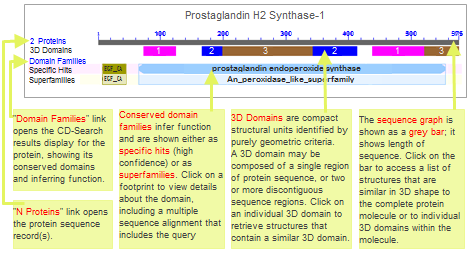
  • 3D domains   3D domains are compact structural units within a protein that are identified automatically during MMDB data processing using purely geometric criteria. A protein molecule can contain one or more 3D domains, which often correspond with conserved domains (illustrated example) observed in molecular evolution. Additionally, proteins that are dissimilar in sequence might contain geometrically similar 3D domains, indicating a distant homology that cannot be recognized by sequence comparison. 3D domains are used in the identification of VAST similar structures. They are also displayed as footprints on individual protein molecules (illustrated example, additional details) in the graphical portion of structure summary pages.  


    Identify the gene that corresponds to each protein:back to top

     
  •  
  • gene symbols   A gene symbol, if/as available, appears beside the name of each protein molecule in the tabular list of molecular components. The protein-gene association is determined in the following way:

    (1) The source database, PDB, provides a UniProt ID for each protein chain in a structure record.

    (2) The NCBI Gene database generates data files on its FTP site that provide mappings between protein identifiers and gene identifiers. Specifically: (a) the "gene_refseq_uniprotkb_collab.gz" file lists the correspondence between UniProt and RefSeq protein accessions; and (b) the "gene2accession.gz" file lists the correspondence between RefSeq protein accessions and Gene IDs. The MMDB data processing pipeline creates a join between these two tables in order to map each UniProt ID to its corresponding Gene ID, and to link to the NCBI Gene record.

    (Note that the protein sequence in the structure record is not necessarily identical to the protein product of the gene. For example, a structure record might only contain a fragment of the protein rather than the whole protein. So there is a mapping between the structure's protein molecule and the gene product, but not necessarily an exact sequence match.)
     

    Identify relationships among 3D structures:back to top


  •  
  • find similar 3D structures using VAST algorithm   The VAST algorithm is used to identify structures that are similar in 3D shape, regardless of their degree of sequence similarity, in order to identify distant homologs that cannot be recognized by sequence comparison. The region of similarity can span the entire length of a protein molecule, or a portion of it, as indicated by the footprints on the similar structures graphic display. If a structure contains more than one protein molecule, Similar Structures are shown for each one.

    In addition, VAST+, an expanded version of the program, has been applied to each structure in MMDB in order to find macromolecular structures that have similarly shaped biological units, also referred to as "biounits".

    Reciprocal links are created among the similar 3D structures and are accessible from the structure summary page by either: (a) clicking on the "Similar Structures: VAST+" link near the upper right corner of the page; or (b) viewing the Protein annotation graphic for any protein molecule of interest, then clicking on the bar graphic for the overall protein molecule or for any 3D domain it contains in order to view a list of other structures that are similar in shape to the molecule or 3D domain you selected.

    (Details about VAST and VAST+ are provided in the articles listed on the VAST publications page and in the VAST help document and VAST+ help document.)


    Create links to associated data throughout the Entrez system:back to top


    As noted in the page on discovering associations among previously disparate data, the Entrez retrieval system is designed to provide integrated access to previously disparate data and make it possible to collect related information on a topic of interest within and across Entrez databases. MMDB therefore identifies such associations during data processing and presents them as "Related Information" menus on search results pages. Many of the links are also available on individual structure records. There are two broad categories of Links:


  •  
  • direct links   Each structure record has one-to-one relationships with specific records in other Entrez databases, such as links to the protein sequence, nucleotide sequence, and chemical records that were created from the structure's molecular components.

    A structure record also has links to the PubMed records for articles cited in the structure record and to the NCBI Taxonomy record(s) for the source organism(s). Reciprocal links between the structure record and these molecular component and literature records are created, making it possible to start in any one of the databases and traverse to associated records in another database.
    Example: The structure 3Q5S (MMDB ID 91866): "Crystal Structure of Bmrr Bound to Acetylcholine" is composed of protein and nucleotide molecules and the chemical acetylcholine. The structure therefore has links to the specific protein sequence, nucleotide sequence, small molecule records that contain data extracted from the source PDB record for each of those molecular components. In addition, the structure record contains links to the NCBI Taxonomy database record for the source organism, Bacillus subtilis, and the to PubMed record PMID: 21690368 for the published reference.


  •  
  • indirect links   Records that are directly linked to a structure may in turn have associations with other types of data in the Entrez system. Links are therefore also created from the structure record to those additional data types. The methods by which those links are made are explained in more detail in the section on search results: find related data

    For example, each protein molecule in a structure record was analyzed to identify conserved domains and infer its function. The structure record will therefore have links to the corresponding Conserved Domain Database record(s).

    The structure record will have also have links to additional protein sequences that are cited as cross-references in the "DBREF" record of the PDB source file, to the genes that code for those proteins, and to any other protein sequences that are identical in length, composition, and source organism as the proteins cited in the "DBREF" record of the PDB source file. (The documentation about PDB file format provides more information about the various "records" (data fields) that are present in PDB source files.)

    As final example of an indirect link, if the protein in a structure record is the target of a bioassay, or is involved in the biological process described in the bioassay experiment, a link between the structure record and the biological activity data (PubChem BioAssay) is established, if the submitter of the bioassay data provided the link to the structure record's protein.

    Example: The structure 3Q5S (MMDB ID 91866): "Crystal Structure of Bmrr Bound to Acetylcholine" includes the protein, "Multidrug-efflux Transporter 1 Regulator," which has been annotated with two conserved domain superfamilies. There are also other protein sequence records linked to the structure (beyond the protein record that was created directly from the PDB source file) because they were either: (a) cited in the "DBREF" record of the PDB source file; (b) listed in the same Entrez Gene record (bmrR, Gene ID 938676) as the protein accession that was cited in the "DBREF" record of the PDB source file; or (c) are identical in length, composition, and source organism as any of the proteins in (a) or (b). Of course, the 3Q5S structure also has a link to the gene record itself. As a final example of an indirect link from a structure record to data in another Entrez [add links to BioAssay data for the PubChem record]
     

    Record Types back to top

    Various types of records are available in the Structure database. For example, it is possible to retrieve structures generated by specific experimental methods, as shown below, or structures that contain specific molecule types (e.g., protein, RNA, DNA), as shown in the subsequent illustration. A wide variety of search fields can be used to retrieve data subsets, such as structures that contain specific counts of protein molecules, DNA molecules, RNA molecules, or bound chemicals in their biological units. (A separate file shows how to retrieve 3D protein structures bound to a specific chemical.)
    back to topExperimental methods
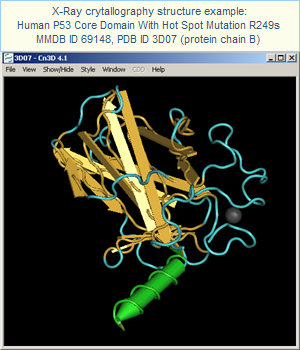
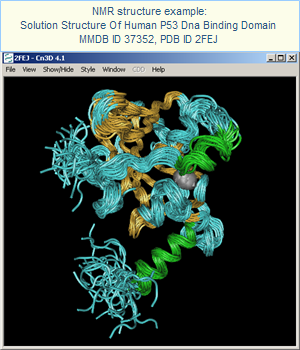
    X-ray crystallography determines the arrangement of atoms within a protein by passing X-rays through a crystallized form of the protein and analyzing the resulting X-ray diffraction pattern. This technique provides the highest resolution and usually yields only one model of a structure. Nuclear magnetic resonance (NMR) determines the structure of a protein in solution and generally yields multiple models, which allow for characterization of the biomolecule's motion in solution. Additional experimental methods, such as neutron diffraction, electron microscopy, and more, are listed in the ExpMethod search field, which can be browsed by using the Show index link on the Advanced Search page. X-Ray crytallography structure of Human P53 Core Domain With Hot Spot Mutation R249s (MMDB ID 69148, PDB ID 3D07), Protein Molecule B, showing alpha helix (green) and beta strand (yellow) secondary structures, disordered regions (blue), and Zinc ion. Click on this image to open the MMDB record, which provides access to the corresponding publication and interactive views of the structure in Cn3D. NMR (Solution) Structure Of Human P53 Dna Binding Domain (MMDB ID 37352, PDB ID 2FEJ). Click on this image to open the MMDB record, which provides access to the corresponding publication and interactive views of the structure in Cn3D. Select the Drawing: All Models option on the MMDB record before pressing the Structure View in Cn3D button to generate this view.

    back to topMolecule Types
    The biomolecules in MMDB can be composed of protein molecules, RNA molecules, DNA molecules, as in the examples shown here, or combinations of these components, as shown in the earlier illustration of the P53 Tumor Suppressor.

    Structures can also contain bound chemicals, as shown in the earlier illustration of ovine prostaglandin H2 synthase.
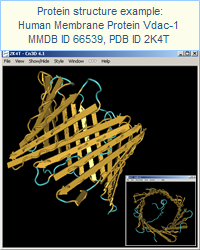
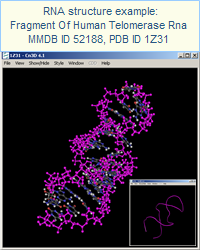
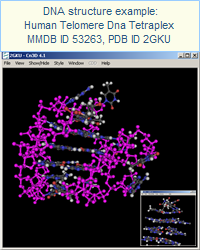
    Protein structure example: Human (membrane protein) Vdac-1 In Ldao Micelles (MMDB ID 66539, PDB ID 2K4T). Click on this image to open the MMDB record, which provides access to the corresponding publication and interactive views of the structure in Cn3D. RNA structure example: Enzyme-Activating Fragment Of Human Telomerase Rna (MMDB ID 52188, PDB ID 1Z31). Click on this image to open the MMDB record, which provides access to the corresponding publication and interactive views of the structure in Cn3D. DNA structure example: Monomeric Human Telomere Dna Tetraplex With 3+1 Strand Fold Topology, Two Edgewise Loops And Double-Chain Reversal Loop, Nmr, 12 Structures (MMDB ID 53263, PDB ID 2GKU). Click on this image to open the MMDB record, which provides access to the corresponding publication and interactive views of the structure in Cn3D.
    Structures containing specific molecule types (e.g., proteins, DNA, RNA, and/or chemicals) can be retrieved using the blue buttons on the Entrez Structure search page or the 3D Macromolecular Structures resource group page, or by using the technique described in How to retrieve 3D structures for a specific type of molecule. Structures that contain bound chemicals can be retrieved by using the Chemical Count search field or the method described in How to find 3D protein structures bound to a specific chemical.

    Update Frequency back to top

    The Molecular Modeling DataBase (MMDB) is updated on a weekly basis with new structures imported from the RCSB Protein Data Bank (PDB). All newly added structures go through the data processing procedures described above.

    In addition, links to related data are updated on a regular basis for all structures in the database. This ensures that new data in other Entrez databases are reciprocally linked to 3D structures.


    Search Tips back to top

    | allowable search terms | search methods | search fields | use of quotes | wild card * |
    | basic search | search details | limits |
    | advanced search | search builder | show index list | history | complex Boolean query | range query |
    | link from other Entrez databases to 3D structures | links from protein sequence records to 3D structures |

    Allowable search terms back to top

    This help document focuses on how to search for 3D macromolecular structures using the Entrez search system, which allows you to retrieve records that contain desired text terms. Additional search methods allow you to search the database with a query protein sequence or with the 3D coordinates for a newly resolved structure (using VAST tool); separate help documents exist for those search systems.

    In the Entrez Structure search interface, you can retrieve structure records by searching for:
    text terms (key words):  A wide variety of text terms, such as names of proteins, bound chemicals, authors, and more can be used to search the Entrez Structure database. You can also search for other words that might be present in any of the other text containing search fields of a record.
    Because terminology can vary across records, it can be helpful to include synonyms in your query, for example:
     
  • suppressor OR inhibitor
  •  
  • NF1 OR neurofibromin OR neurofibromatosis
  •  
  • PTGS1 OR "prostaglandin endoperoxide synthase 1" (see note about use of quotes)
  • It is also possible to search for a word stem by using an asterisk (*) as a wild card. For example, a search for inhibit* will retrieve records with terms such as inhibit, inhibited, inhibition, inhibitor, etc. The Entrez Help document provides additional information about truncating search terms in this way.

    unique identifiers:  Structure records can be retrieved by searching for their unique identifiers, in the form of an MMDB ID or PDB ID, or for the unique identifiers of their molecular components, such as protein sequence GI numbers or accession numbers, PubChem compound identifiers (CIDs) or substance identifiers (SIDs), or external registry names such as Enzyme Commission or chemical registry numbers (EC/RN numbers).

    organism:  To retrieve structure records for a specific organism or organism group, you can enter its common name (e.g., human) or scientific name (e.g., Homo sapiens), or other taxonomic node (e.g, Primates) in the Organism [orgn] search field. Note that some structure records contain protein or nucleotide sequences from more than one organism, and they will be retrieved if they contain one or more sequences from the organism or taxon specified in your query. If you specifically want to retrieve structure records that contain data from more than one source organism, simply enter the desired organism names with a Boolean AND (e.g., human[orgn] AND HIV1[orgn]).

    database subset:  It is possible to retrieve subsets of records that have certain attributes, such as structures generated by specific experimental methods or containing specific molecule types (protein, DNA, RNA) or bound chemicals. Additionally, the Filter field allows you to limit a search to records that have links to another Entrez database of interest. For example, a search for structure_biosystems[filter] will retrieve structure records that have links to the NCBI BioSystems database; a search for structure_omim[filter] will retrieve structure records that have links to the Online Mendelian Inheritance in Man (OMIM) database; and a search for structure_biosystems[filter] AND structure_omim[filter] will retrieve the subset of records that have links to both of those databases.

    and more...  The Structure database can also be searched by terms that appear in any of the other search fields.


    Search Methods back to top

    A variety of techniques can be used to search the database, offering varying degrees of control over your query. In some cases, they offer alternative ways of executing the same search (as is true for sample searches #4, #5, and #6 below), with each method offering different benefits. The search methods include:
    Method Description Example
    Basic Search
  • Just enter search terms without specifying search fields, other limits, or Boolean operators.


  • The "Search Details" box in the right margin of the search results page shows exactly how Entrez parsed and handled your query. If desired, you can edit the query in that box and press the "Search" button to run the modified query.

    The "See more..." link a the bottom of the "Search Details" box opens a more detailed display:
    • The Query Translation box shows the search strategy used to run the search
      • To edit the search in the Query Translation box, add or delete terms and then click Search.
      • Click URL to display the current search as a URL to bookmark for future use. Searches created using History numbers can not be saved using the URL feature.
      • You may also save your search using My NCBI.
    • The Result number link retrieves the documents found and displays them in a search results page.
    • Translations details how each term was translated using Entrez's search rules and syntax for the database.
    • User Query shows the search terms as you entered them in the search box and any syntax errors with the query.
    back to top Search #1:

    human p53 tumor suppressor

    will retrieve biosystems with those terms anywhere in the record.

    Some of the structure records might not contain proteins or nucleotide sequences from human because we did not limit that search term to the Organism search field. In such cases, the term "human" might appear in a comment or some other field of the record.

    Similarly, the term p53 tumor suppressor can appear anywhere in the record, and the words may or may not be adjacent to each other in a record, depending on how Entrez parsed the query (as shown in the Search Details for a given search). To force terms to be searched as a phrase, use quotes. To refine your search in other ways, use the Limits option or the Advanced Search methods described below.

    Limits

  • The Limits page allows you to restrict your search in various ways.

  • At a minimum, the Limits page displays the list of available search fields. You can do a separate search for each term or phrase in your query, as shown in sample Search #2 and #3 to the right, and select the desired search field for each one. (If desired, you can then combine the searches by using the Search Builder or History section of the Advanced Search page.)


  • For some databases, the Limits page also provides other commonly used options, as check boxes and/or pull-down menus, for restricting your search results to records with specific characteristics. These check boxes and pull-down menus generally represent a commonly used subset of the choices that are available from the Advanced Search page and are placed on the Limits page for easy access.


  • IMPORTANT NOTE: Once you have used a particular Limit, warning sign will appear near the top of your search results page that indicates which Limit(s) are currently in effect, for example:

    image of the Limits folder that displays a deactivated check box, showing that the limits you most recently selected for a search are no longer in effect

    Note that the Limit will remain in effect for all subsequent searches in the current database unless you change or remove that limit. In the illustrated example above, any search you do will be limited to the Titles of records, until you remove the limit.


  • back to top Search #2:

    On the Entrez Structure search page, click on the Limits link, select the Organism search field, and enter the following query:

    human

    and press "GO". That will retrieve only structure records that contain at least one molecular component (e.g., protein, DNA, or RNA) from human.


    Search #3:

    Open the Limits page again and clear your previous search. Change the search field selection to Title, enter the following query:

    p53 tumor suppressor

    and press "GO". That will retrieve only records containing those terms in the title of a structure record.

    If desired, you can then combine the searches on the Advanced Search page, either by using the Search Builder, as shown in sample Search #4, or by using the History section of that page, as shown in sample Search #5.

    Advanced Search back to top The Advanced Search page allows you to exercise greater control over your search, for example, by enabling you to:
    • Build a search one step at a time.
    • Browse the index of any search field and add term(s) of interest from the index to the active query box at the top of the page.
    • View your search History and combine or subtract searches from each other.
    As you build a query, either by using the Search Builder's pull-down menus, or by using the "Add" links in the "History" portion of the page to combine previous searches, the grey text box at the top of the page will display your current query.

    You can also manually edit the current query by clicking the "Edit" link beneath the grey text box. That will allow you to type terms/search numbers/etc. directly into the box, add parentheses for nesting if desired, change Boolean operators, etc.

    In addition, the following types of advanced searches can be entered in the query box of any Entrez search page (i.e., in the query box of the database's Home page, Limits page, or Advanced Search page):

    Search Builder

  • The "Search Builder" section of the Advanced Search page allows you to build your query step by step, adding a new search term and selecting a new search field at each step. It also allows you to browse the index of any search field to view the available terms.


  • To build a query:
    (1) Select the Search Field of interest using the pull-down menu.

    (2) Type a term(s) in the text box beside the search field menu. Or, use the "Show index list" link to see the index of the search field and select the desired term from the index. (tips on using the "Show Index List")

    (3) Select the Boolean operator (AND, NOT, OR) that should precede the term when it is added to the active query at the top of the page.

    Continue the above steps, as desired, to add more term/search field combinations to your query.
  • As you use the Search Builder, the grey text box at the top of the page will show your current query.
    You can manually edit the current query by clicking the "Edit" link beneath the grey text box. That will allow you to type terms/search numbers/etc. directly into the box, add parentheses for nesting if desired, change Boolean operators, etc.

    Press the Search button to display the records retrieved by your search (i.e., it displays the search results page).

    Click on the "Add to history" link if you prefer to simply add the query to your search history and remain on the Advanced Search page, where you can continue building your query.
  • Tips on using the "Show Index List" function on the Advanced Search page:
    The "Show Index List" function allows you to browse the index of any Search Field. If you select a search field and press the "Show Index" link without entering a term in the box, you will be taken to the top of the index. If you enter a term first, you will be taken to the part of the index that contains your term (or the closest alphabetical location, if your term is not present in the index).

    The number of records that contain the term will appear in parentheses. You can also browse the index to explore the variety of terms available (for example, select "All Fields", enter "Huntington", and click on the "Show Index" link to see additional spellings and/or related terms, such as Huntington disease, Huntington's, Huntington's disease).

    illustration showing how the Index button can be used to view the list of terms that are available in the selected search field

    To select a range of terms from the index, use the Shift key while selecting the first and last term. Then use the AND, OR, or NOT buttons to add that group of terms to the active query.

    To select multiple terms that do not fall within a continuous range from the index, use the Control key while selecting the terms of interest. Then use the AND, OR, or NOT buttons to add that group of terms to the active query.

    Note: When multiple terms are selected from the index window, they are OR'ed together within parentheses and then appended to your query with whatever Boolean operator you have selected.
  • back to top Search #4:

    On the Entrez Structure search page, click on Advanced Search and build your search one step at a time:

    (a) Using the first pull-down menu in Search Builder, select the Organism search field and enter the following query:

    human

    and select "AND" as the Boolean operator. That term/search field selection will automatically be displayed in the grey text box at the top of the page, which shows your current query.


    (b) Using the second pull-down menu in Search Builder, select the Title search field and enter the following query:

    p53 tumor suppressor

    and select "AND" as the Boolean operator. That newest term/search field selection will automatically be added to the grey text box at the top of the page.


    (c) Your query will now appear as:

    human[Organism] AND p53 tumor suppressor[Title]

    Press the Search button if you want to display the records retrieved by your search (i.e., it displays the search results page).

    Or, click on the "Add to history" link if you prefer to just add the query to your search history and remain on the Advanced Search page, where you can continue building your query.


    Note that this search will produce the same results as sample searches #5 and #6. It is simply executed in a different way. That is, you remain on a single query page (Advanced search) and can browse the index of any search field as you build your query one step at a time.

    History

  • The "History" section of the Advanced Search page displays the searches you have done in the current database.


  • You can combine or subtract searches from each other by entering the search numbers and the AND, OR, or NOT Boolean operators in the query box, for example: #2 AND #3. If the query contains several search numbers and Boolean operators, the Boolean operators are processed from left to right unless parentheses are used for nesting. If parentheses are used, the portions of the query in parentheses will be processed first, then the remaining Boolean operators will be processed from left to right.


  • Additional details about Search History:
    • The Search History will be lost after 8 hours of inactivity. (To save a search indefinitely, click on the search # and select "Save in My NCBI.)
    • Click "Clear History" to delete all searches from History.
    • Entrez will move a search statement number to the top of the History if a new search is the same as a previous search.
    • History search numbers may not be continuous because some numbers are assigned to intermediate processes, such as displaying a citation in another format.
    • The maximum number of searches held in History is 100. Once the maximum number is reached, PubMed will remove the oldest search from the History to add the most current search.
    • A separate Search History will be kept for each database, although the search statement numbers will be assigned sequentially for all databases.
    • PubMed uses cookies to keep a history of your searches. For you to use this feature, your Web browser must be set to accept cookies.
    • Database records that you have copied to the Clipboard are represented by the search number #0, which may be used in Boolean search statements. For example, to limit the records you have collected in the Clipboard to those from human, use the following search: #0 AND human[organism]. This does not change or replace the Clipboard contents.
    back to top Search #5:

    Use the search numbers shown in the "History section" of the advanced search page to combine previous searches (for example, searches #2 and #3 shown above).

    To do that, you can either:

    Click on the "Edit" link beneath the grey text box and type in a search statement such as:

    #2 AND #3

    Or, instead of typing the search statement, use the "Add" link beside any search number in the "History" section of the Advanced Search page to add that search number into the grey text box.

    That will retrieve only records that contain human in the Organism field (i.e., records that contain at least one molecular component -- protein, DNA, or RNA -- from human) and p53 tumor suppressor in the Title field. Compare the retrieval from this search with that of the sample basic search above.

    (Note that your search numbers might be different from those shown here, if you did earlier searches in the Entrez system before trying these examples.)

    Complex Boolean Whether you are on the Basic search page (i.e., the database's home page), the Limits page, or the Advanced search page, you can:

  • Enter a search in command language, specifying your exact combination of desired search terms, search fields, and Boolean operators, as shown in the examples to the right. The syntax is:

        term[field] BOOLEAN term[field] BOOLEAN term[field] etc.


  • Search Field names must be placed in square brackets [], and can be written as either the full name, for example, [Database], or as the corresponding search field abbreviation, for example, [db]  (additional examples).


  • Boolean operators (AND, OR, NOT) must be written in UPPER CASE.


  • Boolean operators are processed from left to right unless parentheses are used for nesting. If parentheses are used, the portions of the query in parentheses will be processed first, then the remaining Boolean operators will be processed from left to right.


  • Boolean operators can also be used to combine or subtract searches from each other (i.e., to find the union, difference, or intersection of the data sets retrieved by various searches). To do this, use the Search History section of the Advanced Search page and simply enter the search numbers and desired Boolean operators in the query box.

    For example, to identify the records that were retrieved by Search #2 of your search history, and also by Search #3, you could enter the following query:

    #2 AND #3

    To identify the records that were retrieved by Search #2 but not by Search #3, you could enter the following query:

    #2 NOT #3


  • back to top Search #6:

    Simply enter all search terms and search fields as a single statement into the query box:

    human[Organism] AND p53 tumor suppressor[Title]

    Note that this search will produce the same results as sample searches #4 and #5, but it takes only a single step when entered directly into the search box as a Boolean query.


    Search #7:

    (prostaglandin H2 synthase OR prostaglandin endoperoxide synthase) NOT (primates[Organism] OR rodents[Organism])

    This search will retrieve structure records that contain the terms prostaglandin H2 synthase OR prostaglandin endoperoxide synthase in any field, but that will not contain molecular components (proteins, DNA, RNA) from organisms in the taxonomic orders Primata or Rodentia.
    Range Search
  • Range queries are constructed by specifying a lower and upper numerical value separated by a colon (:) to specify the range, followed by a search field name or abbreviation in square brackets, as shown in the examples to the right. You can insert a space on each side of the colon but that is not necessary; the search will work either way.

    All dates and all 'counts' (such as residue counts, molecule counts, etc.) fields can be range queried. Apart from that, there are two additional fields that can be range queried: Resolution [RESO] in the Entrez Structure database, and MolWeight [MWT] in the Entrez Protein database (from which you can link to the Structure database).

  • Range queries on Resolutions [RESO] (in angstroms) must have the following format:

         fromResolution : toResolution [RESO]

  • Range queries on MolecularWeights [MWT] (in daltons) must have the following format:

         fromMolecularWeight : toMolecularWeight [MWT]

    Note that searches by molecular weight are currently possible only in the Entrez Protein database. When you are searching that database, simply append "AND srcdb_pdb[prop]" to your query if you want to retrieve only the protein sequences that were derived from 3D structure records. For example:

         _____:_____[molwt] AND srcdb_pdb[prop]

    That will retrieve protein sequences that fall within the specified molecular weight range and that were derived from Protein Data Bank (PDB), the source database for 3D structure records. A specific example is provided in Search #10 to the right.


  • Range queries on Dates have a similar format:

         FromDate : ToDate [fieldname]

    Note: The FromDate and ToDate values can specify an exact date, a month, or a year, and are written in the format: YYYY/MM/DD, YYYY/MM, or YYYY. The search fields summary table includes the names and abbreviations for the various "date" fields.

  • Range queries on "counts" have the format:

         FromCount : ToCount [fieldname]

    Note: The FromCount and ToCount values are integers. The search fields summary table includes the names and abbreviations for the various "counts" fields.


  • back to top Search #8:

    001.50 : 001.75[Resolution]

    This search of the Entrez Structure database will retrieve records that have a resolution between 1.50 to 1.75 Angstroms.


    Search #9:

    3 : 5[LigCount]

    This search of the Entrez Structure database will retrieve structures that have three to five different types of ligands (bound chemicals) in their biological unit.

    (A separate document describes how to find 3D protein structures bound to a specific chemical.)


    Search #10:

    Search the Entrez Protein database for:

    4060 : 4075[Molwt] AND srcdb_pdb[prop]

    That will retrieve protein sequences that have a molecular weight between 4060 and 4075 Daltons and that were derived from 3D structure records. Each protein sequence record will have a link to the corresonding structure record. Alternatively, you can select the "Find Related Data:Structure" option in the right margin of the search results page to retrieve the complete set of structure records that corresponds to the set of protein records you retrieved. (more details about protein → structure links...)

    Additional details about search methods and options are provided in the: (1) PubMed help document (including information about temporarily saving records from your search results to the Clipboard); (2) My NCBI help document (including information about Saving search strategies and indefinitely saving records from your search results into your My NCBI Collections); and (3) general Entrez help document.

    Search Fields back to top

    Search fields can be selected from pop-up menus on either the Limits or Advanced Search page, or can be typed directly in your query by surrounding field names with square brackets [], for example, [Organism] or [Orgn].* The Show index link on the Advanced Search page allows you to browse the index of each search field, where you can see the available terms, the number of records containing each term or phrase, as well as the syntax for entering values in search fields such as dates and EC/RN number.

    The currently available fields include:

    All Fields
    Abstract
    ASU Biopolymer Count
    ASU DNA Molecule Count
    ASU Chemical Count
    ASU Other Molecule Count
    ASU Protein Molecule Count
    ASU RNA Molecule Count
    Author
    BioUnit Biopolymer Count
    BioUnit DNA Molecule Count
    BioUnit Chemical Count
    BioUnit Molecular Weight
    BioUnit Other Molecule Count
    BioUnit Protein Molecule Count
    BioUnit RNA Molecule Count
    Chemical Name
    Chemical Synonyms
    Conserved Domain Database Description
    Conserved Domain Description
    Conserved Domain PSSMID
    Conserved Domain Short Name
    Conserved Domain Title
    Conserved Domain Superfamily Description
    Conserved Domain Superfamily PSSMID
    Conserved Domain Superfamily Short Name
    Conserved Domain Superfamily Title
    DNA Name
    EC/RN Number
    Experimental Method
    Gene Description
    Gene Name
    Filter
    Journal
    MMDB Entry Date
    MMDB ID
    MMDB Modify Date
    Number of PDB Records per Structure
    Oligomeric State
    Organism
    Other Molecule Name
    PDB Accession
    PDB Chemical Code
    PDB Class
    PDB Comment
    PDB Deposit Date
    PDB Description
    PDB File Count
    PDB Source
    Protein Name
    Resolution
    RNA Name
    Title


    Field name Abbreviation* Description Sample Search
    All Fields [ALL] Searches the complete database record back to top of document List of MMDB Search Fields "p53 tumor suppressor"[all]

    will retrieve the structure records that contain the phrase "p53 tumor suppressor" in any field of the record.

    (Compare these search results with those obtained by the sample Citation Abstract Field search, which will retrieve structure records containing that phrase in the abstract of an associated PubMed record, and with those obtained by the sample Title field search, which will retrieve records containing that phrase only in the title of an associated PubMed record.)

    The quotes surrounding the search terms ensure they are searched as a phrase.**
    Abstract [Abstract]
    [ABS]
    [ABST]
    The abstract (if available) of any PubMed reference linked to the structure. back to top of document List of MMDB Search Fields "p53 tumor suppressor"[abstract]

    will retrieve the structure records that contain the phrase "p53 tumor suppressor" in the abstract of a PubMed reference associated with the structure.

    (Compare these search results with those obtained by the sample All fields search, which will retrieve records containing that phrase in any field of the structure record, and with those obtained by the sample Title field search, which will retrieve records containing that phrase only in the structure title.)

    The quotes surrounding the search terms ensure they are searched as a phrase.**
    ASU Biopolymer Count [AsuBiopolymerCount]
    [ABPC]
    [ASUBPC]
    The total number of biopolymers (protein, DNA, and/or RNA molecules) in the raw data for the structure (i.e., in the "asymmetric unit," or "ASU").
    (Compare with "BioUnit Biopolymer Count.")

    This field can be queried for a single value or a range of values.

    Note: Some structures may have a biopolymer count of zero, and can be retrieved by a search for:
        0[AsuBiopolymerCount]
    These can include structure records that contain only chemicals (such as peptide-like antiobiotics), peptide nucleic acids (PNAs), or protein or nucleotide sequences composed of ≥ 50% modified amino acids or nucleotides.


    A separate file shows how to retrieve all available 3D structures for a specific type of molecule (protein, RNA, DNA, protein+chemical, etc.).

    In addition, the "Retrieve 3D Structures that have..." blue buttons near the bottom of the 3D Macromolecular Structures resources page and Entrez Structure search page allow you to retrieve various molecule combinations (Protein+Chemical, RNA+Chemical, etc.) with a single click.
    back to top of document List of MMDB Search Fields 3 : 8 [ABPC]     or

    3[ABPC] : 8[ABPC]    or

    3 : 8[AsuBiopolymerCount]    

    etc.

    will retrieve structure records that contain anywhere from three to eight biopolymers (protein, DNA, and/or RNA) in the raw data (asymmetric unit) for a structure.

    As you can see by clicking on the Details folder tab after doing the search, each query above is translated to:

    3[AsuBiopolymerCount] : 8[AsuBiopolymerCount]

    (more about range searching...)

    ASU DNA Molecule Count [AsuDNAMoleculeCount]
    [ADMC]
    [ASUDMC]
    The number of DNA molecules in the raw data for the structure (i.e., in the "asymmetric unit," or "ASU").
    (Compare with "BioUnit DNA Molecule Count.")

    This field can be queried for a single value or a range of values.

    A separate file shows how to retrieve all available 3D structures for a specific type of molecule (protein, RNA, DNA, protein+chemical, etc.).

    In addition, the "Retrieve 3D Structures that have..." blue buttons near the bottom of the 3D Macromolecular Structures resources page and Entrez Structure search page allow you to retrieve various molecule combinations (Protein+Chemical, RNA+Chemical, etc.) with a single click.
    back to top of document List of MMDB Search Fields 2 : 6 [ADMC]     or

    2[ADMC] : 6[ADMC]    or

    2 : 6[AsuDNAMoleculeCount]    

    etc.

    will retrieve structure records that contain anywhere from two to six DNA molecules in the raw data (asymmetric unit) for a structure.

    As you can see by clicking on the Details folder tab after doing the search, each query above is translated to:

    2[AsuDNAMoleculeCount] : 6[AsuDNAMoleculeCount]

    (more about range searching...)

    ASU Chemical Count [AsuLigCount]
    [ALCT]
    [ASULC]
    The number of different types of chemicals (not the total number of bound chemicals) in the raw data for the structure (i.e., in the "asymmetric unit," or "ASU"). The bound chemicals are sometimes referred to as "ligands," hence the abbreviation [AsuLigCount].
    (Compare with "BioUnit Ligand Count.")

    This field can be queried for a single value or a range of values.

    A separate file shows how to find 3D structures bound to a specific chemical (e.g., aspirin).

    In addition, the "Retrieve 3D Structures that have..." blue buttons near the bottom of the 3D Macromolecular Structures resources page and Entrez Structure search page allow you to retrieve various molecule combinations (Protein+Chemical, RNA+Chemical, etc.) with a single click.
    back to top of document List of MMDB Search Fields 3 : 5 [ALCT]     or

    3[ALCT] : 5[ALCT]     or

    3 : 5[AsuLigCount]

    will retrieve structures that have three to five different types of bound chemicals (ligands) in their "asymmetric unit" (ASU).

    (A separate document describes how to find 3D protein structures bound to a specific chemical.)
    ASU Other Molecule Count [AsuOtherMoleculeCount]
    [AOCT]
    [ASUOMC]
    The number of molecules in the raw data for the structure (i.e., in the "asymmetric unit," or "ASU") that are not classified as a protein, DNA, RNA, or chemical, and therefore fall into the category of "other." (Compare ASU Other Molecule Count, described here, with "BioUnit Other Molecule Count.")

    The "other" molecules are generally non-standard biopolymers. Examples include nucleotide or protein sequences that contain a large percentage of non-standard residues, long sugar chains (e.g., 1HPN), artificial constructs that contain a polypeptide backbone and nucleotide side chains (e.g., 1PUP), etc.

    This field can be queried for a single value or a range of values.

    Additional notes:

    A separate file shows how to retrieve all available 3D structures for a specific type of molecule (protein, RNA, DNA, protein+chemical, etc.).

    In addition, the "Retrieve 3D Structures that have..." blue buttons near the bottom of the 3D Macromolecular Structures resources page and Entrez Structure search page allow you to retrieve various molecule combinations (Protein+Chemical, RNA+Chemical, etc.) with a single click.
    back to top of document List of MMDB Search Fields 4 : 6 [AOCT]     or

    4[AOCT] : 6[AOCT]    or

    4 : 6[AsuOtherMoleculeCount]    

    etc.

    will retrieve structure records that contain anywhere from four to six protein molecules in the raw data (asymmetric unit) for a structure.

    As you can see by clicking on the Details folder tab after doing the search, each query above is translated to:

    4[AsuOtherMoleculeCount] : 6[AsuOtherMoleculeCount]

    (more about range searching...)

    ASU Protein Molecule Count [AsuProteinMoleculeCount]
    [APMC]
    [ASUPMC]
    The number of protein molecules in the raw data for the structure (i.e., in the "asymmetric unit," or "ASU").
    (Compare with "BioUnit Protein Molecule Count.")

    This field can be queried for a single value or a range of values.

    A separate file shows how to retrieve all available 3D structures for a specific type of molecule (protein, RNA, DNA, protein+chemical, etc.).

    In addition, the "Retrieve 3D Structures that have..." blue buttons near the bottom of the 3D Macromolecular Structures resources page and Entrez Structure search page allow you to retrieve various molecule combinations (Protein+Chemical, RNA+Chemical, etc.) with a single click.
    back to top of document List of MMDB Search Fields 4 : 6 [APMC]     or

    4[APMC] : 6[APMC]    or

    4 : 6[AsuProteinMoleculeCount]    

    etc.

    will retrieve structure records that contain anywhere from four to six protein molecules in the raw data (asymmetric unit) for a structure.

    As you can see by clicking on the Details folder tab after doing the search, each query above is translated to:

    4[AsuProteinMoleculeCount] : 6[AsuProteinMoleculeCount]

    (more about range searching...)

    ASU RNA Molecule Count [AsuRNAMoleculeCount]
    [ARMC]
    [ASURMC]
    The number of RNA molecules in the raw data for the structure (i.e., in the "asymmetric unit," or "ASU").
    (Compare with "BioUnit RNA Molecule Count.")

    This field can be queried for a single value or a range of values.

    A separate file shows how to retrieve all available 3D structures for a specific type of molecule (protein, RNA, DNA, protein+chemical, etc.).

    In addition, the "Retrieve 3D Structures that have..." blue buttons near the bottom of the 3D Macromolecular Structures resources page and Entrez Structure search page allow you to retrieve various molecule combinations (Protein+Chemical, RNA+Chemical, etc.) with a single click.
    back to top of document List of MMDB Search Fields 6 : 10 [ARMC]     or

    6[ARMC] : 10[ARMC]    or

    6 : 10[AsuRNAMoleculeCount]    

    etc.

    will retrieve structure records that contain anywhere from six to ten RNA molecules in the raw data (asymmetric unit) for a structure.

    As you can see by clicking on the Details folder tab after doing the search, each query above is translated to:

    6[AsuRNAMoleculeCount] : 10[AsuRNAMoleculeCount]

    (more about range searching...)

    Author [AU]
    [AUTH]
    The name of any author associated with any PubMed reference linked to the structure.

    The format to search this field is: last name followed by a space and up to the first two initials followed by a space and a suffix abbreviation, if applicable, all without periods or a comma after the last name (e.g., o'neil kt[auth] OR o'connell jd 3r[auth]).

    Entrez automatically truncates on an author's name to account for varying initials, e.g., o'neil k [au] will retrieve o'neil ka, o'neil kt, etc, in addition to o'neil k. To turn off this automatic truncation, enclose the author's name in double quotes, e.g., a search for "o'neil k"[auth] will retrieve just o'neil k.

    Initials and suffixes may be omitted when searching, if desired. In that case, all authors with the specified last name will be retrieved, regardless of their initials.

    back to top of document List of MMDB Search Fields pavletich np[au]


    loll pj[auth]


    will retrieve structure records by those authors
    BioUnit Biopolymer Count [BiopolymerCount]
    [BPC]
    [BUBPC]
    The total number of biopolymers (protein, DNA, and/or RNA molecules) in the biological unit ("biounit") of the structure.
    (Compare with "ASU Biopolymer Count.")

    This field can be queried for a single value or a range of values.

    Note: Some structures may have a biopolymer count of zero, and can be retrieved by a search for:
        0[BiopolymerCount]
    These can include structure records that contain only chemicals (such as peptide-like antiobiotics), peptide nucleic acids (PNAs), or protein or nucleotide sequences composed of ≥ 50% modified amino acids or nucleotides.


    A separate file shows how to retrieve all available 3D structures for a specific type of molecule (protein, RNA, DNA, protein+chemical, etc.).

    In addition, the "Retrieve 3D Structures that have..." blue buttons near the bottom of the 3D Macromolecular Structures resources page and Entrez Structure search page allow you to retrieve various molecule combinations (Protein+Chemical, RNA+Chemical, etc.) with a single click.
    back to top of document List of MMDB Search Fields 3 : 8 [BPC]     or

    3[BPC] : 8[BPC]    or

    3 : 8[BiopolymerCount]    

    etc.

    will retrieve structure records that contain anywhere from three to eight biopolymers (protein, DNA, and/or RNA) in the biological unit ("biounit") of the structure.

    As you can see by clicking on the Details folder tab after doing the search, each query above is translated to:

    3[BiopolymerCount] : 8[BiopolymerCount]

    (more about range searching...)

    BioUnit DNA Molecule Count [DNAMoleculeCount]
    [DMC]
    [BUDMC]
    The number of DNA molecules in the biological unit ("biounit") of the structure.
    (Compare with "ASU DNA Molecule Count.")

    This field can be queried for a single value or a range of values.

    A separate file shows how to retrieve all available 3D structures for a specific type of molecule (protein, RNA, DNA, protein+chemical, etc.).

    In addition, the "Retrieve 3D Structures that have..." blue buttons near the bottom of the 3D Macromolecular Structures resources page and Entrez Structure search page allow you to retrieve various molecule combinations (Protein+Chemical, RNA+Chemical, etc.) with a single click.
    back to top of document List of MMDB Search Fields 2 : 6 [DMC]     or

    2[DMC] : 6[DMC]    or

    2 : 6[DNAMoleculeCount]    

    etc.

    will retrieve structure records that contain anywhere from two to six DNA molecules in the biological unit ("biounit") of the structure.

    As you can see by clicking on the Details folder tab after doing the search, each query above is translated to:

    2[DNAMoleculeCount] : 6[DNAMoleculeCount]

    (more about range searching...)

    BioUnit Chemical Count [LigCount]
    [LCNT]
    [BULC]
    The number of different types of bound chemicals (not the total number of bound chemicals) in the biological unit ("biounit") of the structure. The bound chemicals are sometimes referred to as "ligands," hence the abbreviation [LigCount].
    (Compare with "ASU Chemical Count.")

    This field can be queried for a single value or a range of values.

    A separate file shows how to find 3D structures bound to a specific chemical (e.g., aspirin).

    In addition, the "Retrieve 3D Structures that have..." blue buttons near the bottom of the 3D Macromolecular Structures resources page and Entrez Structure search page allow you to retrieve various molecule combinations (Protein+Chemical, RNA+Chemical, etc.) with a single click.
    back to top of document List of MMDB Search Fields 3 : 5 [LCNT]     or

    3[LCNT] : 5[LCNT]     or

    3 : 5[LigCount]

    will retrieve structures that have three to five different types of bound chemicals (ligands) in their biological unit.

    (A separate document describes how to find 3D protein structures bound to a specific chemical.)
    BioUnit Molecular Weight [MolecularWeight]
    [MW]
    [MWT]
    [MOLWT]
    [MolWeight]
    The molecular weight of the structure's biological unit ("biounit") in KiloDaltons (kDa).

    This field can be queried for a single value or a range of values.

    back to top of document List of MMDB Search Fields  
    BioUnit Other Molecule Count [OtherMoleculeCount]
    [OCNT]
    [BUOMC]
    The number of molecules in the biological unit ("biounit") of the structure that are not classified as a protein, DNA, RNA, or chemical, and therefore fall into the category of "other." (Compare BioUnit Other Molecule Count, described here, with "ASU Other Molecule Count.")

    The "other" molecules are generally non-standard biopolymers. Examples include nucleotide or protein sequences that contain a large percentage of non-standard residues, long sugar chains (e.g., 1HPN), artificial constructs that contain a polypeptide backbone and nucleotide side chains (e.g., 1PUP), etc.

    This field can be queried for a single value or a range of values.

    Additional notes:

    A separate file shows how to retrieve all available 3D structures for a specific type of molecule (protein, RNA, DNA, protein+chemical, etc.).

    In addition, the "Retrieve 3D Structures that have..." blue buttons near the bottom of the 3D Macromolecular Structures resources page and Entrez Structure search page allow you to retrieve various molecule combinations (Protein+Chemical, RNA+Chemical, etc.) with a single click.
    back to top of document List of MMDB Search Fields 4 : 6 [OCNT]     or

    4[OCNT] : 6[OCNT]    or

    4 : 6[OtherMoleculeCount]    

    etc.

    will retrieve structure records that contain anywhere from four to six protein molecules in the biological unit ("biounit") of the structure.

    As you can see by clicking on the Details folder tab after doing the search, each query above is translated to:

    4[OtherMoleculeCount] : 6[OtherMoleculeCount]

    (more about range searching...)

    BioUnit Protein Molecule Count [ProteinMoleculeCount]
    [PMC]
    [BUPMC]
    The number of protein molecules in the biological unit ("biounit") of the structure.
    (Compare with "ASU Protein Molecule Count.")

    This field can be queried for a single value or a range of values.

    A separate file shows how to retrieve all available 3D structures for a specific type of molecule (protein, RNA, DNA, protein+chemical, etc.).

    In addition, the "Retrieve 3D Structures that have..." blue buttons near the bottom of the 3D Macromolecular Structures resources page and Entrez Structure search page allow you to retrieve various molecule combinations (Protein+Chemical, RNA+Chemical, etc.) with a single click.
    back to top of document List of MMDB Search Fields 4 : 6 [PMC]     or

    4[PMC] : 6[PMC]    or

    4 : 6[ProteinMoleculeCount]    

    etc.

    will retrieve structure records that contain anywhere from four to six protein molecules in the biological unit ("biounit") of the structure.

    As you can see by clicking on the Details folder tab after doing the search, each query above is translated to:

    4[ProteinMoleculeCount] : 6[ProteinMoleculeCount]

    (more about range searching...)

    BioUnit RNA Molecule Count [RNAMoleculeCount]
    [RMC]
    [BURMC]
    The number of RNA molecules in the biological unit ("biounit") of the structure.
    (Compare with "ASU RNA Molecule Count.")

    This field can be queried for a single value or a range of values.

    A separate file shows how to retrieve all available 3D structures for a specific type of molecule (protein, RNA, DNA, protein+chemical, etc.).

    In addition, the "Retrieve 3D Structures that have..." blue buttons near the bottom of the 3D Macromolecular Structures resources page and Entrez Structure search page allow you to retrieve various molecule combinations (Protein+Chemical, RNA+Chemical, etc.) with a single click.
    back to top of document List of MMDB Search Fields 6 : 10 [RMC]     or

    6[RMC] : 10[RMC]    or

    6 : 10[RNAMoleculeCount]    

    etc.

    will retrieve structure records that contain anywhere from six to ten RNA molecules in the biological unit ("biounit") of the structure.

    As you can see by clicking on the Details folder tab after doing the search, each query above is translated to:

    6[RNAMoleculeCount] : 10[RNAMoleculeCount]

    (more about range searching...)

    Chemical Name [LNAM]
    [LIGN]
    [LNAME]
    The name of a ligand (chemical) that is present in a 3D structure record. This was derived from the "HETNAM"* record of the PDB source file and represents the name that the author of the structure used for the chemical.

    The same chemical might also be known by other names, which are indexed in the Chemical Synonyms search field. Use that field if you would like more comprehensive search results.

    For example, the author of the 1PTH structure, used the term "2-HYDROXYBENZOIC ACID" as the chemical name for the aspirin molecule bound to Prostaglandin H2 Synthase. A search of the "Chemical Name" field for "2-Hydroxybenzoic Acid" will therefore retrieve 1PTH (along with other structures in which the authors used the same chemical name). However, if you search the "Chemical Name" field for a term other than the one the author used in the HETNAM record of their PDB source file, you will not retrieve those structures.

    For broader search results, use the "Chemical Synonyms" field instead. That will allow you to enter any one of many names by which a chemical has been known. For example, you could search for either "2-Hydroxybenzoic Acid" or "salicylate" or "2-Carboxyphenol" (or another synonym) and you will retrieve all macromolecular structures that contain salicylic acid, regardless of the chemical name that the authors used for it.

    A separate file provides additional tips on how to find 3D structures bound to a specific chemical (e.g., aspirin).

    * Note: "HETNAM" is the PDB terminology for "heterogen name," which refers to any non-biopolymer that is present in a 3D structure record. The documentation about PDB file format provides more information about the various "records" (data fields), such as HETNAM, that are present in PDB source files.

    back to top of document List of MMDB Search Fields 2 hydroxybenzoic acid[LNAM]

    will retrieve structure records in which the author used the term "2 hydroxybenzoic acid" as the name of the chemical present in the 3D structure.

    Tip: To search for other names by which the chemical has been known, such as "salicylate" or "2-Carboxyphenol," use the Chemical Synonyms search field.
    Chemical Synonyms [ChemSyn]
    [CSYN]
    The various names by which a given chemical structure has been known.

    For example, the terms "salicylate," "2-Hydroxybenzoic acid," "o-hydroxybenzoic acid," "2-Carboxyphenol," "o-Carboxyphenol," "2-hydroxy(1-14c)benzoic acid," etc. have been used to refer to the chemical structure of salicylic acid. You can search the "Chemical Synonym" field for any of those terms in order to retrieve all of the 3D macromolecular structures that contain the chemical that is described in the corresponding PubChem Compound record (CID 338).

    The chemical names in this search field represent the filtered synonyms from PubChem Compound records that correspond to the chemicals present in the 3D macromolecular structure records.

    A separate file provides additional tips on how to find 3D structures bound to a specific chemical (e.g., aspirin).

    back to top of document List of MMDB Search Fields salicylate[ChemSyn]

    will retrieve 3D macromolecular structure records that contain the chemical shown in the PubChem Compound record for salicylic acid (CID 338), regardless of the chemical name that was used by the submitter of the 3D macromolecular structure.

    This search, for example, will retrieve 1PTH structure (among others), even though the submitter of 1PTH used the term "2-Hydroxybenzoic Acid" instead of the term "salicylate" to refer to the chemical that is bound to Prostaglandin H2 Synthase.
    Conserved Domain Database Description See Conserved Domain Superfamily Description
    Conserved Domain Description [CDDF]
    [CDSUBDefline]
    Any term from the description of a conserved domain model.

    Example:  "sedolisin" is a term in the description of the NCBI-curated conserved domain model cd04056, which has the short name "Peptidases_S53," full title "Peptidase domain in the S53 family," and PSSMID 173788.

    Note: A search of this field will retrieve 3D structures that contain at least one protein molecule annotated with a specific hit to a conserved domain model whose description includes your query term.

    A separate help document provides additional information about conserved domains.
    back to top of document List of MMDB Search Fields sedolisin[CDDF]

    will retrieve 3D structures that contain at least one protein molecule annotated with a specific hit to a conserved domain whose description includes the term "sedolisin."

    (For example, it will retrieve 3D structures such as 1GT9: "Thermostable Serine-carboxyl Type Proteinase, Kumamolisin," which contains a protein molecule annotated with cd04056.)
    Conserved Domain PSSMID [CDID]
    [CDSBID]
    [CDSUBID]
    The position-specific scoring matrix (PSSM) identifier of a conserved domain that has been annotated as a specific hit on one or more protein molecules in a structure.

    Example:  "173788" is the PSSMID of the NCBI-curated conserved domain model cd04056, which has the short name "Peptidases_S53" and full title "Peptidase domain in the S53 family."

    Note: A search of this field will retrieve 3D structures that contain at least one protein molecule annotated with a specific hit to aconserved domain model bearing the PSSMID of interest.

    A separate help document provides additional information about conserved domains.
    back to top of document List of MMDB Search Fields 173788[CDID]

    will retrieve 3D structures that contain at least one protein molecule annotated with a specific hit to the conserved domain whose PSSMID is 173788.
    Conserved Domain Short Name [CDSN]
    [CDSUBName]
    The short name of a conserved domain.

    Example:  "Peptidases_S53" is the short name of the NCBI-curated conserved domain model cd04056, which has the full title "Peptidase domain in the S53 family" and PSSMID 173788.

    Note: A search of this field will retrieve 3D structures that contain at least one protein molecule annotated with a specific hit to a conserved domain model bearing the short name of interest.

    For a more comprehensive search (for example, to retrieve structures annotated with any domain model that belongs to the Peptidases_S8_S53 Superfamily), please search the Conserved Domain Superfamily Title or Conserved Domain Superfamily Description field instead (using a term such as peptidase) for boader search results.

    A separate help document provides additional information about conserved domains.
    back to top of document List of MMDB Search Fields Peptidases_S53[CDSN]

    will retrieve 3D structures that contain at least one protein molecule annotated with a specific hit to a conserved domain model that the short name of "Peptidases_S53."

    Note: Query term(s) are not case sensitive, so you can enter your search in upper case, lower case, or mixed case.
    Conserved Domain Title [CDDT]
    [CDSUBTitle]
    The title of a conserved domain.

    Example:  "Peptidase domain in the S53 family" is the title of the NCBI-curated conserved domain model cd04056, which has the short name "Peptidases_S53"and PSSMID 173788.

    Note: A search of this field will retrieve 3D structures that contain at least one protein that has been annotated with a specific hit to a conserved domain model bearing the title of interest.

    A separate help document provides additional information about conserved domains.
    back to top of document List of MMDB Search Fields peptidase[CDDT]

    will retrieve 3D structures that contain at least one protein molecule annotated with a specific hit to a conserved domain model that has the term "peptidase" in its title.

    Conserved Domain Superfamily Description

    [Note: this field currently appears as "Conserved Domain Database Description" in the search field menu of the Entrez Structure database]
    [SPDF]
    [CDDSPDefline]
    Any term from the description of a conserved domain superfamily.

    Example:  "subtilisin" is a term in the description of the conserved domain superfamily cl10459, which has the short name "Peptidases_S8_S53 Superfamily," full title "Peptidase domain in the S8 and S53 families," and PSSMID 209143.

    Note: A search of this field will retrieve 3D structures that contain at least one protein molecule annotated with a conserved domain superfamily whose description includes your query term.

    A separate help document provides additional information about conserved domains.
    back to top of document List of MMDB Search Fields subtilisin[SPDF]

    will retrieve 3D structures that contain at least one protein molecule annotated with a conserved domain superfamily whose description includes the term "subtilisin."

    (For example, it will retrieve 3D structures such as 1GT9: "Thermostable Serine-carboxyl Type Proteinase, Kumamolisin," which contains a protein molecule annotated with cl10459.)
    Conserved Domain Superfamily PSSMID [SFID]
    [CDSUPID]
    The position-specific scoring matrix (PSSM) identifier of a conserved domain superfamily that has been annotated on one or more protein molecules in a structure.

    Example:  "209143" is the PSSMID of the conserved domain superfamily cl10459, which has the short name "Peptidases_S8_S53 Superfamily" and full title "Peptidase domain in the S8 and S53 families."

    Note: A search of this field will retrieve 3D structures that contain at least one protein molecule annotated with a conserved domain superfamily bearing the PSSMID of interest.

    A separate help document provides additional information about conserved domains.
    back to top of document List of MMDB Search Fields 209143[SFID]

    will retrieve 3D structures that contain at least one protein molecule annotated with a conserved domain superfamily whose PSSMID is 209143.
    Conserved Domain Superfamily Short Name [SPFN]
    [CDDSPName]
    The short name of a conserved domain superfamily.

    Example:  "Peptidases_S8_S53 Superfamily" is the short name of the conserved domain superfamily cl10459, which has the full title "Peptidase domain in the S8 and S53 families" and the PSSMID 209143."

    Note: A search of this field will retrieve 3D structures that contain at least one protein molecule annotated with a conserved domain superfamily bearing the short name of interest.

    A separate help document provides additional information about conserved domains.
    back to top of document List of MMDB Search Fields Peptidases_S8_S53[SPFN]

    will retrieve 3D structures that contain at least one protein molecule annotated with a conserved domain superfamily that the short name of "Peptidases_S8_S53."

    Note: Query term(s) are not case sensitive, so you can enter your search in upper case, lower case, or mixed case.
    Conserved Domain Superfamily Title [SPTL]
    [CDDSUPT]
    The title of a conserved domain superfamily.

    Example:  "Peptidase domain in the S8 and S53 families" is the title of the conserved domain superfamily cl10459, which has the short name "Peptidases_S8_S53 Superfamily" and the PSSMID 209143."

    Note: A search of this field will retrieve 3D structures that contain at least one protein molecule annotated with a conserved domain superfamily bearing the title of interest.

    A separate help document provides additional information about conserved domains.
    back to top of document List of MMDB Search Fields peptidase[SPTL]

    will retrieve 3D structures that contain at least one protein molecule annotated with a conserved domain superfamily that has the term "peptidase" in its title.
    DNA Name [DNAM]
    [DNAME]
    [DNAName]
    The name of an DNA molecule in a structure record. The names of nucleotide molecules, including DNA and RNA, are derived from the COMPND record of the PDB source file.

    (The documentation about PDB file format provides more information about the various "records" (data fields) that are present in PDB source files.)

    The DNA name often reflects the sequence of nucleotides in the molecule itself.
    back to top of document List of MMDB Search Fields  
    EC/RN Number [EC] The Enzyme Commission (EC) number of the PDB structure, representing the classification of an enzyme based on the chemical reactions it catalyzes. The EC number is extracted from the "COMPND" record (data field) of a PDB file.

    This field can be queried with the wild-card (*) feature, for example:

    3.2.1.114 [EC]
    3.2.1.* [EC]
    3.2.*.* [EC]
    3.2.* [EC]

    and so on. Note the queries 3.2.*.* [EC] and 3.2.* [EC] will return identical set of PDB structures, so the two queries are equivalent.
    back to top of document List of MMDB Search Fields 3.2.1.114[EC]

    will retrieve structures classified with that specific enzyme commission number.


    3.2.1.*[EC]

    3.2.*.*[EC]

    3.2.*[EC]    

    use the wild card (*) to retrieve structure records that contain the digits specified, followed by any other digits.

    You can click on the Details folder tab of a search results page to see exactly how a query was handled by the Entrez system.

    Experimental Method [EXP]
    [EXPM]
    The experimental method used to characterize the protein structure. Most structures are resolved using X-ray crystallography or nuclear magnetic resonance (NMR) but additional methods also exist (e.g., electron microscopy).

    To see the full list of experimental methods available, open the Advanced Search page, select the ExpMethod search field in the Search Builder section, and press the Show index link to browse the index of available terms.

    back to top of document List of MMDB Search Fields   x_ray[exp]      or
    "x ray"[exp]

    will retrieve structures resolved by X-ray crystallography.

    nmr[exp]

    will retrieve structures resolved by nuclear magnetic resonance.

    "electron microscopy"[exp]

    will retrieve structures resolved by electron microscopy.
    Gene Description [GDSC]
    [GeneDescription]
    The description of the gene that codes for a protein molecule present in the structure record.

    (The gene description is the text that is present in the "summary" section of the corresponding Entrez Gene record.)

    The association between the gene names and the protein molecules has been made using the method described under "Find related data."

    back to top of document List of MMDB Search Fields "tumor suppressor"[GDSC]

    will retrieve structure records that contain the protein product of any gene that contains the term "tumor suppressor" in the gene's description.

    The quotes surrounding the search terms ensure they are searched as a phrase.**
    Gene Name [GN]
    [GENE]
    [GNAME]
    [GeneName]
    The name of the gene that codes for a protein molecule present in the structure record.

    Because a gene may be known by a variety of names, this search field includes the official symbol and the alternative ("also known as") gene symbols that are listed in the corresponding Entrez Gene record.

    For example, the Entrez Gene record for the human tumor protein p53 is known by the following names:
    Official Symbol: TP53
    Also known as: P53; LFS1; TRP53

    You can enter any of those terms in a search of the Gene Name field in order to retrieve structures that contain the protein product.

    The association between the gene names and the protein molecules has been made using the method described under "Find related data."

    back to top of document List of MMDB Search Fields TP53[GENE]

    will retrieve structure records that contain the protein product of the TP53 (tumor protein p53) gene.
    Filter [FILT] The "Filter" search field allows you to narrow your retrieval to records that have certain attributes, such as record type (e.g., structures resolved using x-ray crystallography or NMR, which can also be retrieved via the ExpMethod field).

    The "Filter" field also allows you to limit search results to structure records that have links to other Entrez databases of interest, as shown in the sample search to the right. A detailed explanation of each type of link is provided in the description of an Entrez search results page.

    The Filter field can also be used to view current database statistics, by entering a search for All[Filt], as shown in the example in the next column.

    back to top of document List of MMDB Search Fields nmr[filt]

    will retrieve only that record type from the Structure database.

    structure_pccompound[filt]

    will retrieve the structure records that have associated data (i.e., bound chemicals) in the PubChem Compound database.

    You can then open the "Display" menu near the top of the Structure search results page and select "Chemicals/PubChem Compound" to retrieve the PubChem records for bound chemicals that are present in the structures you have retrieved, or only for those whose checkboxes have been activated. (Conversely, it is possible to retrieve 3D structures that are bound to a specific chemical.)

    all[filt]

    will retrieve all of the structure database records, showing the total number retrieved. (Additional database statistics are available on the news page.)
    Journal [JOUR] The journal of the publication that reported the PDB structure findings. If more than one PubMed reference is associated with a structure record, the journal of each article has been indexed.

    Journal names can be written as full names or abbreviations. To see the list of journals, open the Advanced Search page, select the "Journal" search field in the Search Builder section, and press the Show index link to browse the index of available terms.

    back to top of document List of MMDB Search Fields Science[jour]

    will retrieve structures published in the journal Science.
    MMDB Entry Date [DDAT] The first date on which a particular MMDB ID appeared. This can represent the date on which a new Protein Data Bank structure record (i.e., a particular PDB accession) was first imported into MMDB, or the date on which a previously existing PDB record was significantly changed and therefore received a new MMDB ID.

    The syntax for searching the field is YYYY/MM/DD, YYYY/MM, or YYYY. The colon (:) can be used to search for a range of dates, for example, YYYY/MM/DD:YYYY/MM/DD[MDAT].

    Searches of this field will retrieve: (a) new structure records (PDB accessions) that were not previously in MMDB, and (b) PDB accessions that were previously in the database but that have changed in some significant way and have therefore received a new MMDB ID. For example, if the atoms in a previously available PDB data file were re-ordered during a PDB remediation the PDB accession will remain the same but it will receive a new MMDB ID and a new MMDBEntryDate.

    back to top of document List of MMDB Search Fields 2009[DDAT]

    will retrieve structure records that were first imported into MMDB, or that have changed significantly, in the year 2009.

    2009/01[DDAT]

    will retrieve new structure records that were first imported into MMDB, or that have changed significantly, in the month of January 2009.

    2009/01/10[DDAT] : 2009/01/25[DDAT]

    will retrieve new structure records that were first imported into MMDB, or that have changed significantly, anytime between January 10, 2009 and January 25, 2009.

    (more about range searching...)
    MMDB ID [MMDBID]
    [UID]
    [ID]
    The unique identifier (MMDB ID) of the structure record in the Molecular Modeling Database (MMDB). It is an integer assigned consecutively to each structure record processed by NCBI. For example, 50885 is the MMDB ID for sheep prostaglandin H2 synthase. (The summary page for a structure record shows both of its identifiers: MMDB ID and corresponding PDB ID. The latter is searchable in the PDB Accession field.)

    If you enter an integer as a query and do not specify a search field, the MMDB ID field will be searched by default.

    Note: The MMDB ID assigned to a PDB accession can change if there have been significant changes to the data in a record. For example, if the atoms in a previously available PDB data file were re-ordered during a PDB remediation the PDB accession will remain the same but it will receive a new MMDB ID and a new MMDBEntryDate. Obsolete MMDB IDs (e.g., 6543) cannot be retrieved through the Entrez Structure search interface, even with direct searches of the UID field, because they are no longer indexed. However, those obsolete MMDB IDs can be retrieved from the archival copy of the database by using the "Direct Fetch via UID" option on the MMDB Search Methods page.
    back to top of document List of MMDB Search Fields 50885[UID]

    will retrieve the structure record whose unique identification number is 50885.

    50885

    will also retrieve that same structure record, because the MMDB ID field is searched by default for queries that are only a string of digits.
    MMDB Modify Date [MDAT] The date on which the structure record was last modified. If no modifications were made since the record was deposited into MMDB, then MMDBModifyDate will be the same as the MMDBEntryDate.

    The syntax for searching the field is YYYY/MM/DD, YYYY/MM, or YYYY. The colon (:) can be used to search for a range of dates, for example, YYYY/MM/DD:YYYY/MM/DD[MDAT].

    Note about this field: When PDB undergoes a database remediation, in which most or all PDB records are updated in some way, MMDB imports the complete set of updated records. This was the case when the PDB database underwent a September 2007 remediation. Because the complete revised PDB data set was loaded into MMDB at that time, the earliest available value in the MMDBModifyDate field is 2007. Similarly, the release of PDB Archive Version 3.15 in March 2009 resulted in changes to a large subset of records, which is reflected in an MMDB MDAT of 2009/07 for approximately 20,000 records.
    back to top of document List of MMDB Search Fields The following searches will retrieve updated structure records that were previously in MMDB but that have changed in some way, as well as new structure records that became available during the specified period of time:

    2009[MDAT]

    will retrieve the structure records that were updated and newly added to MMDB in the year 2009.

    2009/01[MDAT]

    will retrieve the structure records that were updated and newly added to MMDB in the month of January 2009.

    2009/01/10[MDAT] : 2009/01/25[MDAT]

    will retrieve structure records that were updated and newly added to MMDB from January 10, 2009 through January 25, 2009.

    (more about range searching...)
    Number of PDB Records per Structure See PDB File Count
    Oligomeric State [OL]
    [OS]
    [OLIG]
    [OligomericState]
    A term representing the number of biopolymers (i.e., protein and nucleotide (RNA/DNA) molecule) in the structure's biological unit.

    For example, this search field contains terms such as:

    monomeric
    dimeric
    trimeric
    tetrameric
    pentameric
    hexameric
    octomeric
     9-meric
    10-meric
    ...
    23-meric
    ...
    60-meric

    As noted in the section of this document that describes the procedures used to identify the biological unit, the oligomeric state is derived from the "REMARK 350" record of the PDB source file. (The documentation about PDB file format provides more information about the various "records" (data fields) that are present in PDB source files.)

    Also note that the oligomeric state of a structure might reflect its bound state. For example, the PDB source file for 1TUP: "Tumor Suppressor P53 Complexed With DNA" defines the oligomeric state as pentameric (a trimer protein complexed with a DNA double helix).
    back to top of document List of MMDB Search Fields  
    Organism [ORGN] The source organism(s) of the protein and/or nucleotide molecules in the structure record. A common name (e.g., human), scientific name (e.g., Homo sapiens), or other taxonomic node (e.g, Primates or Primata) can be entered as a query.

    If a structure record contains protein or nucleotide sequences from more than one organism (e.g., human AND HIV1), the record can be retrieved by searching for any one of the source organisms.

    The summary page for an individual structure provides a list of the source organism(s). Each organism name links to the corresponding taxonomic information in the NCBI Taxonomy database, including the organism's Taxonomy ID (TaxID) and lineage.
    back to top of document List of MMDB Search Fields human[orgn]

    will retrieve structures with at least one molecular component from human.

    primates[orgn]

    will retrieve structures with at least one molecular component from any species falling in the order Primata.
    Other Molecule Name [ONAM]
    [ONAME]
    [OtherMoleculeName]
    The name of a molecule -- other than a protein, DNA, RNA, or ligand -- that is present in a structure record. The name is derived from the COMPND record of the PDB source file and represents the term used by the author for the molecule.

    (The documentation about PDB file format provides more information about the various "records" (data fields) that are present in PDB source files.)
    back to top of document List of MMDB Search Fields  
    PDB Accession [ACCN]
    [PACC]
    [PDBACC]
    The accession of number of the Protein Data Bank (PDB) record from which the MMDB record was derived, and is sometimes referred to as PDB ID. It is generally a four-character alphanumeric combination (e.g., 1PTH is the source record for MMDB ID 50885).

    The PDB ID shown on an MMDB search results page opens the corresponding MMDB structure summary page. The PDB ID on the structure summary page, in turn, links to the source record on the PDB web site.

    The record identifiers section of a structure summary page also lists the corresponding MMDB ID, which is searchable in the UID field.

    back to top of document List of MMDB Search Fields 1PTH[pdbacc]

    will retrieve the MMDB record for 1PTH, for sheep prostaglandin H2 synthase.
    PDB Chemical Code [LigCode]
    [LCOD]
    [LIGC]
    [LCODE]
    The 3-letter code of a ligand (bound chemical) in the PDB structure. For example, HEM is the ligand code for a heme group in a globin.

    A separate file shows how to find 3D structures bound to a specific chemical (e.g., aspirin).
    back to top of document List of MMDB Search Fields  
    PDB Class [PCLA]
    [PCLS]
    The classification of the PDB structure, as provided by the submitter in their data file.

    back to top of document List of MMDB Search Fields  
    PDB Comment [PCOM]
    [PCMT]
    The more detailed description of the PDB structure. This field contains text from the REMARK records in the PDB data file.

    back to top of document List of MMDB Search Fields  
    PDB Deposit Date [PDDAT] The earliest date that Protein Data Bank associates with an accession, generally representing the date on which the record was submitted to the PDB.

    The syntax for searching the field is YYYY/MM/DD, YYYY/MM, or YYYY. The colon (:) can be used to search for a range of dates, for example, YYYY/MM/DD:YYYY/MM/DD[MDAT].

    (Note that the PDB Deposit Date is not necessarily the date on which the record became publicly available, and may be significantly different from the release date if submitters requested their data remain confidential until publication.)
    back to top of document List of MMDB Search Fields 2009[PDDAT]

    will retrieve the structure records that were submitted to PDB in the year 2009.

    2009/01[PDDAT]

    will retrieve the structure records that were submitted to PDB in January 2009.

    2009/01/10[PDDAT] : 2009/01/25[PDDAT]

    will retrieve structure records that were submitted to PDB anytime between January 10, 2009 and January 25, 2009.

    (more about range searching...)
    PDB Description [PDSC]
    [PDES]
    A brief description of the PDB structure.

    back to top of document List of MMDB Search Fields  
    PDB File Count

    (Number of PDB records per structure)
    [PdbFileCount]
    [FC]
    [PDBCNT]
    The number of PDB records that have been combined to reconstitute the originally submitted structure.

    Most structures occupy a single PDB record.

    Very large structures have been split by PDB into multiple records, and the MMDB data processing procedures merge the PDB split files back into a single structure record.

    back to top of document List of MMDB Search Fields 2[FC] : 1000[FC]

    will retrieve all structures that have a PDB file count of 2 or more (in this search example, the upper limit was arbitrarily set at 1000).

    In other words, the search will retrieve all merged files from MMDB.
    PDB Source [PSRC]
    [PSOU]
    The source organism of each protein and/or nucleotide molecule, as noted in the original PDB data file.

    Note: During MMDB data processing, the source organism names in the PDB data file are compared against the organism names in the NCBI Taxonomy database. If there is a difference, the MMDB version of the data file will contain the organism name from the NCBI taxonomy database (based on the results of a BLAST search), and that name will be searchable in the Organism field. However, the source organism name noted in the original PDB file will still also be searchable via the PDBSource field.

    back to top of document List of MMDB Search Fields  
    Protein Name [PNAM]
    [PNAME]
    [ProteinName]
    The name of a protein molecule in a structure record, derived from the COMPND record of the PDB source file. This represents the term used by the author for the protein.

    (The documentation about PDB file format provides more information about the various "records" (data fields) that are present in PDB source files.)
    back to top of document List of MMDB Search Fields  
    Resolution [RES]
    [RESL]
    [RESO]
    The resolution (in Angstroms) of a protein structure resolved by diffraction or electron microscopy. This field can be queried for a single value or a range of values.

    back to top of document List of MMDB Search Fields 001.50 : 001.75[Resolution]

    will retrieve records that have a resolution between 1.50 to 1.75 Angstroms.

    As you can see by clicking on the Details folder tab after doing the search, each query above is translated to:

    001.50[Resolution] : 001.75[Resolution]

    (more about range searching...)

    RNA Name [RNAM]
    [RNAME]
    [RNAName]
    The name of an RNA molecule in a structure record. The names of nucleotide molecules, including DNA and RNA, are derived from the COMPND record of the PDB source file.

    (The documentation about PDB file format provides more information about the various "records" (data fields) that are present in PDB source files.)

    The RNA name often reflects the sequence of nucleotides in the molecule itself.
    back to top of document List of MMDB Search Fields  
    Title [Title]
    [TITL]
    The title of the publication(s) that reported the PDB structure findings. If more than one PubMed reference is associated with a structure record, the title of each article has been indexed.

    back to top of document List of MMDB Search Fields "p53 tumor suppressor"[TITL]

    will retrieve structure records with that phrase in the title.

    (Compare these search results with those obtained by the sample All Fields search, which will retrieve structure records containing that phrase anywhere in the record, and those obtained by the sample Citation Abstract Field search, which will retrieve structure records containing that phrase in the abstract of an associated PubMed record.)

    The quotes surrounding the search terms ensure they are searched as a phrase.**

    * In a query, the field name may be typed as the full name or abbreviation, and may be in upper, lower, or mixed case. If more than one abbreviation is shown, any one of them can be used. The field name must be surrounded by square brackets []. A space between the search term and the field specifier is optional. If desired, surround a phrase with quotes to force an adjacency search. For example, the sample queries below will work equally:
          "p53 tumor suppressor"[TI]
          "p53 tumor suppressor"[TITL]
          "p53 tumor suppressor" [TITL]
          "p53 tumor suppressor" [titl]
          "p53 tumor suppressor"[Title]

    ** The quotes surrounding the query terms in some of the sample searches force the terms to be searched as a phrase. If quotes are not used, the Entrez system may still recognize and handle the terms as a phrase, if they are present in a phrase dictionary used by the search engine. If the terms are not present in the phrase dictionary and are not surrounded by quotes, Entrez will insert a Boolean AND between the terms; in that case, they may or may not appear adjacent to each other in the retrieved records. The "Details" folder tab on a search results page will show you exactly how the Entrez system parsed your query. More search tips are provided in the PubMed help document and Entrez help document.

    It is also possible to search for a word stem by using an asterisk (*) as a wild card; for example, inhibit* will retrieve records with terms such as inhibit, inhibited, inhibition, inhibitor, etc. The Entrez Help document provides additional information about truncating search terms in this way.

    Link from other Entrez Database back to top

    The Entrez databases to which structure records have been linked (via the data processing pipeline) generally have reciprocal links from their records back to the corresponding Structure database records.

    Therefore, if you start your search in an Entrez database other than Structure, you can view the "Related Information" menu in the right hand margin of any record you have retrieved to see if it has links to associated information in the Structure database, as shown in the illustrated example below.
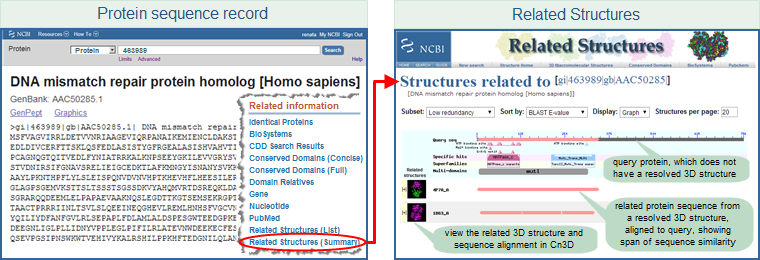
    Illustration showing how to link from protein sequence record to related structures, using protein sequence GI 463989 as an exmaple, human DNA mismatch repair protein homolog. Click on the image to open the live Related Structures search results page.

    Additional, more detailed illustrated examples show how to link from a gene record or protein sequence to "related structures", and from a PubChem record to "protein structures" that are bound to the chemical of interest.

    Alternatively, you can use the "Find Related Data" menu in the right hand margin of an Entrez search results page (in whatever database you have chosen to search) and select "Structure" to view the associated structure records for all items (default) displayed on the search results page or for those you have selected using their checkboxes.

    Additional note about links from Entrez Protein sequence records to structure records: 

    Protein sequence records can have a link to 3D structure record depending upon the data available for a particular protein sequence:
    • Structure - Protein sequence records that have a direct association with the structure record because at least one of the following is true: (a) the protein sequence record was derived directly from a 3D structure record (as described in MMDB data processing); (b) the accession number of the protein sequence record was listed in the DBREF record of the PDB source file; (c) the protein accession listed in the DBREF record of the PDB source file is also found in an Entrez Gene record, and that Gene record also has links to other protein accession(s); in such a case, all of the protein accessions in the Entrez Gene record will have "Structure" links (and will show a thumbnail image of a corresponding 3D structure in their protein sequence record display); or (d) the protein is identical in composition and sequence length to any of the proteins noted in (a), (b), or (c).

    As of February 2020, approximately 0.6% of the 800+ million sequence records in Entrez Protein have a direct "Structure" link, because they were derived from 3D structure records or have another type of direct association with a 3D structure. You can BLAST the protein sequence against the PDB (structure) database and adjust the algorithm parameters to decrease the stringency of the search, if desired.


    Search Results back to top

    | document summary page | display settings: format, items per page, sort by | send to | filter your results | refine your results | find related data |
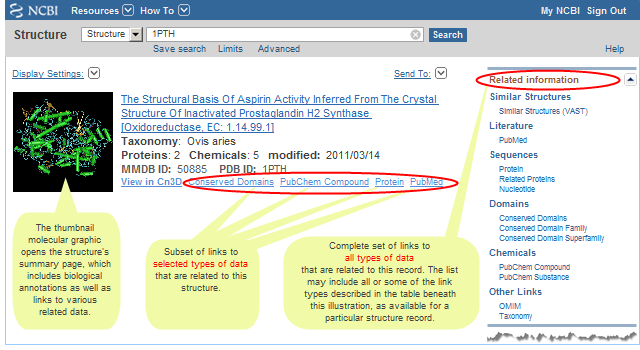
    Document Summary (DocSum) page back to top


    The initial search results provide a list (document summary, or "docsum") of the structure records that contain your search term, which can appear in any field of the record, unless a search field was specified in the query. If desired, you can narrow your search by restricting the query to a search field of interest or adding more terms with a Boolean AND. Alternatively, you can broaden your search by adding more terms (e.g., synonyms) to your query with a Boolean OR.

    Once you are satisfied with your search results, click on the thumbnail image, PDB Accession, or MMDB ID of any record on the DocSum page to view its structure summary page. In addition, the following options are available for viewing the search results:

     
    SAMPLE SEARCH RESULTS DISPLAY
     
    Image of sample structure search results page for prostaglanin H2 synthase, with the search terms in quotes to force a phrase search.  The READ MORE ABOUT column to the right of the image provides more details about the options on the search results page. Click on the image to open the live search results page in MMDB. Note that a larger number of items may be retrieved if new structures were deposited since this snapshot was taken.
     
     
    READ MORE ABOUT:


    Display settings back to top

    The "Display settings" menu on acts upon all of the structure records (default) in your search results, or on the subset you have selected with checkboxes. You can select items from multiple pages of the search results, if desired.

    Format
  • Summary -- a summary of all of the structure records (default) retrieved by your search, or for those you have selected with checkboxes, in HTML format.The information shown for each record may include the following, as available:
  • Summary (text) -- a summary of the records retrieved by your search, in plain text format. By default, all records from your search result are listed. If you are interested only in specific records, select their checkboxes, select the desired display settings, and press "Apply" to view only those records. The information shown for each record is the same as in the "Summary" format described above, but does not include the subset of links to additional information.


  • UI List -- a list of the unique identifiers (UI's) for all of the structure records (default) retrieved by your search, or for those you have selected with checkboxes.


  • Items per page
  • By default, 20 documents are listed per page. If desired, decrease (to a minimum of 5) or increase (to a maximum of 200) the number of documents displayed per page then press the "Apply" button.


  • Sort by
  • Search results are displayed in order of decreasing relevance with respect to the query. Many search fields have a score or rank associated with them; for example, the Title and Organism fields have a high rank, while the PdbComment field has a lower rank. The presence of a search term in any one or more of the fields is scored accordingly by the search system, and the total score given to a hit is used in determining its relevance to the query and therefore its placement on the search results page.


  • Additional options are available to sort records by descending or ascending order of PDB Accession, PDB Deposit Date, MMDB Entry Date, Protein Molecule Count, DNA Molecule Count, RNA Molecule Count, and Chemical Count.


  • Technical note: If you retrieve all records in the database by searching the Filter field for All[Filt], the records are simply displayed in descending order of UID (i.e., MMDB ID).


  • "Send To" menu back to top

    The "Send To" menu options act upon all the hits retrieved by your search (default), or those you have selected by using their checkboxes.

    File
  • Saves all the hits retrieved by your search into a plain text file, in either "Summary (text)" or "UI List" format.


  • Clipboard
  • Copies all the hits retrieved by your search (default), or those you have selected with check boxes, into a Clipboard, which temporarily stores up to 500 items (they will be lost after 8 hours of inactivity).

    Click on the "Clipboard: XX items" link in the upper right corner of the page to view the items in any format for up to 8 hours after your last activity in the database.

    The Clipboard will not add an item that is currently in the Clipboard; it will not create duplicate entries. You can remove items from the Clipboard, if desired.

    Entrez uses cookies to add your selections to the Clipboard. For you to use this feature, your Web browser must be set to accept cookies.

    Items in the Clipboard are represented by the search number #0, which may be used in Boolean search statements. For example, to limit the items you have collected in the Clipboard to those from human, use the following search: #0 AND human[organism]. This does not affect or replace the Clipboard contents.

    The Clipboard's "Send to" menu offers you the same "File" and "Collections" options as offered on the original search results page. The latter option saves all items (default), or the subset of items selected with check boxes, indefinitely in the My NCBI Collections section of your My NCBI account.


  • Collections
  • Saves all the hits retrieved by your search (default), or those you have selected by using their checkboxes, into the My NCBI Collections section of your My NCBI account.


  • Filter your results back to top

    The "Filter your results" area in the upper right corner of a search results page allows you to see all the records (default) retrieved by your search, or subsets of your search results that reflect commonly requested categories of records, and shows the corresponding number of records in each case.

    The "NMR" and "X-ray" folder tabs show the number of structures in your search results that were resolved by those experimental methods and enable you to view those subsets of your search results, if desired. The Refine your results box enables you to view other subsets from your search results.

    Refine your results back to top

    Illustration of a Refine Your Results box on an Entrez Structure search results page.  The items in the box allow you to view specific subsets of your search results that may be of interest. Click on the image to open the current, live search results for the p53 tumor suppressor search featured in this example. The "Refine Your Results" box that appears in the upper right corner of a search results page displays some aggregate information that characterizes your search results and allows you to view the corresponding subsets of the retrieved structure records, for example:

    • Protein Domain Families - subsets of 3D structures in your search results that contain protein molecules annotated with conserved domains, inferring protein function:


      • Families - 3D structures containing at least one protein molecule annotated with a specific hit to a conserved domain, suggesting a high confidence level for the inferred function of the protein. Subsets under this header list the top five conserved domains found as specific hits in the structures retrieved by your search. The number in parentheses represents the subset of structures from your search results that contain one or more protein molecules annotated with a specific hit to the listed domain; clicking on the number will retrieve that subset of structure records. The "All XX Families" link will open a list of all the conserved domain models (in the Conserved Domain Database) that had at least one specific hit to a protein component of any structure found by your search.


      • Superfamilies - 3D structures containing at least one protein molecule annotated with a any type of hit to a conserved domain, inferring that protein's function and therefore its membership in a superfamily. Subsets under this header show the top five conserved domain superfamilies found in the structures retrieved by your search. The number in parentheses represents the subset of structures from your search results that contain one or more protein molecules annotated with the listed superfamily; clicking on the number will retrieve that subset of structure records. The "All XX CDD Superfamilies" link will open a list of all the superfamilies (in the Conserved Domain Database) that were annotated on proteins components of the structures found by your search.


    • Complexes - subsets of 3D structures in your search results that contain specific combinations of molecular components:


      • Protein-Protein - 3D structures that contain at least two protein molecules.
      • Protein-DNA - 3D structures that contain at least one protein molecule and one DNA molecule.
      • Protein-RNA - 3D structures that contain at least one protein molecule and one RNA molecule.
      • Protein-Chemical - 3D structures that contain at least one protein molecule and one chemical.


    • Literature - subsets of 3D structures in your search results that contain links to published literature:


      • PubMed - 3D structures that contain links to bibliographic information (article title, authors, abstract, journal name, etc.) in the PubMed database, for publications that describe the structures.
      • PMC - 3D structures that contain links to full text articles that describe the structures in the PubMed Central (PMC) free digital archive of biomedical and life sciences journal literature.


    • Taxonomy - 3D structures that contain at least one molecular component (protein or nucleotide sequence) from the various organisms that were found in the search results.


      • Subsets under this header show the five organisms most frequently found in the structures retrieved by your search. The number in parentheses represents the subset of structures from your search results that contain one or more protein molecules from the listed organism; clicking on the number will retrieve that subset of structure records. The "All XX Organisms" link shows the total number of different organisms found in the search results and opens that list of organisms in the NCBI Taxonomy database.

    Find related data back to top

    Illustration of links to related data, which retrieve associated records from other Entrez databases, including as literature, protein and nucleotide sequences, bound chemicals, and more. As noted in the page on discovering associations among previously disparate data, the Entrez retrieval system is designed to provide integrated access to previously disparate data and make it possible to collect related information on a topic of interest within and across Entrez databases.

    As part of Entrez, the Structure database implements a data processing pipeline to identify such associations and present them as link options on search results pages.

    The "Related information" box that appears in the right margin of the display for an individual record allows you to retrieve related data for that particular structure. For example, if you select "Conserved Domains" when you are viewing the record for accession 1PTH, you will retrieve the domain models from the Conserved Domain Database that have been annotated on the protein molecules in that structure. Many of the links are also available on a structure's summary page.

    A "Find Related Data" box (instead of an "Related information" box) will appear in the right margin of an Entrez Structure search results page if you retrieved two or more records. The "Find Related Data" box allows you to retrieve related data for all the records retrieved by your search (default), or for the records you have selected with checkboxes.

    The links in either display can include Similar Structures, Literature, Sequences, Domains, Chemicals, and Other Links, depending on the related data that are available for the structures you have retrieved. (Note that the Similar Structures link appears only on displays of individual records.)


    Link Group Link Name Description
    Similar Structures Similar Structures back to top Other structures in MMDB that are similar in 3D shape to the selected structure, as determined by the original VAST (Vector Alignment Search Tool), and by VAST+, during data processing. (The similar structures are sometimes referred to as VAST or VAST+ "neighbors".)

    VAST identifies similar protein 3-dimensional structures by purely geometric criteria, in order to identify distant homologs that cannot be recognized by sequence comparison. The region of similarity can span the entire length of a protein molecule, or a portion of it. If a structure contains more than one protein molecule, similar structures are shown for each one.

    VAST+, an expanded version of the program, has also been applied to each structure in MMDB in order to find macromolecular structures that have similarly shaped biological units, also referred to as "biounits".

    By default, VAST+ search results are shown for a structure, if/as available. If you prefer to see the original style VAST results, which focus on similarities between individual protein molecules or 3D domains (compact substructures)) within the query structure and hits, follow the link for "original VAST" near the upper right corner of the VAST+ search results page.

    The VAST+ help document provides details about the differences between VAST and VAST+, an illustrated example of VAST+ results, and an illustrated example of original VAST results.

    Additional notes:

    The "Similar Structures" link appears for individual records, as available. Some structure records do not have any VAST neighbors (read more).

    The "Find related data:Structure" menu in the right margin of an MMDB search results page also enables you to retrieve similar structures. By default, that menu acts upon all of the items in your search results (i.e., it will retrieve the full set of structures that are are 3D-similar to any/all of the structures listed on your search results page). If you want to retrieve similar structures for only one record, or a subset of records from your search results, then activate the check boxes of the structures of interest before selecting "Find related data: Structure."

    "Similar Structures" are also accessible from the structure summary page, either by clicking on the "Similar Structures: VAST+" link near the upper right corner of the page, or by clicking on the colored bar that represents a protein molecule or 3D domain in the "show annotation" graphic provided for each protein in the table of molecular components.
    Literature PubMed Central Full Text back to top Full text of cited references, if available in the PubMed Central digital archive of biomedical and life sciences journal literature.
    PubMed Citations PubMed records for the reference(s) cited in the structure record.
    Sequences Nucleotide back to top Nucleotide sequences that comprise the 3D structure (see molecular components). As noted in the data processing section of this document, DNA or RNA sequence data present in 3D structure records are deposited into the Entrez Nucleotide database, and the "Nucleotide" link will retrieve those sequence records.
    Protein back to top Protein sequence records that are directly associated with the structure record because at least one of the following is true:

    (a) the protein sequence record was created from a 3D structure record (as described in the section on MMDB data processing)
    or
    (b) the accession number of the protein sequence record was listed in the "DBREF" record of the PDB source file. (The documentation about PDB file format provides more information about the various "records" (data fields) that are present in PDB source files.)
    or
    (c) the protein accession found in the "DBREF" record of the PDB source file is also lists in an Entrez Gene record, and that Gene record also lists other protein accession(s); in such a case, the structure record will link to all of the protein accessions listed in the Entrez Gene record. (Those proteins will have reciprocal links back to the struture record, and will show a thumbnail image of a corresponding 3D structure in their protein sequence record display)
    or
    (d) the protein is identical in composition, sequence length, and source organism to any of the proteins noted in (b) or (c).
    Genes back to top Gene records that correspond to the structure's protein components.

    The association between the structure record and a gene record is made in the following way:

    • When a 3D structure includes one or more protein molecules, it also includes sequence data for each protein molecule.
    • In addition to that sequence data, the structure record may also include a cross-reference other protein sequences (often Swiss-Prot) by listing their accession number in the "DBREF" record of the PDB source file. (The documentation about PDB file format provides more information about the various "records" (data fields) that are present in PDB source files.)
    • If the protein accession from the "DBREF" record is also listed in an Entrez Gene record, a link is created between the structure record and the Gene record.
    Domains Conserved Domain Family back to top Conserved domains that are specific hits to the protein sequences that comprise the 3D structure (see molecular components).
    Conserved Domain Superfamily back to top Conserved domain superfamilies which include the domain models that were specific hits to the protein sequences in the 3D structure.
    Conserved Domains back to top The set of conserved domain models that get specific hits or non-specific hits to the protein sequences in the 3D structure.
    Chemicals PubChem Compound back to top PubChem Compound records for bound chemicals present in the 3D structure record (see molecular components).
    PubChem Substance back to top PubChem Substance records for bound chemicals present in the 3D structure record (see molecular components).
    Other Links BioAssay back to top If the protein in the structure record is the target of a bioassay, or involved in the biological process described in the bioassay experiment, a link between the structure record and the PubChem BioAssay record is established (if the submitter of the bioassay data provided the link to the structure record's protein).
    BioSystem back to top Biosystems that include protein sequences identical to any one of the protein molecules in a structure.

    For example, if a biosystem record lists a specific protein sequence record identification number (GI number) as a biosystem component, the biosystem data processing procedure will find all other sequences in the Entrez Protein database that are identical in composition and length. Such a group of identical proteins is called an "Identical Protein Group (IPG)." If one of those proteins is from a 3D structure record, a link will be established between that structure record and the biosystem.

    (The BioSystems Database help document provides additional information about identical protein groups.)
    OMIM back to top Records from the Online Mendelian Inheritance in Man (OMIM) database that cite one or more of the PubMed records associated with a structure. For example, if an OMIM record cites a particular PubMed ID in its reference list, and that article is one of the cited references in a structure record, a link will be established from the structure to the OMIM record.
    Taxonomy back to top This link retrieves the NCBI Taxonomy database record for the source organism(s) of the protein and/or nucleotide molecules in the structure record. If a structure record contains protein or nucleotide sequences from more than one organism (e.g., human and HIV1), each source organism is listed and links to the corresponding taxonomic information in the NCBI Taxonomy database, including the organism's Taxonomy ID (TaxID) and lineage.


    View details for an individual structure record back to top

    Regardless of the format in which you have chosen to display your search results, simply click on the thumbnail image or title for a record of interest to view its structure summary page.


    Structure summary page:  What information is displayed for each structure? back to top

     
    SAMPLE MMDB STRUCTURE SUMMARY PAGE for PDB ID 1PTH   (open live page)
     
    Annotated image of sample structure summary page, for sheep prostaglandin H2 synthase (MMDB ID 50885, PDB ID 1PTH). The READ MORE ABOUT column to the right of the image provides more details about each feature. Click on the image to open the live structure summary page in MMDB.


    READ MORE ABOUT:
     

    Search box & button back to top

    The "Search" box and button in the upper right hand corner of a structure summary page allow you to retrieve a 3D structure record directly from the backend database by entering its unique identifier (UID), in the form of a PDB accession or an MMDB ID. If you would like to search for structures using other methods, such as text term search, protein sequence query, or the 3D coordinates of a resolved structure, you can access those options from the MMDB search methods page.

    Structure Record Identifiers back to top

    PDB ID:  The accession of number of the Protein Data Bank (PDB) record from which the MMDB record was derived. It is generally an alphanumeric combination (e.g., 1PTH, which served as the source record for MMDB ID 50885). The PDB ID on the structure summary page links to the source record on the PDB web site. If two or more PDB IDs are listed on a structure summary page, that indicates the MMDB record has been merged from PDB split files. By merging the files, MMDB enables you to view and/or save the complete structure, as shown in the illustrated example of the ribosome.
    The "Download" button beside the PDB ID downloads the original PDB source file from which the MMDB record was derived. That file contains data for the asymmetric unit of the structure.

    Note that the "Download Structure Data" section of a structure summary page also provides a "PDB" option in the "Format" pulldown menu. That option does not save a copy of the PDB source file, but instead saves copy of the structure record, in PDB file format, after it has undergone MMDB data processing.

    The differences are explained in a separate section of this document on "additional details about structure data download options > PDB format > details about the data that are saved."

    MMDB ID:  The unique identifier of the structure record in the Molecular Modeling Database (MMDB). It is a string of digits (e.g., 50885 for sheep prostaglandin H2 synthase) that are assigned consecutively to each structure record processed by NCBI. (This is also referred to as the structure's unique identifier, or UID.)
    Note: The MMDB data processing pipeline will assign a new MMDB ID number to a structure if the 3D coordinates and/or sequence data in the corresponding PDB source file have changed as a result of updates to the structure record. (The PDB ID will remain the same, however.)

    For example, if the atoms in a previously available PDB data file were re-ordered during a PDB remediation the PDB accession will remain the same but it will receive a new MMDB ID and a new MMDBEntryDate.

    Descriptive Information back to top

    Title:  The title of the structure record, derived from the TITLE field of the PDB source file. It may or may not be the same as the title of the citation.

    Citation:  The primary journal article that describes the structure. The article title opens the corresponding PubMed record. If additional references about the structure are available, an "All References" link will be present and will retrieve the primary as well as additional references from PubMed. Reference information will be absent from summary pages of structures that do not have any corresponding publications.

    PDB Deposition Date:  The date on which the record was deposited into the Protein Data Bank. It is extracted from the HEADER record of the PDB source file and is searchable in the PDBDepositDate field of MMDB. Note that this is not necessarily the date on which the record became publicly available, and may be significantly different from the release date if submitters requested their data remain confidential until publication.

    Updated in MMDB:  The date on which the record was last modified. This may reflect the date on which a new version of the PDB source record was imported into MMDB, or the date on which changes were made to MMDB's version of the record as a result of enhancements to NCBI data processing procedures, and is searchable in the MMDBModifyDate field of MMDB.
    Note: You can use the MMDBModifyDate search field of MMDB to retrieve records that were modified on a given date or between a range of dates.
    If no modifications were made since the record was deposited into MMDB, then MMDBModifyDate will be the same as the MMDBEntryDate.
    If PDB undergoes a database remediation, in which most or all PDB records are updated in some way, many or all records will share the same update date. (more...)
    If the 3D coordinates and/or sequence data in a PDB source file change as a result of updates to the structure record, the MMDB data processing pipeline will assign a new MMDB ID number to that record, although the PDB ID remains the same.
    Source Organism:  The source organism(s) of the protein and/or nucleotide molecules in the structure record. If a structure record contains protein or nucleotide sequences from more than one organism (e.g., human AND HIV1), each source organism is listed and links to the corresponding taxonomic information in the NCBI Taxonomy database, including the organism's Taxonomy ID (TaxID) and lineage.

    Resolution:  The resolution of the structure in Angstroms (Å), extracted from the REMARK 2 record of the PDB source file. The PDB website provides additional information about resolution.

    Experimental Method:  The experimental method that was used to resolve the structure, extracted from the "EXPDTA" record of the PDB source file.

    Similar Structures: VAST+:  The "Similar Structures: VAST+" link near the upper right hand corner of a structure summary page allows you to retrieve the structures that are similar in 3D shape to the one currently being viewed.
    The similar structures were found by the Vector Alignment Search Tool (VAST), which identifies structures that are similar in 3D shape, using purely geometric criteria, regardless of their degree of sequence similarity. In this way, VAST can identify distant homologs that cannot be recognized by sequence comparison.

    The default "Similar Structures" display shows the VAST+ search results page, which lists the query structure followed by similar structures, ranked by their degree of similarity to the query structure's macromolecular complex (biological unit). It firsts lists Solid red circle icon that appears beside similar structures that have a complete match to the biological unit of the query protein structure. complete matches to the query structure's biological unit, followed by Half filled red circle icon that appears beside similar structures that have a partial match to the biological unit of the query protein structure.partial matches, and ending with matches to individual protein molecules. (Illustrated examples of VAST+ results.)

    If you prefer to see the Original VAST results, which focus on similarities between individual protein molecules, or individual 3D domains (compact substructures) rather than macromolecular complexes, follow the link for "original VAST" near the upper right corner of the VAST+ search results page. The Original VAST display page lists each protein molecule and 3D domain in the asymmetric unit of the query structure, and links to structures that are similar in shape to the protein molecule or 3D domain you select. (Illustrated example of original VAST results.)

    Alternatively, Original VAST similar structures can be retrieved from the structure summary page by scrolling down to the table of molecules and interactions, viewing the the "show annotation" graphic for a protein of interest, and then clicking on the bar graphic for the overall protein molecule or for any 3D domain it contains in order to view a list of structures that are similar in shape to the molecule or 3D domain you selected.

    The data processing: geometrical features section of this document provides more information about how similar structures are identified. The VAST+ help document provides details about the differences between VAST and VAST+. Additional details about VAST and VAST+ are provided in the articles listed on the VAST publications page.

    (Note: if you have a new structure that is not yet publicly available in MMDB, you can use the VAST Search page to input the coordinates of that newly resolved structure in PDB file format, and compare it against all structures in MMDB to find its neighbors.)


    Display Options back to top

    The MMDB data processing pipeline applies several procedures to identify the biochemically active forms of a biomolecule ("biological units") present within a structure record that has been resolved by x-ray crystallography or neutron diffraction of a crystal. The display options on an MMDB summary page provide several views of the data in such records:

    Default Biological Unit:  This option is selected by default and displays the first author-determined biological unit that is listed in the PDB source file. If a PDB source file lists only software-determined biounits, then the first one listed is displayed as the default biounit. Additional information about the identification of biological units is provided in the data processing section of this document.

    All Biological Units:  If two or more biological units were found in the structure record, this option will display all biological units that were found in the structure record, whether they are similar or distinct, and whether they were author-determined or software-determined.

    Asymmetric Unit:  This option displays the data that were provided by the submitter of the record. These data are often casually referred to as the asymmetric unit and can represent either: (a) the complete biological unit; (b) a portion of the biological unit; or (c) multiple copies of the biological unit, as shown in the illustrated example of three different human hemoglobin structure records. (Note: "Asymmetric unit" is the only display option for merged PDB split files from crystallographic studies.)

    When you use the options to "Download Structure Data," they will act upon the biological unit(s) or asymmetric unit currently displayed in the browser window. For example, if you are viewing the default biological unit and choose to display the 3D structure, only that biological unit will be shown in the 3D structure viewer, regardless of how many copies of the biological unit exist in the raw data that were deposited by the submitter. To see the raw data, change the display to "asymmetric unit" before selecting the desired "View or Save 3D Structure" options.

    Note: The asymmetric unit is equivalent to the biological unit in approximately 60% of structure records resolved by x-ray crystallography or neutron diffraction of crystals. In such cases, all three of the above displays will be the same (i.e., default biological unit = all biological units = asymmetric unit). In the remaining 40% of the records, the asymmetric unit represents a portion of the biological unit that can be reconstructed using crystallographic symmetry, or it represents multiple copies of the biological unit. In those cases, the biological unit displays will be different from the asymmetric unit display.

    If you are viewing a structure resolved by an experimental method other than x-ray crystallography or neutron diffraction of a crystal, the above display options will not be present, as the concepts of asymmetric unit and biological unit do not apply to structures resolved by other methods.

    Finally, the "biological unit" display option is not available for merged PDB split files from crystallographic studies, because the biological unit of the complete structure is not specified in a computer readable way in the PDB source files. The structure summary page for a merged crystallographic structure therefore simply uses the label of "asymmetric unit" above the molecular graphic, as it represents the unification of raw data from the original PDB files. The asymmetric unit can represent the structure's complete biological unit, a portion of the biological unit, or multiple copies of the biological unit. In the case of structures resolved by electron microscopy (EM) or nuclear magnetic resonance (NMR), the term "asymmetric unit" does not apply, and the term "biological unit" is shown instead on the summary page for a merged structure from either of those technologies. Please refer to the corresponding publication for a structure, if/as available, for the author's description of its biologically active form. In such cases, please refer to the corresponding publication, if/as available, for the author's description of the structure's biologically active form.

    Biological Unit N back to top

    For each biological unit displayed, the MMDB summary page:
    1. provides a type classification based on a comparison of the biological units identified in the structure record, if the record contains multiple biological units. If two or more biological units meet a threshold for sequence and structural similarity, they will receive the same type code; if they do not meet that threshold, they are considered distinct from each other and received different type codes.
    2. indicates the oligomeric state (dimer, trimer, tetramer, etc.) and the method by which it was determined
    3. presents a schematic diagram of interactions, a molecular graphic, options to download the structure data, and a table of molecular components.
    If the asymmetric unit is displayed, only a molecular graphic and table of molecular components will be shown (no interaction schematic).


    Structure Images back to top

    By default, the MMDB summary page displays a concise list of the biological unit(s) that were identified in the structure, showing both a molecular graphic and an interactions schematic for each distinct biological unit. If you choose to view the asymmetric unit, the page will display only a molecular graphic (no interaction schematic) along with a note indicating the relationship between the asymmetric unit and the biological unit(s).
     
    Molecular Graphic

    Sample thumbnail molecular graphic for 1PTH, prostaglandin H2 synthase-1 from sheep. A static image is shown by default. Click the 3D view button or the full-featured 3D viewer button near the bottom of a static molecular graphic to load an interactive view.
    back to top of document The molecular graphic shows a snapshot of the 3D structure that can be viewed either as a static image, or as an interactive display, as described below:
    • STATIC IMAGE: Upon first opening a structure summary page, the molecular graphic shows a static image of the 3D structure. The static image generally shows the default biological unit of the structure.

      • Click the 3D view button in the lower left corner of the static image to load an interactive view that uses iCn3D ("I see in 3D"), NCBI's web-based 3D structure viewer.
      • The interactive display will load only if your web browser supports WebGL. If it doesn't, the static image will be shown instead. To see the interactive view, modify the settings in your web browser to enable WebGL, or, if needed, update your web browser to a newer version that supports WebGL. (See the WebGL site for more information about compatibility with various web browsers.)
      • The actions that happen when you mouseover or click on a node of the corresponding interactions schematic (described below) depend upon whether the MMDB summary page is displaying the the static or interactive version of the molecular graphic.

    • INTERACTIVE DISPLAY: Once the interactive view loads, you can:

      • Click on the structure to stop the spin.
      • Click an icon in the corresponding interactions schematic to highlight molecule in both the schematic and the molecular graphic.
      • Right click on the structure to open a menu that allows you to control various aspects of the display (background color, display solvent accessible surface) and/or to "export image."
      • If you select "Export Image" from the menu, the molecular graphic will open in a separate window. In that separate window, you can right click on the exported image to use the browser's "save image as" function.
      • Reload the MMDB summary page to refresh the page and to reveal the "3D view" button again. Then repeat the steps above as many times as desired in order to save snapshots of the structure at the desired angles.
      • Each time you select "Export Image," a new, separate window will open, making it possible to view the structure from many angles simultaneously.

    • LAUNCH FULL iCn3D: Click the full-featured 3D viewer button to launch the advanced (full feature) version of iCn3D in another window.

      • The full feature version provides many additional controls for rendering, labeling, coloring, and saving the structure, as well as viewing corresponding sequence data.

      • Note that iCn3D will launch only if your web browser supports WebGL. If it doesn't, modify the settings in your web browser to enable WebGL, or, if needed, update your web browser to a newer version that supports WebGL. (See the WebGL site for more information about compatibility with various web browsers.)
    Additional structure viewing options: The "Download Structure Data" dialog box (that appears to the right of the molecular graphic on the structure summary page) provides options for downloading the structure data in a variety of file formats. The ASN.1 format, for example, can be interactively viewed in Cn3D, NCBI's free 3D structure viewing application, which provides a wide range of options for rendering, labeling, coloring, annotating, viewing sequence data, and more. Installation takes only a couple of minutes and a tutorial describes the program's features and functions.

    Additional options for saving images of 3D structures are also available, and are described in a separate section of this document.


    Interactions Schematic

    Sample interactions schematic for sheep prostaglandin H2 sythase, from the 1PTH structure record.
    back to top of documentThe interactions schematic shows the molecular components of the biological unit and the interactions among them. (Note: Structures that only have alpha carbons, and no side chains, do not show interactions. In those cases, the schematic just shows the structure's molecular components (proteins, nucleotide sequences, and ligands) as free floating (disconnected) icons.)

    The schematic is clickable, and the actions that happen when you mouseover or click on a node (described below) depend upon whether the MMDB summary page is displaying the the static or interactive version of the molecular graphic.
    • The molecular components of the biological unit can include the following:

      Proteins, if present, are shown as circles: example of circle icons used to depict proteins  etc.  
      Nucleotide sequences (DNA, RNA), if present, are shown as squares: example of square icons used to depict nucleotide sequences  etc.  
      Chemicals, if present, are shown as diamonds: example of diamond shaped icons used to depict chemicals etc.  
      Non-standard biopolymers, if present, are shown as parallelograms:
      (These are molecules such as nucleotide or protein sequences that contain a large percentage of non-standard residues.)
      example of parallelogram icons used to depict non-standard biopolymers  etc.  
      If any protein or nucleotide molecules in the structure were generated by applying transformations from crystallographic symmetry, their labels are shown as alphanumeric combinations (for example, Example of circle icons with alphanumeric labels used to depict protein molecules generated by applying transformations from crystallographic symmetry. or Example of square icons with alphanumeric labels used to depict nucleotide sequences generated by applying transformations from crystallographic symmetry.), indicating the source molecule from which they were generated (to the left of the underscore bar) and the copy number (to the right of the underscore bar). Chemicals that interact only with such molecules were also generated by applying transformations from crystallographic symmetry; their icon labels also include an underscore bar, with a number on either side of the underscore bar to indicate the source chemical and the copy number, respectively.

      The protein and nucleotide icons are scaled to show the relative sizes of those molecular components, so they are roughly comparable to each other based on molecular weight. All chemical icons are the same size.

    • Interactions among components are shown as lines, and an interaction is displayed only if there are at least 5 contacts at a distance of 4 Å or less between the heavy atoms of the molecules.

      • There is no meaning to the length of the lines in the interaction schematic. After the interactions are drawn, the diagram is flattened out to fit into the square, lengthening or shortening lines as needed.

      • Because of the latter thresholds, ions that are part of the biological unit may be missing from the interaction diagram, but they will be listed in the table of molecular components and interactions. Interactions for short peptides, or for molecule types other than protein, DNA/RNA, and chemical, are not calculated. Molecules, such as crystallization agents, etc., that are not part of the biologically active molecule are absent from both the interaction schematic and the molecular components list.

    • If the structure contains multiple biological units and you choose to display "all biological units," then the MMDB summary page for the structure will show a schematic cartoon (and corresponding molecular graphic) for each one.
    The actions taken by the interactions schematic when you click on a node depend on whether the static or interactive version of the molecular graphic is displayed on the page..
    • If the static molecular graphic is displayed:

      • Mouse over any node in the interactions schematic to view the molecule name.

      • Double click on a node in the interaction schematic to jump down to the corresponding part of the Molecules and Interactions table, which provides additional information about the molecule.

    • If the interactive molecular graphic is displayed:

      • Each node in the interaction schematic works as a toggle switch to highlight a molecule on/off.

      • Double click on a node in the schematic to highlight just that molecule in the 3D structure.

      • Double click on that molecule again in the interaction schematic to un-highlight the molecule and revert to the previous view of the 3D structure.

      • To highlight all molecules of the same type, click on the term "protein," "nucleotide," or "chemical" that appears at the bottom of the interactions schematic. (Click on the term again to toggle the highlight off, if desired.)
     

    Download Structure Data (save 3D structure record) back to top

    Format The "Format" options that you select in the "Download Structure Data" box of an MMDB summary page will act upon the biological unit(s) or asymmetric unit currently displayed in your browser window. back to top  
     
     
  • ASN.1 (Cn3D)
  • Renders the structure data in ASN.1 file format, which can be used to display the 3D structure in NCBI's free Cn3D structure-viewing program. Cn3D allows examination of biological units, asymmetric units, and sequence-structure relationships, and allows superposition of geometrically similar structures.

    The data will either be for an individual biological unit or for the asymmetric unit, depending on what you chose to display on the MMDB summary page when you pressed the "download" button.

    The structure can be opened automatically in Cn3D, if Cn3D has been installed on your computer, and if your browser has been configured to use it as a helper app.

    Cn3D is available for Windows, Macintosh, and Unix platforms. Installation takes only a couple of minutes and a tutorial describes the program's features and functions.


  • PDB
  • Renders the structure data in PDB file format, which can be used to display the 3D structure with Rasmol or other viewers that can read that format.

    The data will either be for an individual biological unit or for the asymmetric unit, depending on what you chose to display on the MMDB summary page when you pressed the "download" button.

    Note, however, that the saved file may be somewhat different from the original PDB source file, due to content validation procedures applied during MMDB data processing. The differences are explained in a separate section of this document on "additional details about structure data download options > PDB format > details about the data that are saved."

    To save the original PDB source file, click on the "Download" button that appears next to the PDB ID in the upper right hand corner of the structure summary page."


  • XML
  • Renders the data in XML file format. The data will either be for an individual biological unit or for the asymmetric unit, depending on what you chose to display on the MMDB summary page when you pressed the "download" button.  
     
     
  • JSON
  • Renders the data in JSON file format. The data will either be for an individual biological unit or for the asymmetric unit, depending on what you chose to display on the MMDB summary page when you pressed the "download" button.  
     
     
  • PNG (image)
  • Saves the default view of the structure in PNG file format.

    The image saved will either be for an individual biological unit or for the asymmetric unit, depending on what you chose to display on the MMDB summary page when you pressed the "download" button.

    Separate sections of this document provide an additional details about structure data downloads and additional options for saving images of 3D structures.
     
     
    Data Set The "Data Set" options that you select in the "Download Structure Data" box of an MMDB summary page will act upon the biological unit(s) or asymmetric unit currently displayed in your browser window, and allow you to download the data file in varying levels of detail (complexity). back to top  
     
     
  • Single 3D Structure
  • Displays the detailed model, showing the coordinates of each atom in the structure. This option, which is the default, transmits a large amount of structure data and it may therefore take some time to load the structures.  
     
     
  • All 3D Structures
  • This option is available only when the Cn3D file format is selected. It displays all members of NMR ensembles or correlated disorder sets from crystallography. You can also see movie-like animations of multiple models with Cn3D.  
     
     
  • Alpha Carbons
  • Displays only alpha-carbon (protein) or phosphate (DNA) coordinates for simple representation of protein or nucleic acid backbones, respectively. This option transmits only a subset of the data points from a structure record and therefore loads relatively quickly. This option is selected by default for structures with >25,000 atoms. If you are viewing the structure summary page for an NMR ensemble or a correlated disorder set from crystallography, this option will download backbone data only for the first model in the set.  
     
     
  • PDB source file
  • The "Download" button beside the PDB ID (in the upper right corner of a structure summary page) downloads the original PDB source file from which the MMDB record was derived. That file contains data for the asymmetric unit of the structure.

    Note that the "Download Structure Data" section of a structure summary page also provides a "PDB" option in the "Format" pulldown menu. That option does not save a copy of the PDB source file, but instead saves copy of the structure record, in PDB file format, after it has undergone MMDB data processing. The differences are explained in a separate section of this document on "additional details about structure data download options > PDB format > details about the data that are saved."
     
    Additional details about structure data download options back to top  
    annotated illustration of download options |
    details about data saved in each file format: ASN.1 (Cn3D), PDB, XML and JSON, PNG (image) |
    save image of 3D structure | save structure components
     
    Annotated illustration of download options back to top

    Illustration showing how to save a structure record in ASN.1 format or PDB format by selecting the desired options from the Program, Tasks, and Complexity menus in the See in 3D/Save box on a structure summary page.
     
    Details about the data that are saved in each of the following file formats: ASN.1 (Cn3D), PDB, XML and JSON back to top

      ASN.1 Format:  To save the structure's data file in ASN.1 format, an International Standards Organization (ISO) data format that is viewable in the free Cn3D program, select the following combination of options (on the web interface, or through the Web API):

    Details about the data that are saved:
    (1) For X-ray crystallography or neutron diffraction of crystal structures: (a) If you have chosen to display the "first biological unit" or "all biological units" on the structure summary page, the "Download" operation will save the data for the specific biological unit displayed in the molecular graphic. The saved file will include sequence and spatial coordinate data that were present in the original PDB source file as well as data that were generated at NCBI by applying transformations from crystallographic symmetry, if applicable to that biological unit. (b) If you have selected the "asymmetric unit" display option, the "Download" operation will save the data that were present in the PDB source file, whether those data represented all, part, or multiple copies of a biological unit. The saved file will not include any data generated at NCBI by applying transformations from crystallographic symmetry.
    (2) For structures resolved by experimental methods other than X-ray crystallography or neutron diffraction of crystal structures, the "Download" operation will save the data that were provided by the author in the PDB source file. The concepts of asymmetric unit, biological units, and crystallographic symmetry do not apply to these structures.
    Note for both (1) and (2) above: The saved file may also include some modifications (relative to the original PDB source file) that occurred as a standard part of MMDB data processing. Some examples are provided below in the notes about PDB format.


      PDB Format:  To save the structure's data file in PDB format, which is viewable in Rasmol or other programs that accept PDB format, select the following combination of options (on the web interface, or through the Web API):

    Details about the data that are saved: The PDB-formatted file that is downloaded when you select "Format: PDB" (in the "Download Structure Data" section of a structure summary page) has undergone content validation that is a standard part of data processing. Its content may therefore be somewhat different from that of the original PDB record. For example, some PDB records may have discontinous residue numbers, which exist in a free text field. MMDB assigns a consecutive series of positive integers to residues in biopolymers, using a numerical data field. In addition, MMDB resolves some discrepancies that might exist between the SEQRES records and the atomic coordinates. For example, if the structure's atomic coordinates reveal the presence of amino acids or nucleotides that are not listed in the SEQRES records of an original PDB file, MMDB will derive the biopolymer sequence from the atomic coordinates and not from the original SEQRES records. The derived biopolymer sequence will then appear in the MMDB record, and in the SEQRES records of the PDB-formatted file saved from the MMDB database. As a third example, the spans of secondary structures annotated on proteins might vary between PDB and MMDB records, as NCBI algorithmically identifies alpha helices and beta strands using purely geometric criteria and annotates the proteins using that information rather than the spans indicated in the original PDB file. Therefore, the content of a PDB-formatted record you save from an MMDB structure summary page may be different from the content of the original PDB file.

    To save an exact copy of the original PDB source file, click on the "Download" button that appears next to the PDB ID in the upper right hand corner of a structure summary page.


      XML and JSON Formats:  To save the structure's data file in XML or JSON formats, select the following combination of options (on the web interface, or through the Web API):

    Details about the data that are saved:
    The "Download Structure Data" function on an MMDB summary page will act upon the biological unit(s) or asymmetric unit currently displayed in your browser window, and allow you to download the data file in varying levels of detail (also referred to as varying levels of complexity, or data sets). It is also possible to save the data by using the Web API.


    Save image of 3D structure back to top  

    It is possible to save an image of the 3D structure in a number of ways, with varying degrees of customization possible:

    • To save the default image of a 3D structure:


    • To customize the viewing angle and/or background color, apply termini labels, or view solvent accessible surface, and then save the resulting snapshot:

      • Open the MMDB summary page page for the desired structure and view its molecular graphic, which by default shows a static image.
      • Click the "3D view" button in the lower left corner of the static image to load an interactive view of the structure. (The interactive view uses a simple version of iCn3D, NCBI's web-based 3D structure viewer, and requires a web browser that supports WebGL.)
      • Once the structure spins to the desired position, click on the structure to stop the spin
      • Right click to open a menu that allows you to control various aspects of the display and/or to "export image."
      • Select "Export Image" to open the view in a separate window.
      • Right click on the exported image to use the browser's "save image as" function.
      • Reload the page to reveal the "3D view" button again, then repeat the process as many times as desired in order to save snapshots of the structure at the desired angles.
      • Each time you select "Export Image," a separate window will open, making it possible to view the structure from many angles simultaneously.

    • To customize rendering style of the structure, highlight selected regions of the structure and/or corresponding sequence data, add labels, etc., and then save the state of the structure so you can reload it in the full-featured version of iCn3D in the future:

      • Open the MMDB summary page page for the desired structure and view its molecular graphic, which by default shows a static image.
      • Click the "3D view" button in the lower left corner of the static image to load an interactive view of the structure. (The interactive view uses a simple version of iCn3D, NCBI's web-based 3D structure viewer, and requires a web browser that supports WebGL.)
      • Then click the "full-featured 3D viewer" button button that launches full featured iCn3D in another window to launch the full version of iCn3D in another window.
      • Use the various menu options to render the structure with the desired style, color, labels, viewing angle, etc.
      • Select the File/Save Files/State File to save the state of the structure in a file. (The file will be named "NXXX_statefile" by default, unless you select the "Save As" option in your browser, and file will be in *.txt format. The NXXX in the default filename represents the PDB ID of the structure.) You can then later open the statefile through the iCn3D "File/Open State" menu option.
      • Alternatively, you can select the File/Save Files/iCn3D PNG Image to save both the customized 3D image (as a *.png file) and the state of the structure (as an *.html file).
        • Specifically, the "File/Save Files/iCn3D PNG Image" option saves two files with a single action. The first file will be named NXXX_xxxxxxxxxxxxxxxxx.png, and the second will be named NXXX_xxxxxxxxxxxxxxxxx.html, where NXXX in the default filename represents the PDB ID of the structure and xxxxxxxxxxxxxxxxx is a hash tag that represents the customizations you made to the view. (Example filenames are: "1TUP-pgmMZ96uF2YhEsNc6.png" and "1TUP-pgmMZ96uF2YhEsNc6.html").
        • Additionally, the *.png file includes a "share URL" at the bottom. If a user opens that file in iCn3D, they will be able to see the structure in the same state in which they saved it, and it will be a live structure, so they can continue to view it interactively in iCn3D.

    • To render and save images using the wide range of controls that are available in NCBI's free standalone Cn3D structure-viewing program:


    • To render and save images using the controls provided by external 3D structure viewing programs that read PDB file format, such as Rasmol:

      • Open the MMDB summary page for the structure of interest.
      • In the "Download Structure Data" box, select "Format:PDB" and the desired "Data Set," then press the "Download" button.
      • Open the file in any 3D structure viewer (e.g., Rasmol) that reads PDB file format.
      • Render, label, color, and save the structure as desired, according to the instructions provided by the structure viewing program's help documentation
     
    Save structure components back to top  
    The sequence and/or chemical records for the molecular components of a structure can be retrieved by: (a) following the link for each component displayed in the tabular summary at the bottom of a structure record to its corresponding record in the Entrez Protein, Nucleotide, and/or PubChem database, or (b) selecting the appropriate items from the "Links" pop-up menus on the search results (docsum) page for the structure.

    Once you are viewing the components in the relevant Entrez database, you can display and/or save those records in any format that is available for that database. For example, records from the Entrez Protein database can be saved in FASTA format (which is convenient for sequence analysis), as a list of GI numbers, or in other formats such as GenPept (which contains sequence data plus annotations, similar to GenBank format). The Entrez help document provides additional information about sequence database record formats. The Entrez Gene help and PubChem help documents describe record formats for genes and small molecules, respectively.


    Molecular Components back to top


    Tabular list of molecular components

    The table near the bottom of a structure summary page lists the molecular components of the structure, which may include proteins, nucleotide sequences (DNA, RNA), and chemicals. The graphics and other links in the table open more detailed displays. For example, mouse over any icon in the graphic display on a live structure summary page (e.g., 1PTH) for more information about that component or feature annotation.

    For each molecular component, the following information is provided:
    Label Count Molecule
    Proteins are shown as circles example of circle icons used to depict proteins
    Nucleotide sequences are shown as squares example of square icons used to depict nucleotide sequences
    Chemicals are shown as diamonds example of diamond shaped icons used to depict chemicals
    Non-standard biopolymers are shown as parallelograms example of parallelogram icons used to depict non-standard biopolymers
    If any protein or nucleotide molecules in the structure were generated by applying transformations from crystallographic symmetry, their labels are shown as alphanumeric combinations (for example, Example of circle icons with alphanumeric labels used to depict protein molecules generated by applying transformations from crystallographic symmetry. or Example of square icons with alphanumeric labels used to depict nucleotide sequences generated by applying transformations from crystallographic symmetry.), indicating the source molecule from which they were generated and the copy number. Chemicals that interact only with such molecules were also generated by applying transformations from crystallographic symmetry; their labels include an underscore bar, with a number on either side of the underscore bar to indicate the source chemical and the copy number, respectively.
    If you are viewing the structure's biological unit, the count reflects the number of molecules that were present in the PDB source file plus any copies that were generated by applying transformations from crystallographic symmetry.

    If you are viewing the structure's asymmetric unit, the count reflects only the number of molecules that were present in the PDB source file.
    The name or other descriptive identifier of the molecule:

    Protein names are derived from the COMPND record of the PDB source file.

    Nucleotide sequence names are derived from the COMPND record of the PDB source file.

    Chemical names are derived from the HETNAM record of the PDB source file or from the MeSH terms associated with the corresponding PubChem Compound or Substance record.
    Additional details for each type of component: proteins, nucleotide sequences (DNA, RNA), chemicals, and non-standard biopolymers:
    Proteins back to top LABEL: Labels for protein molecules are derived from their single letter chain codes in the PDB source file, and are shown as circle icons in the interaction schematic, for example example of circle icons used to depict proteins.
    Labels for protein molecules that were generated at NCBI by applying transformations from crystallographic symmetry are shown as an alphanumeric combination, for example Example of circle icons with alphanumeric labels used to depict protein molecules generated by applying transformations from crystallographic symmetry., indicating the source chain from which they were generated and the copy number.

    COUNT: If you are viewing the structure's biological unit, the count reflects the number of protein molecules that were present in the PDB source file plus any copies that were generated by applying transformations from crystallographic symmetry. If you are viewing the structure's asymmetric unit, the count reflects only the number of molecules that were present in the PDB source file.

    MOLECULE: The name of the protein, derived from the COMPND record of the PDB source file. If a particular protein name has been applied to multiple molecules (e.g., PDB chains A, B, etc.) within the PDB source file, those molecules are considered to be the same. A non-redundant list of protein molecules is then displayed, with the "count" column indicating the number of instances of each protein molecule in the structure's biological unit or asymmetric unit, depending on what you are viewing in the current display. Each protein molecule is represented with a sequence graph and annotated with features such as 3D domains and domain families, as described below.

    GENE: A gene symbol, if/as available, appears beside the name of each protein molecule in the tabular list of molecular components. The protein-gene association is determined in the following way:
    (1) The source database, PDB, provides a UniProt ID for each protein chain in a structure record.
    (2) The NCBI Gene database generates data files on its FTP site that provide mappings between protein identifiers and gene identifiers. Specifically: (a) the "gene_refseq_uniprotkb_collab.gz" file lists the correspondence between UniProt and RefSeq protein accessions; and (b) the "gene2accession.gz" file lists the correspondence between RefSeq protein accessions and Gene IDs. The MMDB data processing pipeline creates a join between these two tables in order to map each UniProt ID to its corresponding Gene ID, and to link to the NCBI Gene record.
    (Note that the protein sequence in the structure record is not necessarily identical to the protein product of the gene. For example, a structure record might only contain a fragment of the protein rather than the whole protein. So there is a mapping between the structure's protein molecule and the gene product, but not necessarily an exact sequence match.)

    Protein annotation graphic
    Sequence graph back to top The sequence bar graph for each protein molecule in the molecular components table shows the protein's length in amino acids. Beneath that is an interactive graphic of the geometrical and biological features annotated on the protein, such as 3D domains and domain families (protein classifications), respectively. For example, the illustration below shows the features annotated on the Prostaglandin H2 Synthase 1 protein, which is a component of the prostanglandin H2 synthase structure (1PTH) from sheep. Click on the image to open the live MMDB structure summary record for 1PTH, which in turn includes a live, clickable protein annotation graphic:

    sample sequence graph showing the features annotated on the Prostaglandin H2 Synthase-1 protein, such as conserved domain families, which infer function, and 3D domains, which are compact substructures that are used to identify similar 3D structures. The protein is a component of the prostanglandin H2 synthase structure, 1PTH. Click on the image to open the MMDB structure summary record for 1PTH, which in turn includes a live, clickable protein annotation graphic
    3D Domains back to top 3D domains are compact structural units within a protein that are identified automatically in MMDB using purely geometric criteria. A protein molecule can contain one or more 3D domains, which often correspond with conserved domains (illustrated example) observed in molecular evolution. Additionally, proteins that are dissimilar in sequence might contain geometrically similar 3D domains, indicating a distant homology that cannot be recognized by sequence comparison. 3D domains are used in the identification of VAST Similar Structures.

    The Colored bars in the "3D Domains" line in a protein molecule's sequence graph indicate the 3D domain boundaries. Click on the bar for any 3D domain in the "show annotation" display to retrieve similar structures identified by the VAST algorithm.

    Note that a protein molecule can contain one or more 3D domains. A 3D domain may be composed of a single region of protein sequence, or two or more non-contiguous regions of the protein sequence.

    If no compact substructures have been found to exist within a protein molecule, then the overall molecule is regarded as a 3D domain in its own right. In that case, the "3D Domains" line does not appear in the "show annotation graphic" and you can click on the sequence bar itself to retrieve similar structures identified by the VAST algorithm. That will retrieve other structures similar in 3D shape of the overall protein molecule..

    (3D domains can also be seen in the interactive 3D structure view by displaying the structure in the free iCn3D web-based 3D viewer and selecting the menu option for "Color > 3D Domain", or by displaying the structure in the free Cn3D stand-alone software program and selecting the "Style > Coloring Shortcuts > Domain" option.)
    Domain Families
    (Protein classification)
    back to top The "Domain Families" text link in a protein molecule's sequence graph opens the CD-Search results for that protein sequence, showing the conserved domains found in the protein, which infer protein function. These are the results of an RPS-BLAST search of the protein molecule against the Conserved Domain Database.

    In contrast to 3D domains, the domain families are determined through the identification of blocks of amino acid residues (via multiple sequence alignments) that have been conserved across a broad range of taxonomic nodes and therefore represent recurring units of molecular evolution. The CDD help document and CD-Search help document provide more details about conserved domains and searching the database.

    Mouse over the cartoon representing a conserved domain for brief information about it, and click on the cartoon to open the corresponding, detailed record in the Conserved Domain Database. More details about each type of conserved domain hit are below:

    Specific Hits

    A Specific Hit meets or exceeds a domain-specific e-value threshold and represents a very high confidence that the query sequence belongs to the same protein family as the sequences use to create the domain model. Therefore, there is also a high confidence level for the inferred function of the protein query sequence. (Details and illustrations are provided in the Conserved Domain Database help document.)

    Superfamilies

    A Superfamily is the domain cluster to which the specific and/or non-specific hits belong. This is a set of conserved domain models that generate overlapping annotation on the same protein sequences and are assumed to represent evolutionarily related domains. See additional details, including information about clustering methodology, in the CDD help document section on "What is a superfamily?"

    Multidomains

    Multi-domains are domain models that were computationally detected and are likely to contain multiple single domains. They are typically shown as grey-colored bars. (Examples are shown in the concise display and full display illustrations in the CD-Search help document.)

    Nucleotide Sequences
    (DNA or RNA)
    back to top LABEL: Labels for nucleotide molecules are derived from their single letter chain codes (e.g., C, D) in the PDB source file. They are shown as square icons in the interaction schematic, for example example of square icons used to depict nucleotide sequences.
    Labels for nucleotide sequences that were generated at NCBI by applying transformations from crystallographic symmetry are shown as an alphanumeric combination, for example Example of square icons with alphanumeric labels used to depict nucleotide sequences generated by applying transformations from crystallographic symmetry., indicating the source chain from which they were generated and the copy number.

    COUNT: If you are viewing the structure's biological unit, the count reflects the number of nucleotide molecules that were present in the PDB source file plus any copies that were generated by applying transformations from crystallographic symmetry. If you are viewing the structure's asymmetric unit, the count reflects only the number of molecules that were present in the PDB source file.

    MOLECULE: The name of the nucleotide sequence, derived from the COMPND record of the PDB source file, with the "count" column indicating the number of instances of each molecule in the structure's biological unit or asymmetric unit, depending on what you are viewing in the current display.

    Bar graph for each nucleotide molecule:
    Sequence graph The bar graph shown for each nucleotide sequence molecule in a structure record shows the molecule's length in nucleotides. Follow the "N Nucleotide" text link (that appears to the left of the molecule's bar graph) to open the corresponding sequence record in the Entrez Nucleotide database.

    Chemicals back to top LABEL: If chemicals are present in the structure, they are shown as diamond-shaped icons in the interaction schematic and labeled with integers, for example example of circle icons used to depict proteins. If several chemicals have the same molecule name, they are labeled with the same number.
    If a chemical interacts only with a protein or nucleotide molecule that was generated by applying transformations from crystallographic symmetry, then the chemical was also generated by crystallographic symmetry. Icon labels for chemicals generated by crystallographic symmetry include an underscore bar, with a number on either side of the underscore bar to indicate the source chemical and the copy number, respectively.

    COUNT: If you are viewing the structure's biological unit, the count reflects the number of chemicals that were present in the PDB source file plus any copies that were generated by applying transformations from crystallographic symmetry. If you are viewing the structure's asymmetric unit, the count reflects only the number of chemicals that were present in the PDB source file.

    MOLECULE: The name of the chemical, derived from from the HETNAM record of the PDB source file or from the MeSH terms associated with the corresponding PubChem Compound or Substance record. In order to provide a non-redundant list of chemicals found in the structure, the name of each unique chemical is listed only once. If two or more non-biopolymers were assigned the same HETNAM by PDB, the are grouped together under that name in the molecular components table. If their chemical structures are slightly different, they will be linked to separate PubChem substance IDs (SIDs). The "count" column indicates the number of instances of each chemical in the structure's biological unit or asymmetric unit, reflecting what you are viewing in the current display.

    Note: Ions that interact with the biomolecules in the structure but do not reach the 5 contact threshold will be absent from the interaction schematic; however, they will be listed in the tabular summary of molecular components. Interactions for short peptides, or for molecule types other than protein, DNA/RNA, and chemical, are not calculated. Molecules, such as crystallization agents, etc., that are not part of the biologically active molecule are absent from both the interaction schematic and the molecular components list.

    Thumbnail image for each chemical:
    Thumbnail graphic The thumbnail graphic for each chemical links to corresponding information about the physiochemical and biological properties of each chemical in the PubChem Compound or PubChem Substance database.

    Non-standard Biopolymers back to top Non-standard biopolymers are molecules such as nucleotide or protein sequences that contain a large percentage of non-standard residues. As an example, view the MMDB summary page for 4GLS "Crystal Structure of Chemically Synthesized Heterochiral {D-Protein Antagonist plus VEGF-A} Protein Complex in space group P21."

    LABEL: If non-standard biopolymers are present in the structure, they are shown as parallelograms in the interaction schematic and labeled with letters, for example example of parallelogram icons used to depict non-standard biopolymers. Labels for non-standard biopolymers that were generated at NCBI by applying transformations from crystallographic symmetry are shown as an alphanumeric combination, indicating the source molecule from which they were generated (to the left of the underscore bar) and the copy number (to the right of the underscore bar).

    COUNT: If you are viewing the structure's biological unit, the count reflects the number of non-standard biopolymers that were present in the PDB source file plus any copies that were generated by applying transformations from crystallographic symmetry. If you are viewing the structure's asymmetric unit, the count reflects only the number of non-standard biopolymers that were present in the PDB source file.

    MOLECULE: The name of the non-standard biopolymer, derived from from the COMPND record of the PDB source file. In order to provide a non-redundant list of non-standard biopolymers found in the structure, the name of each unique chemical is listed only once. If two or more non-biopolymers were assigned the same COMPND by PDB, the are grouped together under that name in the molecular components table. The "count" column indicates the number of instances of each non-standard biopolymer in the structure's biological unit or asymmetric unit, reflecting what you are viewing in the current display.


    Web API back to top

    Web API:  URL format for displaying or saving a structure record: back to top

    It is possible to view or save a 3D structure record by linking directly to it. The URL format, parameters, and allowable values, are as follows:

    base URL | parameters & allowable values (uid, buidx, fileformat, display, complexity) | examples of URLs for displaying or saving 3D structure records
    • base URL: back to top
    • /Structure/mmdb/mmdb_strview.cgi?
    • parameters and allowable values: back to top
    • uid Specify the structure record you want to retrieve by entering either its MMDB ID or PDB ID. The PDB ID can be either lowercase or uppercase.
      buidx Specify whether you want to see the structure's asymmetric unit, the default biological unit (biounit), or other biological units (if present). The allowable values are:

      0 = asymmetric unit
      1 = default biological unit
      2 = second biological unit (if present in the structure record)
      N = Nth biological unit.

      Default:  If the buidx parameter is not included in the URL, a "buidx" value of "1" will be applied (i.e., the default biounit will be returned).

      fileformat Specify the desired file format for viewing the structure. The allowable values can be written in either lowercase or uppercase and are as follows:

      cn3d = This option renders the data in ASN.1 format, which enables you to view the data in NCBI's free Cn3D structure viewing program. Cn3D allows examination of biological units, asymmetric units, and sequence-structure relationships, and allows superposition of geometrically similar structures.

      pdb = This option renders the data in PDB format, which enables you to view the data in programs such as Rasmol and other 3D structure viewers that accept PDB file format.
      Note, however, that the saved PDB file may be somewhat different from the original PDB source file, due to content validation procedures applied during MMDB data processing. These differences are explained in a separate section of this document on "saving a struture record > PDB format > details about the data that are saved."

      To save an exact copy of the original PDB source file, use the parameters of "fileformat=pdb" AND "complexity=4". In such case, the "buidx" argument will be ignored. For other "complexity" input values, the cgi will create an NCBI-style PDB formatted data set with "complexity=3" only (all atoms), and with whatever "buidx" value you specify.
      xml = This option renders the data in XML format.
      If you specify this fileformat, the only display options available are "1" (save data to a file) and "2" (see data in web browser, which is the default display for XML format).

      json = This option renders the data in JSON format.
      If you specify this fileformat, the only display options available are "1" (save data to a file) and "2" (see data in web browser, which is the default display for JSON format).

      Default:  If the "fileformat" parameter is not included in the URL, the cn3d (ASN.1) file format will be returned by default. A separate section of this document provides additional details about file formats.

      display Specify what you would like the browser to do with the file. The allowable values are:

      0 = launch the structure viewer, automatically opening the file in that program so you can view the structure interactively.
      Note that the structure viewer you will use (e.g., NCBI's free Cn3D program or a PDB-format compatible viewer) must be installed on your computer and configured as a helper application for your browser in order for the display parameter of "0" to automatically open the 3D structure. If you already have Cn3D 4.1 or earlier on your computer, you will need to upgrade to Cn3D 4.3 (install) in order to view 3D structures that were reconstructed by applying transformations from crystallographic symmetry.
      1 = save data to a file

      2 = see data in the web browser
      Note: If you specify "xml" or "json" for the "fileformat" parameter, the only display options available are "1" (save data to a file) and "2" (see data in web browser, which is the default display for xml and json format.
      Defaults:  If the display parameter is not included in the URL, the value of 0 (launch structure viewer) will be used by default if the fileformat parameter is set to "cn3d" or "pdb". The display value of "2" (see data in web browser) will be used by default if the fileformat parameter is set to either "xml" or "json".

      complexity Specify the desired complexity (data set) of the structure you want to view. The allowable values are:

      1 = vector. This option is valid if fileformat=cn3d or xml or json. It returns data about the secondary structures identified in the asymmetric unit or biological unit, and their orientation (vector) in 3D space.

      2 = backbone (alpha carbons). This option is valid if fileformat=cn3d or xml or json.

      3 = all atoms (single 3D structure). This option is valid for all fileformat values.

      4 = PDB model. This option is valid only if fileformat=pdb.
      If fileformat=pdb and complexity=4, the program will return the original PDB source file. In that case, the only available biounit value is buidx=0 (asymmetric unit); that value will be applied regardless of whether you insert any other value.

      Default:  If the complexity parameter is not included in the URL, the value of 3 (all atoms) will be used by default.

      If a structure has >25,000 atoms, the value of 2 (backbone) is selected by default. If a structure record contains an NMR ensemble or a correlated disorder set from crystallography, this will download backbone data only for the first model in the set.

      If the "fileformat" parameter is set to "pdb," the only complexity values available are 3 (all atoms) and 4 (PDB model); if any other number is specified, it will be invalid and will be set to 3.


    • examples of URLs for displaying or saving 3D structure records: back to top

    • Example #1: Retrieve the 1LFL (Deoxy Hemoglobin, 90% Relative Humidity) structure record's default biological unit ("buidx=1") in cn3d (ASN.1) fileformat, then display the structure in the Cn3D program, with a complexity that shows all atoms:

      /Structure/mmdb/mmdb_strview.cgi?uid=1LFL&buidx=1&fileformat=cn3d&display=0&complexity=3
      Note: If desired, the "complexity" parameter can be omitted from the URL, because the default complexity value is "3."

      Example #2: Retrieve the 1LFL (Deoxy Hemoglobin, 90% Relative Humidity) structure record's asymmetric unit ("buidx-=0") in PDB fileformat, then display the file in the web browser, showing the coordinates for all atoms ("complexity=3").

      /Structure/mmdb/mmdb_strview.cgi?uid=1LFL&buidx=0&fileformat=pdb&display=2&complexity=3
      Note that the saved PDB-format file returned by the URL above may be somewhat different from the original PDB source file, due to content validation procedures applied during MMDB data processing. These differences are explained in a separate section of this document on "saving a struture record > PDB format > details about the data that are saved." If you would like to view/download a copy of the original PDB source file, use the URL parameters shown in the next example.

      Example #3: Retrieve the original PDB source file for the 1LFL (Deoxy Hemoglobin, 90% Relative Humidity) structure record, by using the parameters of "fileformat=pdb" AND "complexity=4".

      /Structure/mmdb/mmdb_strview.cgi?uid=1LFL&fileformat=pdb&display=2&complexity=4
      Note: When the parameters of "fileformat=pdb" and "complexity=4" are used together, the "buidx" argument is ignored. For this reason, the "buidx" parameter is not included in the sample URL above. This is because the original PDB source file contains the asymmetric unit, so that is the only thing that can be returned.

     
    References back to top


    Citing the Molecular Modeling Database: back to top

    Madej T, Lanczycki CJ, Zhang D, Thiessen PA, Geer RC, Marchler-Bauer A, Bryant SH. MMDB and VAST+: tracking structural similarities between macromolecular complexes. Nucleic Acids Res. 2014 Jan 1;42(1):D297-303. Epub 2013 Dec 6. doi: 10.1093/nar/gkt1208. [PubMed PMID: 24319143] [Full Text]

    Additional References: back to top

    Additional articles are noted on the publications page for the Molecular Modeling Database.

     
    Revised 16 August 2021
    External link. Please review our privacy policy.
    HHS Vulnerability Disclosure