

NCBI Bookshelf. A service of the National Library of Medicine, National Institutes of Health.
National Collaborating Centre for Nursing and Supportive Care (UK). Irritable Bowel Syndrome in Adults: Diagnosis and Management of Irritable Bowel Syndrome in Primary Care [Internet]. London: Royal College of Nursing (UK); 2008 Feb. (NICE Clinical Guidelines, No. 61.)

Update information March 2017 Recommendation 1.1.1.2 in the short version was updated by NICE with more recent guidance on recognition and referral for suspected cancer. Recommendation 1.1.1.3 in the short version was removed as it was no longer needed after the changes to recommendation 1.1.1.2. February 2015 NICE has made new recommendations relating to the clinical management (dietary and lifestyle advice, and pharmacological therapy) of people with IBS. The recommendations and evidence in sections 3, 7.6, 8.4, 8.5.2 and 9.1 of this guideline that have been highlighted in grey have been stood down and replaced. New recommendations on dietary and lifestyle advice, and pharmacological therapy, can be found in the irritable bowel syndrome in adults update CG61.1. September 2012 A recommendation in this guideline (see pages 28 and 37) has been partially updated by recommendation 1.1.2.1 in 'Ovarian cancer' (NICE clinical guideline 122, 2011).
Irritable Bowel Syndrome in Adults: Diagnosis and Management of Irritable Bowel Syndrome in Primary Care [Internet].
Show details5.1. Summary of development process
The methods used to develop this guideline are based on those outlined by Eccles and Mason (2001). The structure of the recommendations sections (sections 6 to 11) (i.e. recommendations; evidence statements, evidence narrative and guideline development group commentary) came from McIntosh et al. (2001).
The stages used in the development of this guideline were as follows:
- Guideline scope development following referral from the department of health
- NICE stakeholder review and feedback
- Multidisciplinary guideline development group convened with formal appointment of the clinical lead and chair of the group by competitive interview
- Establish key clinical questions
- Identify sources of evidence
- Retrieve potential evidence
- Evaluate potential evidence relating to clinical and cost effectiveness, quality of life, for eligibility, quality and relevance
- Extract relevant data from studies meeting methodological and clinical criteria
- Interpret each paper, taking into account the results (including, where reported, beneficial and adverse effects of the interventions, cost, comfort and acceptability to patients), the level of evidence, the quality of the studies, the size and precision of the effect, and the relevance and generalisability of the included studies to the scope of the guideline
- Analyse, where appropriate using statistical synthesis, the results reported in the studies
- Prepare evidence reviews and tables which summarize and grade the body of evidence
- Formulate conclusions about the body of available evidence based on the evidence reviews by taking into account the above factors
- Agree final recommendations
- Submit drafts (short version and full version) of guideline for feedback from NICE registered stakeholders
- Consider stakeholders comments (GDG)
- Submit final version of the guideline to NICE.
NCC-NSC technical team members searched bibliographic databases for evidence, examined and quality assessed the evidence. The technical team compose successive drafts of the recommendations and guideline documents (including the full version of guideline; the NICE version and the quick reference guide), based on the evidence reviews and GDG input and deliberations. The GDG having interpreted the evidence formulated the recommendations. The NICE patient and public involvement programme produced the information for the public version, using the NICE version of the guideline, in collaboration with the NCC-NSC. The general methods for the evidence reviews are reported in sections 5.2 and 5.3. This relationship between the clinical and cost effectiveness results, evidence statements and resulting recommendations, is reported for each review in sections 6 to 11.
The search strategies for the reviews are presented in Appendix B. The included studies for each review are reported in Appendix C; the methodological assessments of the included studies are in Appendix D and the studies excluded from each review are listed in Appendix E.
5.2. Clinical effectiveness review methods
This section describes the methods of systematic reviewing that are common to all clinical effectiveness reviews of intervention studies. At the start of the guideline development process, a general protocol was discussed with the GDG which resulted in the selection criteria and approaches to analysis described below. Further details specific to the reviews are given for each review.
Selection criteria
The following selection criteria were to be applied to studies to determine their suitability for inclusion in the reviews
Types of studies
For intervention studies, the randomised trial (RCT) is the primary trial design. Quasi randomised studies could also be included (e.g. allocation by alternation, date of birth, etc). Where there is insufficient evidence from RCTs or quasi RCTs, cohort studies could be considered.
Both parallel and crossover trial designs could be included in the guideline: in the former, patients are randomised to one of two (or more) interventions; in the latter, patients receive interventions in a randomised order, crossing over to the second (and third) interventions after a specified period (‘washout period’).
Crossover trials are common in chronic conditions: they have the advantage that the patient acts as their own control, so there are no differences in baseline patient characteristics for each intervention, unlike parallel trials in which different patient groups receive the interventions. The crossover design is only appropriate when the condition is truly chronic (i.e. no progression or regression) and when the interventions make no permanent or slow decaying changes to the patient’s condition. Crossover trials have the disadvantage that effects of the second intervention may be influenced by those in the first period (carryover effects). To avoid errors of this type, better designed crossover trials have a washout period between interventions, in which the patient characteristics are allowed to return to the levels present before the first intervention. Ideally, the characteristics are measured at intervals following the first intervention period, and the second intervention is delayed until the baseline values are retrieved, but, especially in older studies, this is usually approximated by the trialists using a ‘washout period’ they believe to be appropriate.
Some studies do not have a washout period, and the GDG’s view was that crossover trials without washout periods should not be included, unless first period data are available – although, even this should be treated with caution, unless individual patient data are reported. For each review, the GDG decided if crossover trials were allowable, and, if so, defined the washout period. Factors taken into consideration included the lifetime of the intervention (especially for drugs). The washout period for each review is given in the methods section for that review. Trials with washout periods shorter than the pre-determined value should be excluded. Studies that do not state a washout period should be assumed to have none, and therefore should be excluded.
Studies should be restricted to the English language, with the exception of studies translated for Cochrane reviews, but the date should not be restricted.
Types of participants
Participants should be adults (18 years and older). However, studies could be included if they had some participants slightly below 18 years, provided that the mean age indicated that the majority were adults.
Participants should have a diagnosis of IBS. Suitable definitions included Rome I, Rome II or Manning criteria. Studies could also be included if the authors stated the patients had IBS, or if they described patients who had a set of symptoms suggestive of IBS. Studies reporting patients with single symptoms such as chronic constipation/diarrhoea in isolation should not usually be included. Studies could be included if a proportion of the patients had IBS, provided the IBS subgroup was reported separately, but such studies should be treated with caution unless the IBS subgroup members were separately randomised to treatments.
All settings could be included, but those in secondary/tertiary care should be distinguished from those in primary care only. This decision was taken regardless of the date of the study (people who were outpatients 20 years ago would now be treated in primary care).
Indirect evidence may be considered for some reviews, where direct evidence is not available, or is insufficient (for example, the use of laxatives in the treatment of constipation in non-IBS patients). In all cases, indirect evidence should be used to provide additional information, and its quality should be downgraded accordingly. Indirect evidence should not be combined in a meta-analysis with direct evidence. The indirect evidence permitted is given in the methods section for each review.
Types of intervention
The interventions varied across reviews and are detailed at the beginning of each review.
Interventions could be given in three different ways:
- As short-term rescue medication (e.g. antimotility agents for acute diarrhoea episodes)
- As a longer-term maintenance treatment (e.g. antispasmodics)
- As a ‘one-off’ intervention or series of treatments at the start of the management period (e.g. psychotherapy).
For the longer-term, maintenance interventions, the GDG specified a minimum acceptable period for the intervention. This was set at four weeks, and the reason for this was partly to take into account women’s menstrual cycles. Maintenance studies with intervention durations of less than four weeks should not be included.
Types of outcome measures
The GDG decided on a number of outcomes related to symptom control. These would either be measured as the number of patients with a particular feature (dichotomous outcomes) or as a mean measurement, preferably on a validated scale (continuous outcomes). The following outcomes were considered to be primary:
- Global improvement of symptoms
- Global symptom scores.
Other outcomes were also considered important:
- Abdominal pain
- Stool score/general improved bowel habit
- Quality of life, using a validated scale
- Adverse effects.
The time of measurement and duration of follow-up should be recorded, together with information on whether the studies reported a change in symptoms from baseline, final values following treatment, or a mean value based on diary records.
‘Global’ meant a measure that took into consideration a combination of the following IBS symptoms: pain, bloating and stool properties (e.g. frequency, consistency, ease of passage). Alternatively, the participants could have assessed their overall symptoms as improved/same/worse; provided this did not obviously refer to just one component of IBS, these measurements could also be included in the ‘global’ category. Studies in which the authors labelled their outcomes as ‘global’ but in fact only measured one component should be analysed as single components.
The GDG decided that different definitions of improvement should not be distinguished (e.g. 100%, 75% improvement, slight, much), and that categorical outcomes should be dichotomised, e.g. grouping together ‘much improvement’ with ‘slight improvement’.
For the individual symptom components, studies could record the number of people with that symptom at the end of the study or during the study, or they could record changes in symptoms over time, or a final symptom score at a particular time. For a positive outcome, the number of people with fewer symptoms (e.g. less pain) or the number with no symptoms should be recorded. For a negative outcome, the number with more symptoms (e.g. increased bloating), and the number of people with that symptom should be used. These two types of outcomes (absolute and increase/decrease) could be recorded on the same forest plot, but should not be combined in a meta-analysis.
For continuous outcomes, we recorded the severity score of the symptom (negative outcome) or the improvement in the symptom score (positive outcome).
Stool scores can have various formats: sometimes the raw values are recorded (e.g. stool frequency or consistency) or the severity may be assessed on a visual analogue scale. In the former, this measurement is only meaningful when the results are given separately for the different types of IBS - whether this is a positive or negative outcome depends on what type of IBS the person had. Therefore, if a study has people with a range of types of IBS, this type of raw value measurement should be disregarded. The severity score may be included as an acceptable outcome measure, as may the patient’s assessment of improved bowel habits.
We note that the majority of these outcome measures are subjective and therefore, have potential for bias.
SEARCH STRATEGY
The search strategies and the databases searched are presented in detail in Appendix B. All searches were carried out on the following core databases: Medline, Embase, Cinahl (all using the OVID interface) and The Cochrane Library. Additional databases were searched for individual reviews where appropriate.
For this guideline, a general set of terms was produced relating to IBS. The relevance of the terms diarrhoea and constipation was explored before they were included in the IBS filter. For each review, terms related to the intervention were combined with the set of IBS terms. Where appropriate, study design filters (RCT and systematic review) were applied. Results were limited to papers published in English where possible. All searches were updated to June 2007.
Hand-searching was not undertaken following NICE advice that exhaustive searching on every guideline review topic is not practical or efficient (Mason 2002). Reference lists of articles were checked for studies of potential relevance.
METHODS OF THE REVIEW
Sifting process
Once the search had been completed, the following sifting process took place:
- 1st sift: one reviewer sifted the title/abstract for articles that potentially met the eligibility criteria
- 2nd sift: full papers were ordered that appeared relevant and eligible or where relevance/eligibility was not clear from the abstract
- 3rd sift: full papers were appraised, generally by one reviewer using an inclusion criteria form, and this was checked where necessary by a second reviewer.
Quality assessment and validity
Once individual papers were retrieved, the articles were checked for methodological rigour (using quality checklists appropriate for each study design), applicability to the UK and clinical significance. Assessment of study quality concentrated on dimensions of internal validity and external validity. At this stage, some studies were excluded if the interventions were not licensed for use in the UK or they were not regularly used in the UK. Studies in which the interventions were obsolete were also excluded.
Studies for which the methodological quality indicated a high potential for bias were included in the review, but were not included in the analysis.
Data abstraction
Data from the included studies were extracted by one reviewer for each review, with random checking by a second reviewer, and entered into a Microsoft Access relational database that had been especially designed for the guideline. The use of the database provided a more structured extraction, for example, only certain choices could be made for some items, although free text fields were also used. The main advantage of using a database for this purpose is that a large amount of detail can be input, and then an overview obtained using database sorting procedures. The following data were extracted from each study:
- Review being addressed
- Study details: study design (RCT, quasi-randomised, cohort study, etc); parallel/crossover, washout period; country where trial conducted; setting; funding
- Study quality
- Participants: age (mean and range), gender (ratio male:female), co-morbidities, inclusion/exclusion criteria, IBS diagnosis method, type of IBS, presence of bloating, presence of pain, measure of severity of IBS, symptom status at trial entry, length of time since diagnosis, duration of symptoms, ethnicity, socio-economic group, weight, post-infective/non post-infective initiated IBS
- Interventions: class (e.g. insoluble fibre) and sub-class (e.g. wheat bran), total amount per day, frequency/time of consumption, means of delivery (oral capsule, taken as a food, drink, etc), duration of treatment; concurrent treatment in both arms
- Comparator: placebo (details of what it is), other control group, other intervention
- Results for each outcome.
If studies were published more than once, data were extracted from the most recent report where there were differences; otherwise all papers were used for data extraction.
Masked assessment, whereby data extractors are blind to the details of journal, authors etc, was not undertaken.
Appraisal of methodological quality
The methodological quality of each trial was assessed by one reviewer and randomly checked by a second. The following quality items were assessed:
- A priori sample size calculation:
- Whether or not this was carried out
- Method of generation of the randomisation sequence:
- The means by which interventions are distributed amongst the participants
- Whether the method was reported or unclear (i.e. no details given)
- Whether the reported method was adequate, inadequate or partial (Table 1)
- The means of preventing the treatment assignment being known before the time of allocation
- Whether the method was reported or unclear (no details)
- Whether the reported method was adequate, inadequate or partial (Table 1)
- Baseline comparability of treatment groups:
- For relevant risk factors
- Patients stated to be blinded, especially for comparisons with placebo:
- Blinding involves hiding the nature of the intervention from participants, clinicians and treatment evaluators after allocation has taken place
- Blinding may be not be possible depending on the nature of the interventions
- Blinding may be more important for some outcomes than others (this is noted in the reviews)
- Outcome assessor stated to be blinded
- Studies with at least 20% of data missing from any group were considered to be potentially biased
- Those with moderate loss to follow up (20 to 50%) were considered in sensitivity analyses
- Those with 50% or more patients missing from any one group were regarded as flawed and not analysed further
- Intention to treat analysis:
- Trial participants should be analysed in the groups to which they were randomised regardless of which (or how much) treatment they actually received, and regardless of other protocol irregularities
- All participants should be included regardless of whether their outcomes were actually collected
- For crossover trials, the washout period relative to the minimum for the review:
- Studies in which the washout period was shorter than the minimum were not included, as were studies with no washout or none stated
- Studies reporting first period only data as individual patient data were included
- The intervention time relative to a minimum of 4 weeks or as defined for the particular review:
- Studies in which the intervention time was shorter than 4 weeks were usually excluded, but slightly shorter durations could be included in the absence of other data.
Data synthesis
Meta-analysis of similar trials, where appropriate, was carried out using The Cochrane Collaboration’s analysis software, Review Manager (Version 4.2). Trials were pooled using a fixed effects model and plotted on forest plots. Where there was significant heterogeneity, a random effects model was used as a sensitivity analysis.
For dichotomous studies, we used the analyses reported by the authors, which was usually those reporting an outcome. Where there were incomplete data reported (more than 20% missing in any one group), we carried out sensitivity analyses, excluding these studies.
Where it was possible to combine studies, outcomes were summarised for dichotomous data using odds ratios (as default), relative risks (where the event rate in either arm was greater than 20%), or Peto odds ratios (where there were studies with no events in one arm). Numbers needed to treat (with the control group rate to which they apply) were calculated from the risk difference, where appropriate. The number needed to treat (NNT) is the number of people who would have to be treated for one to have an improved outcome.
For continuous data, weighted mean differences were used and where the studies reported measurements on different scales, standardised mean differences were used. Studies reporting final values and studies reporting change scores were combined if the scales used were the same, otherwise they were reported separately. Summary statistics and their 95% confidence intervals (95% CI) were reported where sufficient detail allowed their calculation.
In some studies, the mean difference was given with a p-value for the difference; this allowed calculation of the standard error. Results from such studies could then be combined in a meta-analysis with other studies reporting means and standard deviations: the standard error and mean difference were calculated for each study and then the studies pooled using the fixed effects generic inverse variance method in RevMan to give a weighted mean difference and 95% confidence intervals. This procedure is only appropriate when the same scales are used or transformation between scales is possible.
Crossover and parallel studies were analysed separately because there were insufficient data to calculate correlation factors. Trials were analysed by the conventional approach of treating the two arms of the crossover as if they were from a parallel trial with separate groups. Alternatively, if first period data were available, these were used in the analysis and the parallel and first period (pseudo-parallel) trials combined.
Stratifications
We planned a-priori to separate studies by the type of IBS, into patients with constipation predominant, diarrhoea predominant and alternating types. Studies that did not say or that considered all types of IBS together were treated as a separate group. Other stratifications were planned depending on the review.
Subgroup analyses
Randomised trials generally report four different types of subgroup analysis:
- Between-trial, in which the studies are separated according to the particular variable considered (e.g. dose)
- Within-trial subgroup analyses, with stratification of the participants by the particular characteristic (e.g. post-infective or not) followed by randomisation
- A-priori defined within-trial subgroup analyses, in which the participants were not stratified, but later separated according to pre-specified characteristics – these analyses should be included cautiously, because the interventions are not randomised to the subgroups
- Post-hoc within-trial subgroup analyses, in which the participants were separated afterwards without pre-specification.
All subgroup analyses are non-randomised comparisons between the different subgroups, however, types 1 and 2 are more reliable. Type 3 analyses can be included in meta-analyses with caution, but post-hoc within trial subgroup analyses were considered to be data-driven and were included only under exceptional circumstances. Most commonly in the guideline, the term ‘subgroup analysis’ refers to between-study comparisons.
Subgroup analyses were carried out in order to investigate heterogeneity or to investigate pre-specified features. We assessed heterogeneity between trials by visual inspection of forest plots, noting where there was poor overlap of horizontal lines, and by using statistical measures: the χ2 test for heterogeneity and the level of inconsistency, I2 (I2= [(χ2 − df)/χ2] × 100%, where df is the degrees of freedom). We considered that there was heterogeneity if the p-value (for heterogeneity) was less than 0.1 and I2 was greater than 50%. Any heterogeneity was explored further and unexplained heterogeneous results were not used as the basis for recommendations.
The following pre-specified factors were proposed for subgroup analyses:
- Type of intervention (e.g. soluble fibre/insoluble/both)
- Dose (defined for the particular review)
- Duration of intervention
- Post-infective/Non-post-infective
- Symptom severity.
Subgroup analyses specific to each review were also carried out, as appropriate.
Sensitivity analyses
Sensitivity analyses were carried out to investigate assumptions within the analyses. These included the following:
- Methodological quality
- Setting.
For methodological quality, we paid particular attention to allocation concealment, loss to follow-up and blinding of patients. We did not include studies with more than 50% loss to follow-up for a particular outcome in the analyses. Otherwise we carried out sensitivity analyses on studies that had between 20 and 50% withdrawals from any group (or protocol deviations that were eliminated from the study’s analyses).
Sensitivity analyses were also carried out where there were quasi-randomised studies (e.g. sequence generation by alternate allocation or date of birth) or inadequate allocation concealment. If these represented the only evidence, their quality was downgraded accordingly.
Significance
Sometimes the results were statistically significant, but small in size. In this case, the GDG decided on what was a clinically important difference in the summary statistics for a particular outcome. Some meta-analyses gave pooled summary statistics close to the null value. Where the confidence interval was narrow, we considered this to be ‘evidence for no significant difference’ between interventions and the approach became similar to that of an equivalence trial (Alderson 2004). Where the confidence interval was wide, there was considered to be insufficient information to determine if there was a difference between interventions. For most outcomes, the GDG judged what constituted a wide confidence interval; if there was any doubt, they decided there was uncertainty.
General approach to reviewing
The clinical effectiveness reviews seek to determine answers to a number of questions, which were investigated using the following comparisons:
- Does the intervention work? (and is it harmful?):
- Direct comparisons of intervention with placebo/none
- Is there a dose effect?
- Direct dose comparisons
- Subgroup analyses (across trials) of intervention versus placebo, by dose
- Is the duration of treatment important?
- Direct comparisons of different durations
- Subgroup analyses of intervention versus placebo, by duration
- Is the intervention better than another treatment?
- Direct comparisons
- Subgroup analyses of interventions versus placebo, by type of intervention
- Is the intervention useful as an adjunct to another treatment?
- Direct comparisons (A + B versus B alone)
- Are there (pre-specified) subgroups of patients for whom the intervention is more effective?
- Subgroup analyses: preferably within trials (stratification then randomisation for each subgroup) or across trials; less acceptably, within trials.
We note that the best type of information is from direct comparisons in which two values of the variable considered (e.g. dose 1 and dose 2) are randomised to different groups of people. However, some useful information can be obtained from between-study subgroup analyses.
Grading evidence
For some reviews, we used the GRADE‡ scheme (GRADE working group 2004) to assess the quality of the evidence for each outcome using the approach described below, and evidence summaries across all outcomes were produced.
According to the GRADE scheme, evidence is classified as high, moderate, low or very low:
- High - further research is very unlikely to change our confidence in the estimate of effect
- Moderate - further research is likely to have an important impact on our confidence in the estimate of effect and may change the estimate
- Low - further research is very likely to have an important impact on our confidence in the estimate of effect and is likely to change the estimate
- Very low - any estimate of effect is very uncertain.
The procedure adopted when using GRADE was:
- A quality rating was assigned, based on the study design – for example, RCTs started as high and observational studies as low.
- This rating was up or downgraded according to specified criteria: study quality, consistency, directness, preciseness and reporting bias. These criteria are detailed below. Criteria were given a downgrade mark of −1 or −2 depending on the severity of the limitations.
- The downgrade/upgrade marks were then summed and the quality rating revised. For example, a decrease of −2 points for an RCT would result in a rating of ‘low’.
- Wherever possible, reasoning was explained for the downgrade marks.
Study quality
Study quality is assessed against standard criteria, depending on the study design. For randomised trials, we took into account: the adequacy of allocation concealment; blinding of participants for comparisons and outcomes susceptible to bias; loss to follow-up and deviations from intention to treat. The GDG regarded blinding of participants to be important for the comparisons with placebo, but did not necessarily consider blinding of different active interventions to be critical. They did not consider blinding to be important for the psychological interventions, mainly because this was not possible to achieve. The majority of outcomes in the IBS guideline are subjective and therefore susceptible to bias. A downgrade mark of −1 was given for inadequate allocation concealment and for a loss to follow-up of more than 20% in any one arm or overall. A loss to follow-up of 50% or more was given a downgrade of −2 (but was more usually excluded from the analysis). If the evidence was a meta-analysis of several studies, we took into consideration the proportion and weighting of poor quality studies, and in some instances carried out sensitivity analyses disregarding these studies and giving a separate rating for the new meta-analysis.
Consistency
When several RCTs have widely differing estimates of treatment effect (heterogeneity or variability in results) the results are regarded as inconsistent. We defined this as a p-value for heterogeneity less than 0.1 and an I2 value greater than 50%. Where this was the case, we gave a downgrade mark of −1. Where possible, we carried out pre-defined subgroup analyses to investigate heterogeneity and reported these results separately. Generally, we did not regard single trials (especially smaller ones) as having inconsistency unless there were a-priori defined subgroups showing widely different effects.
Directness
Directness refers to the extent to which the population, interventions, comparisons and outcome measures are similar to those defined in the inclusion criteria for the reviews. Indirectness is only relevant if there is a compelling reason to expect important differences in the size of the effect. For example, many interventions have more or less the same relative effects across patient groups, so extrapolation is possible and reasonable. There are various types of indirectness found in studies:
- When the guideline-defined drugs differ from those in the studies, but are within the same class. Similar issues arise for other types of interventions, for example, different types of psychotherapy.
- When there are no direct comparisons of interventions, investigators must make comparisons across studies. For example, we want to know the difference in effectiveness between interventions A and B, but we only have information on A versus placebo and B versus placebo.
- Specifically for IBS, the GDG decided that a difference in setting – secondary care in the studies rather than primary care in the guideline – was a relevant indirectness factor. Their reasoning was supported by differences found in surveys of IBS in primary and secondary care (Miller 2006).
Preciseness
This is a rather subjective, but nevertheless important category. Evidence is considered to be imprecise if:
- The sample size is small. This is a subjective measure and is more important in a single study. If there was a power calculation for that outcome and comparison, it was used to decide if a study was ‘small’. Otherwise we used the rule of thumb that if the study had less than 25 patients in any one arm, this was too small. The rationale for this was that below this size, assumptions about normal distributions become much less valid. However, if these small studies were combined in a meta-analysis, we regarded their use as much more acceptable.
- There are sparse data (only a few events and they are uninformative).
- If confidence intervals are sufficiently wide that the effect estimate is consistent with both important harms and important benefits, and would lead to conflicting recommendations. This category requires the GDG to decide what are important harms and benefits for that outcome measure. Where the confidence intervals were very wide, we gave a downgrade mark of −2.
Reporting bias
Reporting bias occurs in two main ways:
- Publication bias, in which papers are more likely to be published if their results are statistically significant. The existence of publication bias in the studies in a meta-analysis can be investigated in a limited way using funnel plots, in which the standard error is plotted against the log odds ratio, the log relative risk or the mean difference. Asymmetry is indicative of reporting bias. This method is usually only useful when there are at least five studies. Industry sponsored studies are also regarded as potentially biased.
We note that the GRADE approach, although rigorous, still requires judgements to be made, for example, what is a ‘wide’ confidence interval; what is a ‘small’ study; how important is blinding of patients for a particular outcome; how serious is it that the study population is treated in secondary care rather than primary? We have indicated how we considered these difficulties in the bullet points above, and the GDG made judgements as appropriate.
Evidence Statements
The GRADE summary (where used) was condensed into evidence statements, which are based on the quantity and quality of the evidence as shown in Table 2. Sometimes the evidence statements summarised more than one outcome measure. Where there were no GRADE summaries, evidence statements were made based on the analyses.
Table 2
Evidence statements.
Generally, for randomised trials, a GRADE rating of ‘good’ equated with the wording ‘good’ or ‘strong’ evidence; a rating of ‘moderate’ with ‘fair’ evidence; a rating of ‘low’ was given the wording ‘weak’ evidence and a rating of ‘very low’ was described as ‘insufficient’ evidence.
5.3. Cost effectiveness review methods
Health economic evidence is useful in guideline development as it assesses the costs and benefits of alternative courses of action which could be recommended within the guideline. Cost-effectiveness evidence can be used to determine whether a particular recommendation would result in the efficient use of NHS resources by considering whether it achieves additional health gain at an acceptable level of cost. Whilst cost-effectiveness is an important consideration for all recommendations made within the guideline, two areas were identified as being priority areas for which cost-effectiveness evidence would have particular importance for informing recommendations. These were identified by the health economist in conjunction with the GDG after consideration of the importance of each clinical question in terms of the number of patients likely to be affected and the impact on costs and health outcomes for those patients.
The use of tests to exclude alternative diagnoses in people with IBS-like symptoms was considered to be a high priority area for economic evaluation for the following reasons: diagnostic testing has the potential to result in earlier diagnosis of organic disease which may improve health outcomes; the widespread use of tests may have significant cost implications; the use of tests may result in unnecessary anxiety for patients, particularly if the rate of false positive results is high; invasive tests may have adverse consequences for patients in terms of complications.
The use of pharmacological and behavioural interventions in the management of IBS was also identified as a high priority area for economic evaluation. Pharmacological interventions were identified as an area of high priority because the ongoing use of these interventions in a large number of IBS patients would have significant implications for the use of NHS resources. Behavioural interventions were identified as an area of high priority because these are not widely used at present in the management of IBS and therefore significant additional resources may be required if these are recommended for widespread use.
Two approaches were employed to provide cost-effectiveness evidence for the GDG to consider when making recommendations. Firstly, a review of the health economic literature was carried out and relevant health economic evidence was presented to the GDG. Secondly, further economic analysis was carried out in the priority areas where there was insufficient evidence available from the published literature to inform recommendations and where there was sufficient evidence to demonstrate the clinical effectiveness for the intervention or diagnostic strategy. This further economic analysis was conducted in the form of a cost-effectiveness analysis where the additional benefits were measured in terms of quality-adjusted life-years (QALYs) and the additional costs were assessed from an NHS and personal social services perspective. The GDG considered the incremental cost per QALY for alternative management and diagnostic strategies alongside the clinical effectiveness evidence when formulating recommendations. Where one clinical strategy was clearly more effective and less costly than another it was considered cost-effective. Where one strategy was more effective but also more costly, the incremental cost per QALY was estimated and this was compared to a cost-effectiveness threshold of £20,000 to £30,000 per QALY in line with the principals laid out in the NICE Guidelines Manual (NICE 2007). For those clinical questions not prioritised for economic analysis, the GDG considered the likely cost-effectiveness of associated recommendations by making a qualitative judgement on the likely balance of costs, health benefits and any potential harms.
5.3.1. Economic literature review methods
Background
The diagnostic review described in chapter 6 provides evidence on several criterion based reference tools that are useful in the diagnosis of IBS in patients who do not have “red-flag” symptoms. However, some patients meeting the diagnostic criteria for IBS, following the application of a criterion based reference tool, may have another disease which has similar symptoms to IBS, such as inflammatory bowel disease (Crohn’s disease and ulcerative colitis), coeliac disease or lactose intolerance. In some patients these conditions may be mistakenly diagnosed as IBS and sometimes they may be present alongside IBS. The health economic review aimed to assess whether further diagnostic testing to identify patients with alternative diagnoses is cost-effective in patients meeting the diagnostic criteria for IBS who do not have any “red-flag” symptoms.
The clinical effectiveness reviews presented in Chapters 7 to 10 assess the effectiveness of various interventions which may be useful in the management of IBS. The economic review aimed to assesses the cost-effectiveness of these interventions to manage IBS based on the published literature. Whilst pharmacological interventions and behavioural interventions were identified by the GDG as being priority areas for which cost-effectiveness evidence would have particular importance for informing recommendations, this review was not restricted to these interventions and evidence was included on any of the management interventions covered by this guideline.
OBJECTIVES
- ▪
To determine the cost-effectiveness of tests to identify alternative diagnoses in patients meeting the diagnostic criteria for IBS who do not have any “red-flag” symptoms.
- ▪
To assess the cost-effectiveness of interventions used in the management of IBS.
SELECTION CRITERIA
Types of studies
The types of studies included in the review were trial or model based economic evaluations including cost-effectiveness analyses, cost-utility analyses and cost-benefit analyses. Cost-minimisation studies were excluded except where therapeutic equivalence had been demonstrated.
Population
The population considered was patients meeting the diagnostic criteria for IBS who do not have any “red-flag” symptoms.
Types of intervention
The following interventions were considered: diagnostic tests for inflammatory bowel disease; coeliac disease; lactose intolerance; all interventions used in the management of IBS.
SEARCH STRATEGY FOR IDENTIFICATION OF STUDIES
Searches were performed on the MEDLINE database for objective 1 using the strategy given in appendix B. Specific searches were also performed on the NHS EED database using the MeSH terms for inflammatory bowel disease (exploded to include Crohn’s disease and ulcerative colitis), lactose intolerance and coeliac disease. Free-text searching on the NHS EED database was explored but did not yield any further relevant papers.
Searches were performed on the MEDLINE database for objective 2 using the strategy in Appendix B. Specific searches were also performed on the NHS EED database using the MeSH term for irritable bowel syndrome which yielded two further papers. Free-text searching on the NHS EED database was explored but did not yield any further relevant papers.
Included papers
The search results for both objectives were sifted together to allow identification of any cross- relevant information. Twenty-five papers were retrieved in full, of which 10 addressed the cost- effectiveness of management strategies (objective 2), with 4 included in the review, and 15 addressed the cost-effectiveness of tests to identify alternative diagnoses (objective 1), with 4 included in the review. Excluded papers and the reasons for exclusion are detailed in Appendix E. The most common reasons for exclusion were that the paper was not an economic evaluation or that it considered an inappropriate population. Included studies were reviewed by the health economist and the quality of each study was critically appraised using a validated check-list for economic analyses (Drummond 1997). Each study is discussed under the clinical question it addresses within chapters 6 to 10 of the guideline. The characteristics of the included studies are given in Appendix C and the details of the quality assessment are provided in of Appendix D.
5.3.2. Cost-effectiveness modelling methods
Having considered the published clinical and cost-effectiveness evidence on the use of diagnostic tests in people with IBS, the GDG decided that further economic analysis was needed to determine the cost-effectiveness of serological tests for coeliac disease in people meeting the IBS diagnostic criteria compared to initiating IBS management without testing for coeliac disease. This was done by adapting one of the published economic analyses to make it more applicable to the NHS in England and Wales. Further details on the cost-effectiveness analysis carried out for this area of the guideline is provided in Chapter 6.
There was insufficient cost-effectiveness data identified from the published literature to allow the GDG to determine whether each of the various management interventions were cost-effective. An economic analysis was carried out to estimate the cost-effectiveness of pharmacological interventions and behavioural interventions in the management of IBS as these had been identified by the GDG as areas where cost-effectiveness evidence would be particularly important in informing recommendations. The remainder of this chapter describes the methods used in this economic analysis. The results are presented in the relevant chapter subsection for each pharmacological intervention and behavioural therapy.
The general approach
- ▪
Two models were developed to estimate the cost-effectiveness for different types of IBS management interventions:
- A long-term maintenance therapy model for pharmacological interventions which are taken on a regular basis such as laxatives, anti-motility agents, antispasmodics, tricyclics and SSRIs.
- A “one-off” intervention model for behavioural interventions (CBT, psychotherapy and hypnotherapy) which are given over a defined period with the expectation that benefit continues beyond the intervention period.
- ▪
Modelling was carried out using the best available evidence
- ▪
Assumptions made in the model have been described explicitly. The validity of these assumptions was discussed with the GDG during the development of the model and the interpretation of the cost-effectiveness results
- ▪
The importance of model assumptions was examined through univariate sensitivity analysis
- ▪
Parameter uncertainty was explored by carrying out a probabilistic sensitivity analysis (PSA)
- ▪
Limitations of the analysis are explicitly discussed alongside the cost-effectiveness results.
Identifying evidence on prognosis, resource use and quality of life
A rapid literature review was carried out to identify data which could be used to inform the health economic modelling. This review had three objectives:
- ▪
To identify cohort studies providing prognostic data which could be used to inform the health economic model by determining health states which could be used to describe the natural history of IBS
- ▪
To identify quality of life data measured in people with IBS and determine what factors influence quality of life in IBS and how estimates of quality of life could be incorporated to reflect the natural history of IBS or the impact of interventions on quality of life in the economic model
- ▪
To identify estimates of health care resource use and costs for people with IBS and determine what factors influence resource use in IBS and how estimates of resource use could be incorporated to reflect the natural history of IBS or the impact of interventions on resource use in the economic model.
The methods and results of this review are described in Appendix F. Where the data from this review has been used to inform the economic model it has been discussed in the relevant methods section below.
Key assumptions
- ▪
The model used estimates of clinical effectiveness that were obtained from the systematic reviews of RCTs. These clinical effectiveness reviews combined the results from studies across the whole class (e.g. all antispasmodics), but also examined subgroups of that class (e.g. antimuscarics and direct-action smooth muscle relaxants). The model used a combined estimate of clinical effectiveness across the whole class unless there was evidence to demonstrate a significant difference in effectiveness between sub-groups or between interventions (e.g. individual drugs).
- ▪
Clinical effectiveness was estimated in the model by considering the proportion of patients who experienced a global improvement of symptoms. This was the primary outcome of the clinical effectiveness review and was also considered by the GDG to be closely related to an improvement in quality of life across the many different interventions considered by the economic model. Where evidence on global improvement of symptoms was unavailable, a symptom specific response rate was used after discussion with the GDG as to which of the available outcomes was most relevant. The efficacy data used for each individual class of interventions is discussed within the relevant chapter sub-section for that intervention.
- ▪
Cost-effectiveness was estimated for each IBS subtype (e.g. IBS-D/C/A) for which there was evidence of clinical effectiveness or for the population as a whole if trials did not show a difference in effectiveness between subgroups or did not provide effectiveness evidence by subgroup. The GDG considered whether the estimated cost-effectiveness was likely to apply equally to all IBS subtypes when formulating recommendations.
- ▪
Interventions which did not have sufficient evidence to demonstrate clinical effectiveness were excluded from the cost-effectiveness analysis. This judgement was made by the GDG after considering the clinical effectiveness evidence for each intervention.
- ▪
The model for long-term maintenance therapies estimated the cost-effectiveness of initiating therapy with interventions from within a particular class using a defined patient pathway. This management strategy was compared to a “no treatment” alternative in which patients were not given any specific intervention and were not advised to return for follow-up. The “no treatment” alternative provided a common baseline, against which the costs and benefits of interventions from different classes could be assessed.
- ▪
The model for “one-off” interventions considered the addition of psychological interventions to usual care compared to usual care alone in patients with refractory IBS. The population and comparator were selected to reflect the available RCT evidence on the clinical effectiveness of psychological interventions. The RCTs for these behavioural interventions were considered by the GDG to be representative of patients with refractory IBS. In the majority of these trials ongoing IBS drug therapy was continued in both arms of the trial. The GDG interpreted these RCTs as reflecting the clinical effectiveness of adding behavioural therapy to usual care rather than replacing usual care with behavioural therapy.
- ▪
The cost-effectiveness of initiating therapy with either interventions from class A or interventions from class B was assessed where these represented mutually exclusive alternatives. Direct evidence comparing interventions from different classes was used where available. Otherwise, an indirect comparison was made using “no treatment” as the common comparator. However, these indirect comparisons should be treated with caution as they were not based on randomised comparisons and may be subject to bias.
- ▪
The majority of the pharmacological interventions are used to treat a specific aspect of the individual’s symptom profile and can therefore be used in combination if more than one symptom is problematic. In this case they are not mutually exclusive alternatives and the incremental cost-effectiveness of one compared to the other has not been estimated.
Cost-effectiveness of intermittent use of maintenance treatments
- ▪
The intermittent use of maintenance treatments was considered by scaling drug costs and benefits by the proportion of days on which the treatment is used.
- ▪
If two interventions are used intermittently but not concurrently, for example laxatives and anti-motility agents in patients with IBS-A, the costs and benefits of each intervention were scaled according to the proportion of days on which they were used and the total costs and benefits have been summed across both interventions. The assumption here was that the benefit gained from treating a particular IBS symptom which was present on some days was independent of the benefit gained from treating another IBS symptom which was present on other days.
Cost-effectiveness of combined use of maintenance treatments
- ▪
The combined use of two interventions from different classes concurrently was not explicitly modelled as there was no direct evidence on the use of combined versus single interventions in the management of IBS. The cost-effectiveness of using maintenance treatments in combination was considered qualitatively by the GDG based on the cost-effectiveness evidence for individual treatments and the likely additive effects of the interventions on costs and benefits.
Determining the clinical pathway for maintenance interventions
In order to estimate the cost-effectiveness of maintenance interventions it was necessary to quantify the costs associated with prescribing and monitoring interventions and an appropriate time-frame for the analysis in terms of the duration over which costs and benefits were expected to differ as a result of a decision by a health care professional to initiate a particular a intervention.
There was evidence from the prognostic data reviewed in Appendix G that a patient’s predominant symptom may change over medium term intervals (1–3 months) resulting in them switching between IBS subtype classifications. Evidence from Drossman (2005) showed that only 24.2% of patients remained in their baseline subtype over the study duration of 15 months. This suggests that any long-term maintenance therapy should be regularly reviewed to assess its continued relevance to the patient’s evolving symptom profile. On the basis of this evidence the model was developed to consider periods of 6 months. In the first 6 months we estimated the cost-effectiveness of initiating a long-term maintenance therapy. We then estimated the cost-effectiveness of continuing the intervention for another 6 months in individuals who continue to experience a therapeutic benefit from the intervention.
The clinical pathway modelled is described in detail below and summarised in Figure 1 using antispasmodic therapy as an example. A slightly modified patient pathway has been used for tricyclics and SSRIs as these interventions require more frequent follow-up. This is described in detail in the tricyclics and SSRI section of Chapter 8.
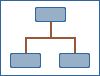
Figure 1. Patient pathway for maintenance therapies illustrated for antispasmodics (PDF, 54K)
Clinical pathway for maintenance model (See Figure 1 above)
- ▪
Patients initially receive the lowest cost intervention from within a class if there is no difference in effectiveness within the class (if there is a difference, each of the alternative interventions has been considered to estimate which is the most cost-effective to use first).
- ▪
Patients who demonstrate a successful response after 1 month continue on therapy until 6 months after treatment was initiated.
- ▪
Patients who do not respond switch to the next lowest cost therapy and response is assessed again after 1 month.
- ▪
The number of switches is limited by the number of effective interventions available.
- ▪
All patients receiving pharmacological maintenance interventions are reviewed after 6 months to assess whether the class of intervention is still relevant to the symptom profile.
- ▪
The above treatment pathway was compared to a “no treatment” alternative in which patients are not given any specific intervention and are not advised to return for follow-up.
- ▪
An analysis was undertaken to assess the maximum number of switches that are cost-effective by considering the additional cost and benefit of each additional switch of therapy.
- ▪
Probability of response to each subsequent intervention within a class was assumed to be independent of the response to previous interventions. A sensitivity analysis using lower response rates of 50% and 0% was carried out to test the impact of this assumption on cost-effectiveness.
- ▪
It was assumed that there is no fall off in treatment effect during the six month period for patients who have responded during the first month. This is an approximation, as some patients may experience a reduction in efficacy over time and may withdraw from treatment but the impact of this on cost-effectiveness is likely to be small given that treatment is reviewed every 6 months and patients are likely to discontinue therapy if it is no longer effective.
- ▪
It was assumed that the treatment effects do not persist after an intervention has been discontinued. This means that patients who stop therapy are assumed to return to their previous health state and patients who switch therapy do not experience the combined effects of both therapies in the cross-over period.
Clinical pathway for one-off interventions
- ▪
One-off interventions are given over a defined period with the expectation that benefit continues beyond that period.
- ▪
Follow-up data from trials were used to estimate the rate of fall-off in effectiveness and the time until no further benefit is expected. This determined the duration of the cost-effectiveness analysis.
- ▪
The number of patients responding over the duration of intervention and follow-up was fitted to the data available from the RCTs. Between the time points for which data is available we have assumed that the rate of change in effect is constant.
- ▪
Where the evidence was equivocal, such that alternative assumptions on the rate of fall-off in effectiveness could be justified, these alternative assumptions were considered in sensitivity analysis to assess how they alter the cost-effectiveness.
- ▪
Where the duration of continued effectiveness is over 1 year, discounting at 3.5% was applied to estimate the net present value of future costs and benefits.
Estimating the benefits associated with response to treatment
- ▪
In order to estimate cost-effectiveness it was necessary to estimate the benefits associated with treatment. In general these may be a gain in duration or quality of life, or a reduction in NHS resource use (such as fewer GP consultations).
- ▪
There was evidence from the literature review detailed in Appendix G to show that HRQoL is lower in patients with IBS than in matched controls (Akehurst 2002) and that HRQoL varies significantly by symptom frequency and severity but not by IBS subtype (El-Serag 2002). Akehurst (2002) found that resource use was significantly higher in patients with IBS than matched controls, but the evidence on resource use by symptom frequency, severity or IBS subtype was inconsistent (see Appendix G). We assumed in the model that patients responding to treatment experience a gain in health related quality of life but no reduction in resource use unless there was direct evidence from RCTs to demonstrate reduced resource use. We did not consider survival gains as IBS management interventions are not expected to affect survival.
- ▪
Utility is a measure of health related quality of life where a score of 1 represents full health and a score of 0 is a health state equivalent to death. Using the data presented in Mearin (2004) we estimated health state utility scores for high and low severity symptoms by aggregating scores across the IBS subtypes for patients with high frequency symptoms (present >50% of the time). This gave an estimated mean health state utility of 0.704 for patients with high severity symptoms and 0.775 for patients with low severity symptoms. We assumed that the utility gain associated with response to treatment was equivalent to an improvement in symptom severity (high to low severity). This was equivalent to an additional 0.071 QALYs per year of continued response (Mearin 2005). For comparison, an additional 0.135 QALYs would represent a complete resolution of IBS symptoms (Akehurst 2002). Our method for estimating QALY gain is quite crude as it assumes that all patients who experience a therapeutic response have the same increase in HRQoL and it does not distinguish between varying degrees of improvement in HRQoL. Where possible, we have used an improvement in global symptoms to determine whether there has been a therapeutic response to treatment in order to prevent bias being introduced by the use of different outcomes for different interventions.
- ▪
Given the limitations of the approach used to estimate QALY gains, a threshold analysis was also carried out to estimate the minimum treatment associated QALY gain for which treatment is still cost-effective.
- ▪
Adverse effects were not explicitly included in the model. Many of the adverse outcomes of interest considered in the adverse effects review (see section 8.5) were very similar to the symptoms of the IBS itself and were also considered within the effectiveness outcomes. It is likely that these adverse effects would have been captured by the clinical effectiveness estimate as this was based on global symptom score improvement. Therefore, patients who experienced a worsening of their IBS symptoms as a result of a specific intervention would be considered to have not responded to that intervention in the model and would discontinue that treatment. No other adverse effects were identified by the GDG as having the potential to significantly impact on costs and quality of life for the interventions considered by the economic model.
Estimating the costs of the patient pathway
- ▪
Costs were considered from an NHS and PSS (Personal Social Services) perspective and included: drug costs for prescribed medications, consultation costs for the behavioural therapies and consultation costs for initiating and monitoring pharmacological interventions.
- ▪
Drug costs were based on the doses used in clinical trials and it was assumed that the lowest cost preparation would be prescribed regardless of whether this is proprietary or generic. Drug costs were based on the published costs given in the British National Formulary (Joint Formulary Committee 2007).
- ▪
Sensitivity analysis was carried out to consider whether the cost-effectiveness would be significantly different if the most costly preparation were to be used.
- ▪
Sensitivity analysis was carried out on alternative doses to those used in the trials where the GDG advised that these alternative doses were likely to be equally efficacious and more relevant to clinical practice.
- ▪
The cost of non-pharmacological interventions was estimated using the duration of clinical contact time required to deliver the intervention and the reference costs (Netten 2006) for face-to-face time with the relevant healthcare professional.
Estimating the probability of an improvement in global symptoms
- ▪
The probability of response was taken from the clinical effectiveness review using the probability of an improvement in global symptoms, unless this was unavailable. In that case an alternative symptom specific response rate was used after discussion with the GDG as to which of the available outcomes was most relevant. The efficacy data used for each individual class of interventions is discussed within the relevant chapter sub-section for that intervention.
- ▪
In the management intervention model, the cost-effectiveness was dependent on (i) the number of additional patients who respond in the treatment arm compared to the control arm, and (ii) the number failing to respond to treatment as these patients incur one month of treatment cost without benefit. In the one-off intervention model, the cost-effectiveness was also dependent on the probability of response in the comparator arm as this determines the absolute difference in response rates and therefore the clinical benefit.
- ▪
There was evidence from cohort studies that some patients experience an initial improvement in symptoms without any specific intervention. This may be a non-specific treatment effect following diagnosis and reassurance or it may be that symptoms fluctuate naturally and patients consult when their symptoms are particularly bad but symptoms then improve without any intervention. There was also evidence from randomised controlled trials that some patients in the placebo arms of controlled trials experienced an improvement in symptoms.
- ▪
Therefore we assumed a non-zero response rate in the no treatment arm of the model.
- ▪
The probability of moving from a high to low symptom severity state estimated from the Mearin (2004) cohort study (45%) was used to estimate the response rate in the no treatment arm in the base case analysis, except where the population was deemed to be refractory.
- ▪
The RCTs for behavioural interventions (CBT, psychotherapy and hypnotherapy) were considered to be representative of patients with refractory IBS. In the majority of these trials ongoing IBS drug therapy was continued in both arms of the trial. The mean response rate from the comparator arms of these trials (25%) was used to estimate the proportion of patients with refractory IBS that experienced an improvement in global symptoms under usual care which included the continuation of any ongoing drug therapy.
- ▪
A sensitivity analysis was carried out using the average response rate in the placebo arm of the RCTs. The response rate in the comparator arm of the RCTs varied from 0% to 71% over the studies used to estimate efficacy for the economic model with a mean value of 47.5%. The studies from the laxative review could not be used to estimate the placebo arm response rate as a different outcome was used to determine response for this intervention. However, the response rate using the alternative outcome was similar to that found in the other studies for the standard outcome.
- ▪
For refractory patients, the mean response rate from the control arms of the CBT trials (9%) was used in a sensitivity analysis to examine the impact of assuming a lower response rate in refractory patients continuing usual care.
- ▪
A sensitivity analysis was carried out assuming zero response in the no treatment arm but maintaining the absolute difference in response between treatment and no treatment from the basecase analysis.
Probabilistic sensitivity analysis (PSA) is used to provide an estimate of the uncertainty in the cost per QALY estimate due to uncertainty in the model parameters used to estimate the cost-effectiveness. The most obvious example of parameter uncertainty in the model was the confidence intervals surrounding the clinical effectiveness estimates, but other parameters used in the model which were based on empirical measurement also had some uncertainty associated with them. We carried out a PSA which considered the parameter uncertainty around the clinical effectiveness estimates, the response rate in the comparator arm, the utility gain associated with a response to treatment and the costs of psychological interventions due to variation in the number and duration of sessions used in the RCTs. Where direct evidence from the RCTs on resource use reduction was applied in the model, the parameter uncertainty around this was also estimated in the PSA. The reference costs for pharmaceutical interventions and clinical contact time with health care professionals were assumed to be fixed in the model, as was the discounting rate which was fixed by the NICE “reference-case” for economic evaluations (NICE 2007). In the PSA we characterised the parameter uncertainty by using a probability distribution to describe each of the parameters, details of which can be found in Appendix H. We then sampled from each distribution independently under the assumption that there was no correlation between the different input parameters. However, the same random number set was used to sample common parameters across the different cost-effectiveness comparisons to prevent sample bias being introduced when comparing the incremental cost-effectiveness of two interventions. We then calculated the model outcomes (incremental costs, incremental QALY gains) for each set of sampled parameters and used these to estimate the uncertainty surrounding the cost per QALY estimate.
We based our PSA on 1000 samples of the parameter distributions. The results are presented as cost-effectiveness acceptability curves which show the proportion of samples that resulted in a cost per QALY value below various thresholds. It should be noted that the PSA did not account for uncertainty around the model assumptions and these were explored separately using univariate sensitivity analysis. Table 1 gives the basecase parameters that were used in estimating the cost-effectiveness of all of the pharmacological and behavioural interventions. Parameters that were specific to each intervention, such as efficacy estimates and intervention costs, are tabled in the relevant section of Chapters 8 and 9.
Table 1
Base case parameters applied in the economic model for all interventions.
5.4. Submission of evidence
No formal request was made for submission of evidence.
5.5. Formulating recommendations and determining key recommendations
EVIDENCE TO RECOMMENDATIONS
Each review summarises the evidence, and the GDG are asked to interpret the evidence before drafting recommendations. In each case, this includes a consideration of the clinical and cost effectiveness evidence; an indication of the factors the GDG took into account, including the balance between benefits and harms; the GDG’s reasoning and conclusions, and, where relevant, the level of agreement amongst the group.
This is reported in each individual review section, illustrating the relationship between published clinical and cost effective evidence and recommendations for clinical practice.
KEY RECOMMENDATIONS
Methodology
There are generally three main methods reported for developing consensus. These are Delphi, consensus development panels and nominal group processes (Bowling 2002). The nominal group technique (NGT) was originally developed by Delbecq et al (1971) as an organisational planning tool. The methodology allows individuals to work in the presence of others, but verbally interaction is prevented, enabling consensus to be developed without the social pressures normally exerted through open dialogue (Zastrow and Navarre 1977). Individual ideas are shared within the group, with facilitated discussion enabling the group to see how individuals are expressing their ideas. Normal practice is for the facilitator to then ask the group to prioritise, with aggregated rankings recorded. This methodology works extremely well towards the end of guideline development, particularly in relation to developing consensus agreement.
The GDG having worked together for the previous 12 meetings had become a mature working group; individuals within the group were able to express their views relating to key recommendations within a social setting (the last GDG meeting). This was important for the group, who were able to use this experience and the content of discussion to then go into a round of voting to move agreed recommendation into a potential top 10 list, which reflected the key priorities for the guideline. Iteration is usual within consensus methodology, and a second round of voting was necessary in order to gain full consensus within the group.
Process
The GDG was asked to vote on key recommendations by secret email ballot using an Excel spreadsheet. This incorporated the full list of recommendations and votes were allocated to the group, in order to try and determine the key priorities for the guideline. Developing consensus through validated instruments is key to ensure that the final list of up to ten key recommendations fully reflect the group as a whole. This enables all constituent members of the group to have equal weighting of opinion as their opinion moves towards a consensus group position. Typically, NGT works well for small groups, with 12 to 15 people widely acknowledged in the literature as the maximum number of people involved in this process.
Results in round 1: 15 GDG members voted (100%), but one voting paper was spoiled and we were unable to obtain clarification from this member. Therefore results were based on a 93% representive opinion of the GDG relating to Round 1 voting.
The results for this round of voting are seen below in table 1.
All recommendations with more than 50% of the vote were selected automatically as key recommendations; i.e. screening question, red flags, positive diagnosis, other diagnostic tests, tests that should not be done, fibre, and tricyclics. This gave seven recommendations, but the next highest results gave four recommendations with 7 votes. This determined the need for a second round of voting. Those recommendations with 2 or fewer votes were excluded, and the GDG were asked to choose three of nine recommendations. Between the two rounds, two recommendations were combined (the two relating to titration of medication doses) and the patient information recommendation was revised.
Results in round 2: 14 of 15 GDG members voted and one member only voted for two recommendations. Results are based on 93% group representive opinion of the GDG.

In analysing the voting for round 2, two further recommendations were selected: patient information and titrating doses of laxatives and antimotility agents. Two other recommendations had six votes each, general diet and psychological interventions and it was decided to exclude both of them, leaving the following nine key recommendations.
Summary
The NGT worked well in developing consensus opinion, reflected by the key recommendations emergent from the process. The nine key recommendations represent the heart of the full guideline and full guideline recommendations. They articulate the evidence supporting the key areas of healthcare practice that will be shaped by the guideline, providing the possibility with effective implementation for people with IBS symptoms being properly diagnosed and managed within primary care.
Footnotes
- ‡
GRADE – Grading of Recommendations Assessment, Development and Evaluation
- Methods used to develop the guideline - Irritable Bowel Syndrome in AdultsMethods used to develop the guideline - Irritable Bowel Syndrome in Adults
Your browsing activity is empty.
Activity recording is turned off.
See more...