About GEO Profiles
Background
The GEO Profiles database stores gene expression profiles derived from curated GEO DataSets. Each Profile is presented as a chart that displays the expression level of one gene across all Samples within a DataSet. Experimental context is provided in the bars along the bottom of the charts making it possible to see at a glance whether a gene is differentially expressed across different experimental conditions. Profiles have various types of links including internal links that connect genes that exhibit similar behaviour, and external links to relevant records in other NCBI databases.
GEO Profiles can be searched using many different attributes including keywords, gene symbols, gene names, GenBank accession numbers, or Profiles flagged as being differentially expressed. Examples and full details about how to search for GEO Profiles of interest are provided in the Querying GEO DataSets and GEO Profiles page.
Information about how GEO Profiles are generated, and how to use and interpret GEO Profiles results pages and charts is provided within the following annotated screenshots.
GEO Profiles Results Page
Consult the table below for information about how to use and interpret GEO Profile results pages.

GEO Profiles Chart
Consult the table below for information about how to use and interpret GEO Profile charts.

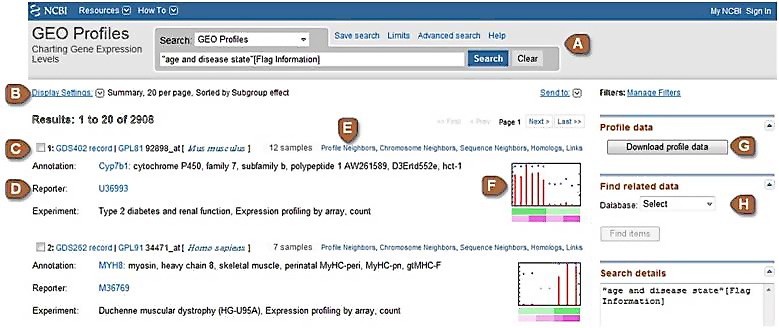
| A | Search box | Identify GEO Profiles of interest by entering keywords or a search statement into this box. Various terms can be used in the search, including gene names, gene symbols, GenBank accession numbers and flags that highlight genes that are differentially expressed across different experimental conditions. Examples and full details about how to construct search statements are provided in the Querying GEO DataSets and GEO Profiles page. Search results can be saved in your My NCBI account using the Collections feature. The GEO Profiles Advanced Search page provides user-friendly tools to help construct complex queries. |
|---|---|---|
| B | Display Settings and Send to | Use Display Settings to change the display format or the number of items to display. Use Send to to export the results as a plain text File, or save the results to the Clipboard or your My NCBI Collections. |
| C | Profile title line | Lists the DataSet accession (GDSxxx) from which the Profile is derived, the Platform accession (GPLxxx) upon which that DataSet is based, the unique identifier from the ID column of the Platform record, and the organism. |
| D | Annotation, Reporter and Experiment |
Annotation: The gene symbol, full name and aliases as listed in the NCBI Gene, UniGene or Nucleotide databases. At periodic intervals we query Gene, UniGene and Nucleotide with the original sequence Reporter (see below) information extracted from the submitter-supplied Platform record to derive this up-to-date annotation. Reporter: The original sequence reporter(s) extracted from the submitter-supplied Platform record. Typically, a reporter is a trackable sequence identifier such as a GenBank accession number or Clone ID. It is from these reporters that up-to-date Annotations (see above) are derived. Experiment: The title of the DataSet from which the Profile is derived, followed by the DataSet Type and Sample Value Type |
| E | Neighbors and Links |
Profile Neighbors: Connects Profiles that show a similar expression pattern to the chosen Profile within a DataSet. For each DataSet, Pearson correlation coefficients are calculated between pairs of Profiles. The top 200 results are arbitrarily considered to be Profile Neighbors. Pairs with low correlation coefficient values are filtered out using arbitrary thresholds. This feature may help identify functionally-related genes. Chromosome Neighbors: Connects the 20 physically closest genes on the chromosome from each side of the query gene within a DataSet. This feature may help investigate gene expression neighborhoods. Sequence Neighbors: Connects Profiles from across all DataSets that are related by nucleotide sequence similarity. Homologs: Connects genes related by Homologene group across all DataSets. Links: Reciprocal links to relevant records in other NCBI databases including Gene, UniGene, GenBank, PubMed and OMIM. Neighbors and Links can also be retrieved in batch mode, see Find related data section below. |
| F | Thumbnail chart | Each chart displays the expression level of one gene across all Samples within a DataSet. See the Full chart description below for color code, axis description and other details. The bars at the bottom of the chart represent experimental variable subsets. The thumbnail charts enable rapid visual scanning and comparison of multiple Profiles. Click on the thumbnail chart to reveal the Full chart. |
| G | Download profile data | Use this button to download the values and annotations for each Profile on the page. Download files are tab-delimited and suitable for opening in a spreadsheet application such as Excel. Retrievals that incorporate multiple DataSets are organized by DataSet blocks. Experimental factor and gene annotation information is included in the file. A download file includes Profiles shown on the current page; to get the maximum number of Profiles, go to the 'Display Settings' link and set the 'Items per page' to 500. Note that cross-DataSet normalizations are not performed, so direct comparisons of Profile values between different DataSets are not appropriate. |
| H | Find related data | This feature is similar to that described in the Neighbors and Links section above, but in batch mode. |
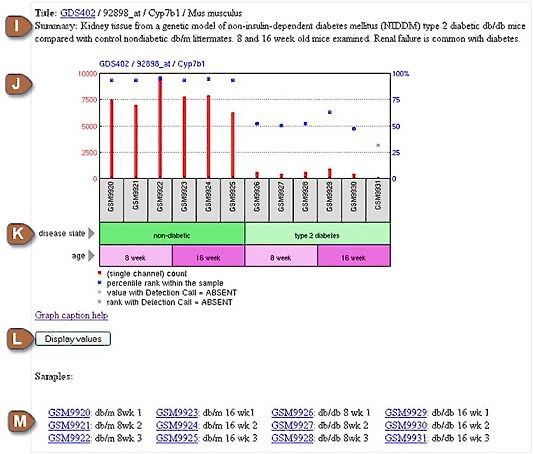
| I | Summary | The summary of the DataSet from which the Profile is derived. |
| J | Full chart |
Clicking on the thumbnail image will enlarge the chart to display the full profile details, expression values, and the DataSet subsets that reflect experimental design. Each chart displays the expression level of one gene across all Samples within a DataSet. Red column: Each column represents the expression measurement extracted from the VALUE column of one original submitter-supplied Sample record. The original Sample accessions (GSMxxx) are listed in the gray boxes along the bottom of the chart. Sample records are submitted by the scientific community and reflect a wide variety of data types that are processed and normalized using a wide variety of methods. There is no standard unit for gene expression and so expression values should be considered arbitrary units. It can be assumed that the value measurements within a GEO DataSet have been calculated in an equivalent manner, but it is not usually appropriate to make direct comparisons of values between different DataSets. Single channel samples are normalized signal count values, whereas dual channel samples are typically test/reference log ratios. Check the 'Data processing' field or VALUE description in original Sample records for information on how the VALUEs were calculated. Blue square: Represents rank order of expression measurements. All VALUEs within a Sample are rank ordered, and then placed into percentile 'bins'. In other words, all the values of one hybridization are sorted, then split into 100 groups. Thus, the blue rank squares on charts give an indication of where the expression of that gene falls with respect to all other genes on that array. It is important to note that the values (red columns) and ranks (blue squares) are charted on different scales - the blue ranks are always on a scale of 1-100% (right Y axis of the chart) while the red value scale slides to fit the values of a particular profile (left Y axis of the chart). This sliding value scale allows subtle differences in values to be more clearly visualized. Faded columns/squares: These correspond to Affymetrix 'Detection call' = Absent. Detection call is specific to Affymetrix technology. For details of the detection algorithm please refer to Affymetrix literature, e.g., Affymetrix GeneChip Expression Analysis and Affymetrix Statistical Algorithms Description Document. Briefly, a gene may be flagged as absent if expression is not detected or if stray cross-hybridization signals are detected. Extract from Affymetrix literature: "A detection call answers the question: Is the transcript of a particular gene Present or Absent? In this context, Absent means that the expression level is below the threshold of detection. That is, the expression level is not provably different from zero. In the case of an uncertainty, we can get a Marginal call. It is important to note that some probe-sets are more variable than others, and the minimal expression level provably different from zero may range from a small value to very large value (for a noisy probe-set)." Some Affymetrix submitters do not consider Detection calls and choose not to supply them, and some Affymetrix transformation algorithms do not generate them, in which cases the calls will not exist in GEO. |
| K | Experimental variables | The bars at the bottom of the chart represent experimental variable subsets within the DataSet. A subset may hold one or more Samples. Each subset has a type, e.g.,'disease state', and a description, e.g., 'type 2 diabetes'. In the chart above, Sample GSM9920 is derived from the kidney of non-diabetic 8 week-old mice. Click the subset type names to resort the Samples in the DataSet according to a particular experimental variable - this can assist in clearer visualization of an expression trend in experiments with multiple variables. For further details about a particular Sample, click the gray boxes that list the Sample accession numbers (GSMxxx). |
| L | Display values | Click to reveal the expression values that are presented in the chart. |
| M | Sample list | A listing of the Sample accession numbers and titles that constitute the DataSet. |

